Isles of Capri Airbnb Market Analysis 2026: Short Term Rental Data & Vacation Rental Statistics in Florida, United States
Is Airbnb profitable in Isles of Capri in 2026? Explore comprehensive Airbnb analytics for Isles of Capri, Florida, United States to uncover income potential. This 2026 STR market report for Isles of Capri, based on AirROI data from February 2025 to January 2026, reveals key trends in the niche market of 23 active listings.
Whether you're considering an Airbnb investment in Isles of Capri, optimizing your existing vacation rental, or exploring rental arbitrage opportunities, understanding the Isles of Capri Airbnb data is crucial. Leveraging the low regulation environment is key to maximizing your short term rental income potential. Let's dive into the specifics.
Key Isles of Capri Airbnb Performance Metrics Overview
Monthly Airbnb Revenue Variations & Income Potential in Isles of Capri (2026)
Understanding the monthly revenue variations for Airbnb listings in Isles of Capri is key to maximizing your short term rental income potential. Seasonality significantly impacts earnings. Our analysis, based on data from the past 12 months, shows that the peak revenue month for STRs in Isles of Capri is typically March, while September often presents the lowest earnings, highlighting opportunities for strategic pricing adjustments during shoulder and low seasons. Explore the typical Airbnb income in Isles of Capri across different performance tiers:
- Best-in-class properties (Top 10%) achieve $8,473+ monthly, often utilizing dynamic pricing and superior guest experiences.
- Strong performing properties (Top 25%) earn $6,096 or more, indicating effective management and desirable locations/amenities.
- Typical properties (Median) generate around $3,476 per month, representing the average market performance.
- Entry-level properties (Bottom 25%) see earnings around $1,769, often with potential for optimization.
Average Monthly Airbnb Earnings Trend in Isles of Capri
Isles of Capri Airbnb Occupancy Rate Trends (2026)
Maximize your bookings by understanding the Isles of Capri STR occupancy trends. Seasonal demand shifts significantly influence how often properties are booked. Typically, Marchsees the highest demand (peak season occupancy), while September experiences the lowest (low season). Effective strategies, like adjusting minimum stays or offering promotions, can boost occupancy during slower periods. Here's how different property tiers perform in Isles of Capri:
- Best-in-class properties (Top 10%) achieve 71%+ occupancy, indicating high desirability and potentially optimized availability.
- Strong performing properties (Top 25%) maintain 51% or higher occupancy, suggesting good market fit and guest satisfaction.
- Typical properties (Median) have an occupancy rate around 33%.
- Entry-level properties (Bottom 25%) average 18% occupancy, potentially facing higher vacancy.
Average Monthly Occupancy Rate Trend in Isles of Capri
Average Daily Rate (ADR) Airbnb Trends in Isles of Capri (2026)
Effective short term rental pricing strategy in Isles of Capri involves understanding monthly ADR fluctuations. The Average Daily Rate (ADR) for Airbnb in Isles of Capri typically peaks in January and dips lowest during August. Leveraging Airbnb dynamic pricing tools or strategies based on this seasonality can significantly boost revenue. Here's a look at the typical nightly rates achieved:
- Best-in-class properties (Top 10%) command rates of $542+ per night, often due to premium features or locations.
- Strong performing properties (Top 25%) achieve nightly rates of $448 or more.
- Typical properties (Median) charge around $351 per night.
- Entry-level properties (Bottom 25%) earn around $250 per night.
Average Daily Rate (ADR) Trend by Month in Isles of Capri
Get Live Isles of Capri Market Intelligence 👇

Explore Real-time Analytics
Airbnb Seasonality Analysis & Trends in Isles of Capri (2026)
Peak Season (March, February, April)
- Revenue averages $7,677 per month
- Occupancy rates average 61.1%
- Daily rates average $360
Shoulder Season
- Revenue averages $3,277 per month
- Occupancy maintains around 31.0%
- Daily rates hold near $353
Low Season (September, October, November)
- Revenue drops to average $2,107 per month
- Occupancy decreases to average 24.2%
- Daily rates adjust to average $348
Seasonality Insights for Isles of Capri
- The Airbnb seasonality in Isles of Capri shows highly seasonal trends requiring careful strategy. While the sections above show seasonal averages, it's also insightful to look at the extremes:
- During the high season, the absolute peak month showcases Isles of Capri's highest earning potential, with monthly revenues capable of climbing to $9,458, occupancy reaching a high of 73.6%, and ADRs peaking at $417.
- Conversely, the slowest single month of the year, typically falling within the low season, marks the market's lowest point. In this month, revenue might dip to $1,520, occupancy could drop to 17.4%, and ADRs may adjust down to $326.
- Understanding both the seasonal averages and these monthly peaks and troughs in revenue, occupancy, and ADR is crucial for maximizing your Airbnb profit potential in Isles of Capri.
Seasonal Strategies for Maximizing Profit
- Peak Season: Maximize revenue through premium pricing and potentially longer minimum stays. Ensure high availability.
- Low Season: Offer competitive pricing, special promotions (e.g., extended stay discounts), and flexible cancellation policies. Target off-season travelers like remote workers or budget-conscious guests.
- Shoulder Seasons: Implement dynamic pricing that balances peak and low rates. Target weekend travelers or specific events. Offer slightly more flexible terms than peak season.
- Regularly analyze your own performance against these Isles of Capri seasonality benchmarks and adjust your pricing and availability strategy accordingly.
Best Areas for Airbnb Investment in Isles of Capri (2026)
Exploring the top neighborhoods for short-term rentals in Isles of Capri? This section highlights key areas, outlining why they are attractive for hosts and guests, along with notable local attractions. Consider these locations based on your target guest profile and investment strategy.
| Neighborhood / Area | Why Host Here? (Target Guests & Appeal) | Key Attractions & Landmarks |
|---|---|---|
| Tigertail Beach | A beautiful beach area known for its calm waters and pristine sand, making it a popular destination for families and beachgoers. Offers great opportunities for water sports and relaxation. | Tigertail Beach, Rookery Bay Reserve, Marco Island Water Sports, Caxambas Park, Tigertail Beach Park |
| Marco Island | This is the largest barrier island in Florida's Ten Thousand Islands. Its beautiful beaches and upscale resorts attract a variety of tourists, providing ample opportunity for investment and rentals. | Marco Island Historical Museum, Esplanade Shoppes, Tigertail Beach, Manatee Park, South Marco Beach |
| Naples | Famous for its high-end shopping, dining, and white sand beaches, Naples is a sought-after location for seasonal visitors and luxury travelers looking for upscale rentals. | Naples Pier, Fifth Avenue South, The Naples Botanical Garden, Clam Pass Park, Delnor-Wiggins Pass State Park |
| Goodland | A quaint community known for its fishing, boating, and laid-back atmosphere, Goodland attracts visitors seeking a true Florida lifestyle experience. | Goodland Boating Park, Collier-Seminole State Park, Goodland Arts and Crafts Festival, Little Marco Island, The Fish Trap |
| Isles of Capri | This picturesque community is located next to Marco Island and is perfect for those looking for a quieter retreat with close access to boating and fishing. | Capri Isles Boat Ramp, Isles of Capri Paddlecraft Park, Caxambas Pass, Restaurants on the water, Sunset views |
| Keewaydin Island | Known for its natural beauty and serenity, Keewaydin Island is a barrier island that's accessible only by boat. A perfect getaway for tourists looking for a unique beach experience. | Keewaydin Island State Park, Shelling and beachcombing, Wildlife viewing, Boat tours and rentals, Water sports |
| Sanibel Island | World-famous for its shelling beaches and wildlife, Sanibel Island attracts eco-tourists and families looking for relaxation and nature activities. | Sanibel Island Beaches, Ding Darling National Wildlife Refuge, Sanibel Lighthouse, Shell Museum, Biking trails |
| Captiva Island | A charming island known for its stunning sunsets and luxurious accommodations. Offers a romantic getaway for couples and families looking for a peaceful retreat. | Captiva Beach, Robert Rauschenberg Gallery, Captiva Village shops, Sunset Beach, Water sports |
Understanding Airbnb License Requirements & STR Laws in Isles of Capri (2026)
While Isles of Capri, Florida, United States currently shows low STR regulations, specific Airbnb license requirements might still exist or change. Always verify the latest short term rental regulations and Airbnb license requirements directly with local government authorities for Isles of Capri to ensure full compliance before hosting.
(Source: AirROI data, 2026, finding no licensed listings among those analyzed)
Top Performing Airbnb Properties in Isles of Capri (2026)
Benchmark your potential! Explore examples of top-performing Airbnb properties in Isles of Capribased on Trailing Twelve Month (TTM) revenue. Analyze their characteristics, revenue, occupancy rate, and ADR to understand what drives success in this market.
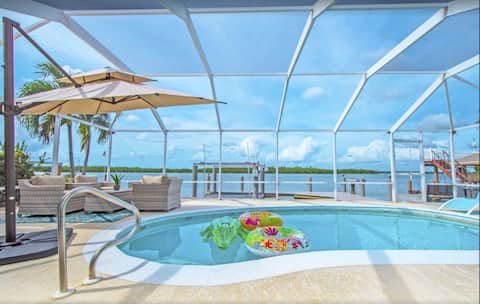
Waterfront Isles of Capri Home-Heated Pool & Dock
Entire Place • 3 bedrooms
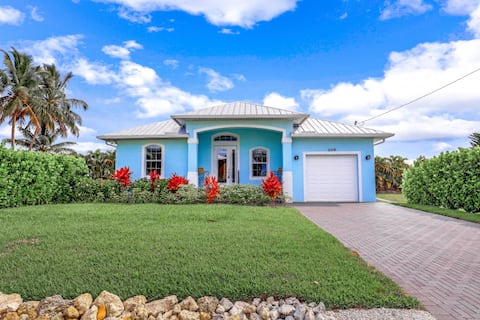
Island lifestyle family vacation home (Salt Pool)
Entire Place • 3 bedrooms
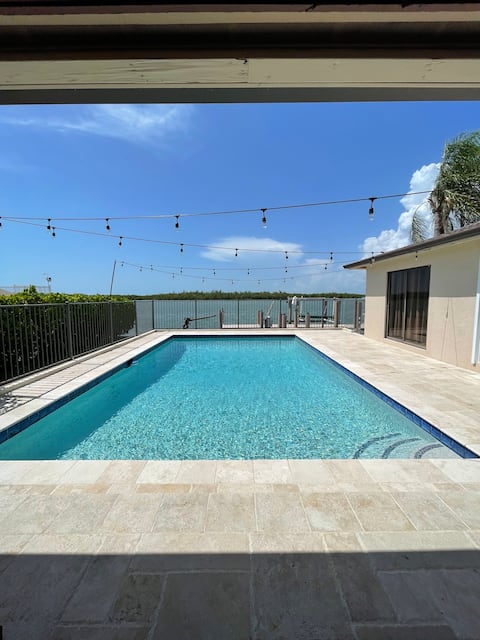
Waterfront 4BD Family Vacation Home w/Pool
Entire Place • 4 bedrooms
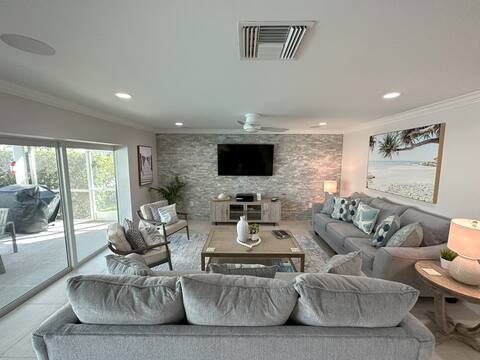
Luxurious Waterfront Retreat W/Heated Pool & Dock
Entire Place • 3 bedrooms

Dreamers Hideaway I Waterfront I Direct Access
Entire Place • 3 bedrooms
Beautiful house on the bay!
Entire Place • 2 bedrooms
Note: Performance varies based on location, size, amenities, seasonality, and management quality. Data reflects the past 12 months.
Top Performing Airbnb Hosts in Isles of Capri (2026)
Learn from the best! This table showcases top-performing Airbnb hosts in Isles of Capri based on the number of properties managed and estimated total revenue over the past year. Analyze their scale and performance metrics.
| Host Name | Properties | Grossing Revenue | Stay Reviews | Avg Rating |
|---|---|---|---|---|
| Greg & Eve | 1 | $90,759 | 18 | 5.00/5.0 |
| Nicholas | 1 | $89,477 | 266 | 4.97/5.0 |
| Eric | 1 | $78,198 | 49 | 4.96/5.0 |
| Silvio | 1 | $53,382 | 11 | 4.91/5.0 |
| Stephen | 1 | $48,441 | 4 | 5.00/5.0 |
| Jearim | 1 | $45,103 | 9 | 4.89/5.0 |
| Jon | 1 | $44,729 | 17 | 4.76/5.0 |
| Matthew & Nikki Kent | 1 | $41,372 | 23 | 5.00/5.0 |
| Shaina | 1 | $38,275 | 84 | 4.98/5.0 |
| Kevin | 1 | $36,734 | 14 | 5.00/5.0 |
Analyzing the strategies of top hosts, such as their property selection, pricing, and guest communication, can offer valuable lessons for optimizing your own Airbnb operations in Isles of Capri.
Dive Deeper: Advanced Isles of Capri STR Market Data (2026)
Ready to unlock more insights? AirROI provides access to advanced metrics and comprehensive Airbnb data for Isles of Capri. Explore detailed analytics beyond this report to refine your investment strategy, optimize pricing, and maximize your vacation rental profits.
Explore Advanced MetricsIsles of Capri Short-Term Rental Market Composition (2026): Property & Room Types
Room Type Distribution
Property Type Distribution
Market Composition Insights for Isles of Capri
- The Isles of Capri Airbnb market composition is heavily skewed towards Entire Home/Apt listings, which make up 100% of the 23 active rentals. This indicates strong guest preference for privacy and space.
- Looking at the property type distribution in Isles of Capri, House properties are the most common (78.3%), reflecting the local real estate landscape.
- Houses represent a significant 78.3% portion, catering likely to families or larger groups.
Isles of Capri Airbnb Room Capacity Analysis (2026): Bedroom Distribution
Distribution of Listings by Number of Bedrooms
Room Capacity Insights for Isles of Capri
- The dominant room capacity in Isles of Capri is 2 bedrooms listings, making up 52.2% of the market. This suggests a strong demand for properties suitable for couples or solo travelers.
- Together, 2 bedrooms and 3 bedrooms properties represent 78.3% of the active Airbnb listings in Isles of Capri, indicating a high concentration in these sizes.
- A significant 39.1% of listings offer 3+ bedrooms, catering to larger groups and families seeking more space in Isles of Capri.
Isles of Capri Vacation Rental Guest Capacity Trends (2026)
Distribution of Listings by Guest Capacity
Guest Capacity Insights for Isles of Capri
- The most common guest capacity trend in Isles of Capri vacation rentals is listings accommodating 6 guests (39.1%). This suggests the primary traveler segment is likely larger groups.
- Properties designed for 6 guests and 4 guests dominate the Isles of Capri STR market, accounting for 60.8% of listings.
- 65.2% of properties accommodate 6+ guests, serving the market segment for larger families or group travel in Isles of Capri.
- On average, properties in Isles of Capri are equipped to host 5.8 guests.
Isles of Capri Airbnb Booking Patterns (2026): Available vs. Booked Days
Available Days Distribution
Booked Days Distribution
Booking Pattern Insights for Isles of Capri
- The most common availability pattern in Isles of Capri falls within the 271-366 days range, representing 52.2% of listings. This suggests many properties have significant open periods on their calendars.
- Approximately 91.3% of listings show high availability (181+ days open annually), indicating potential for increased bookings or specific owner usage patterns.
- For booked days, the 91-180 days range is most frequent in Isles of Capri (39.1%), reflecting common guest stay durations or potential owner blocking patterns.
- A notable 8.6% of properties secure long booking periods (181+ days booked per year), highlighting successful long-term rental strategies or significant owner usage.
Isles of Capri Airbnb Minimum Stay Requirements Analysis
Distribution of Listings by Minimum Night Requirement
1 Night
1 listings
4.3% of total
2 Nights
4 listings
17.4% of total
3 Nights
2 listings
8.7% of total
4-6 Nights
5 listings
21.7% of total
7-29 Nights
2 listings
8.7% of total
30+ Nights
9 listings
39.1% of total
Key Insights
- The most prevalent minimum stay requirement in Isles of Capri is 30+ Nights, adopted by 39.1% of listings. This highlights the market's preference for longer commitments.
- A significant segment (39.1%) caters to monthly stays (30+ nights) in Isles of Capri, pointing to opportunities in the extended-stay market.
Recommendations
- Align with the market by considering a 30+ Nights minimum stay, as 39.1% of Isles of Capri hosts use this setting.
- If feasible, allowing 1-night stays, especially midweek or during low season, could capture last-minute bookings, as only 4.3% currently do.
- Explore offering discounts for stays of 30+ nights to attract the 39.1% of the market seeking extended stays.
- Adjust minimum nights based on seasonality – potentially shorter during low season and longer during peak demand periods in Isles of Capri.
Isles of Capri Airbnb Cancellation Policy Trends Analysis (2026)
Super Strict 60 Days
1 listings
4.5% of total
Super Strict 30 Days
1 listings
4.5% of total
Flexible
2 listings
9.1% of total
Moderate
4 listings
18.2% of total
Firm
10 listings
45.5% of total
Strict
4 listings
18.2% of total
Cancellation Policy Insights for Isles of Capri
- The prevailing Airbnb cancellation policy trend in Isles of Capri is Firm, used by 45.5% of listings.
- A majority (63.7%) of hosts in Isles of Capri utilize Firm or Strict policies, indicating a market where hosts prioritize booking security.
Recommendations for Hosts
- Consider adopting a Firm policy to align with the 45.5% market standard in Isles of Capri.
- Regularly review your cancellation policy against competitors and market demand shifts in Isles of Capri.
Isles of Capri STR Booking Lead Time Analysis (2026)
Average Booking Lead Time by Month
Booking Lead Time Insights for Isles of Capri
- The overall average booking lead time for vacation rentals in Isles of Capri is 59 days.
- Guests book furthest in advance for stays during December (average 100 days), likely coinciding with peak travel demand or local events.
- The shortest booking windows occur for stays in August (average 26 days), indicating more last-minute travel plans during this time.
- Seasonally, Winter (91 days avg.) sees the longest lead times, while Summer (47 days avg.) has the shortest, reflecting typical travel planning cycles.
Recommendations for Hosts
- Use the overall average lead time (59 days) as a baseline for your pricing and availability strategy in Isles of Capri.
- For December stays, consider implementing length-of-stay discounts or slightly higher rates for bookings made less than 100 days out to capitalize on advance planning.
- Target marketing efforts for the Winter season well in advance (at least 91 days) to capture early planners.
- Monitor your own booking lead times against these Isles of Capri averages to identify opportunities for dynamic pricing adjustments.
Popular & Essential Airbnb Amenities in Isles of Capri (2026)
Amenity Prevalence
Amenity Insights for Isles of Capri
- Essential amenities in Isles of Capri that guests expect include: Wifi, TV, Free parking on premises, Air conditioning, Smoke alarm, Bed linens, Coffee maker, Microwave, Kitchen, Dishes and silverware. Lacking these (any) could significantly impact bookings.
Recommendations for Hosts
- Ensure your listing includes all essential amenities for Isles of Capri: Wifi, TV, Free parking on premises, Air conditioning, Smoke alarm, Bed linens, Coffee maker, Microwave, Kitchen, Dishes and silverware.
- Prioritize adding missing essentials: Smoke alarm, Bed linens, Coffee maker, Microwave, Kitchen, Dishes and silverware.
- Highlight unique or less common amenities you offer (e.g., hot tub, dedicated workspace, EV charger) in your listing description and photos.
- Regularly check competitor amenities in Isles of Capri to stay competitive.
Isles of Capri Airbnb Guest Demographics & Profile Analysis (2026)
Guest Profile Summary for Isles of Capri
- The typical guest profile for Airbnb in Isles of Capri consists of primarily domestic travelers (95%), often arriving from nearby Bloomington, typically belonging to the Post-2000s (Gen Z/Alpha) group (50%), primarily speaking English or Spanish.
- Domestic travelers account for 95.3% of guests.
- Key international markets include United States (95.3%) and United Kingdom (2.3%).
- Top languages spoken are English (66%) followed by Spanish (15.1%).
- A significant demographic segment is the Post-2000s (Gen Z/Alpha) group, representing 50% of guests.
Recommendations for Hosts
- Target domestic marketing efforts towards travelers from Bloomington and New York.
- Tailor amenities and listing descriptions to appeal to the dominant Post-2000s (Gen Z/Alpha) demographic (e.g., highlight fast WiFi, smart home features, local guides).
- Highlight unique local experiences or amenities relevant to the primary guest profile.
- Consider seasonal promotions aligned with peak travel times for key origin markets.
Nearby Short-Term Rental Market Comparison
How does the Isles of Capri Airbnb market stack up against its neighbors? Compare key performance metrics like average monthly revenue, ADR, and occupancy rates in surrounding areas to understand the broader regional STR landscape.
| Market | Active Properties | Monthly Revenue | Daily Rate | Avg. Occupancy |
|---|---|---|---|---|
| Stock Island | 107 | $9,731 | $733.54 | 47% |
| Bal Harbour Village | 37 | $8,846 | $850.63 | 34% |
| Key West | 1,137 | $7,525 | $630.09 | 47% |
| Lake Clarke Shores | 26 | $6,710 | $516.52 | 46% |
| Lighthouse Point | 75 | $6,205 | $472.94 | 51% |
| Boca Grande | 31 | $6,128 | $787.07 | 37% |
| Pinecrest | 11 | $6,117 | $861.24 | 43% |
| North Bay Village | 120 | $6,032 | $561.12 | 44% |
| Captiva | 291 | $5,443 | $667.40 | 36% |
| Duck Key | 60 | $5,308 | $504.94 | 43% |