Indian Shores Airbnb Market Analysis 2026: Short Term Rental Data & Vacation Rental Statistics in Florida, United States
Is Airbnb profitable in Indian Shores in 2026? Explore comprehensive Airbnb analytics for Indian Shores, Florida, United States to uncover income potential. This 2026 STR market report for Indian Shores, based on AirROI data from February 2025 to January 2026, reveals key trends in the market of 629 active listings.
Whether you're considering an Airbnb investment in Indian Shores, optimizing your existing vacation rental, or exploring rental arbitrage opportunities, understanding the Indian Shores Airbnb data is crucial. Leveraging the low regulation environment is key to maximizing your short term rental income potential. Let's dive into the specifics.
Key Indian Shores Airbnb Performance Metrics Overview
Monthly Airbnb Revenue Variations & Income Potential in Indian Shores (2026)
Understanding the monthly revenue variations for Airbnb listings in Indian Shores is key to maximizing your short term rental income potential. Seasonality significantly impacts earnings. Our analysis, based on data from the past 12 months, shows that the peak revenue month for STRs in Indian Shores is typically March, while January often presents the lowest earnings, highlighting opportunities for strategic pricing adjustments during shoulder and low seasons. Explore the typical Airbnb income in Indian Shores across different performance tiers:
- Best-in-class properties (Top 10%) achieve $10,449+ monthly, often utilizing dynamic pricing and superior guest experiences.
- Strong performing properties (Top 25%) earn $6,876 or more, indicating effective management and desirable locations/amenities.
- Typical properties (Median) generate around $4,295 per month, representing the average market performance.
- Entry-level properties (Bottom 25%) see earnings around $2,415, often with potential for optimization.
Average Monthly Airbnb Earnings Trend in Indian Shores
Indian Shores Airbnb Occupancy Rate Trends (2026)
Maximize your bookings by understanding the Indian Shores STR occupancy trends. Seasonal demand shifts significantly influence how often properties are booked. Typically, Marchsees the highest demand (peak season occupancy), while January experiences the lowest (low season). Effective strategies, like adjusting minimum stays or offering promotions, can boost occupancy during slower periods. Here's how different property tiers perform in Indian Shores:
- Best-in-class properties (Top 10%) achieve 84%+ occupancy, indicating high desirability and potentially optimized availability.
- Strong performing properties (Top 25%) maintain 69% or higher occupancy, suggesting good market fit and guest satisfaction.
- Typical properties (Median) have an occupancy rate around 50%.
- Entry-level properties (Bottom 25%) average 28% occupancy, potentially facing higher vacancy.
Average Monthly Occupancy Rate Trend in Indian Shores
Average Daily Rate (ADR) Airbnb Trends in Indian Shores (2026)
Effective short term rental pricing strategy in Indian Shores involves understanding monthly ADR fluctuations. The Average Daily Rate (ADR) for Airbnb in Indian Shores typically peaks in March and dips lowest during September. Leveraging Airbnb dynamic pricing tools or strategies based on this seasonality can significantly boost revenue. Here's a look at the typical nightly rates achieved:
- Best-in-class properties (Top 10%) command rates of $484+ per night, often due to premium features or locations.
- Strong performing properties (Top 25%) achieve nightly rates of $373 or more.
- Typical properties (Median) charge around $278 per night.
- Entry-level properties (Bottom 25%) earn around $213 per night.
Average Daily Rate (ADR) Trend by Month in Indian Shores
Get Live Indian Shores Market Intelligence 👇

Explore Real-time Analytics
Airbnb Seasonality Analysis & Trends in Indian Shores (2026)
Peak Season (March, April, February)
- Revenue averages $7,693 per month
- Occupancy rates average 65.5%
- Daily rates average $341
Shoulder Season
- Revenue averages $5,074 per month
- Occupancy maintains around 47.3%
- Daily rates hold near $312
Low Season (January, September, November)
- Revenue drops to average $3,480 per month
- Occupancy decreases to average 35.3%
- Daily rates adjust to average $306
Seasonality Insights for Indian Shores
- The Airbnb seasonality in Indian Shores shows highly seasonal trends requiring careful strategy. While the sections above show seasonal averages, it's also insightful to look at the extremes:
- During the high season, the absolute peak month showcases Indian Shores's highest earning potential, with monthly revenues capable of climbing to $9,061, occupancy reaching a high of 70.7%, and ADRs peaking at $357.
- Conversely, the slowest single month of the year, typically falling within the low season, marks the market's lowest point. In this month, revenue might dip to $3,297, occupancy could drop to 30.2%, and ADRs may adjust down to $286.
- Understanding both the seasonal averages and these monthly peaks and troughs in revenue, occupancy, and ADR is crucial for maximizing your Airbnb profit potential in Indian Shores.
Seasonal Strategies for Maximizing Profit
- Peak Season: Maximize revenue through premium pricing and potentially longer minimum stays. Ensure high availability.
- Low Season: Offer competitive pricing, special promotions (e.g., extended stay discounts), and flexible cancellation policies. Target off-season travelers like remote workers or budget-conscious guests.
- Shoulder Seasons: Implement dynamic pricing that balances peak and low rates. Target weekend travelers or specific events. Offer slightly more flexible terms than peak season.
- Regularly analyze your own performance against these Indian Shores seasonality benchmarks and adjust your pricing and availability strategy accordingly.
Best Areas for Airbnb Investment in Indian Shores (2026)
Exploring the top neighborhoods for short-term rentals in Indian Shores? This section highlights key areas, outlining why they are attractive for hosts and guests, along with notable local attractions. Consider these locations based on your target guest profile and investment strategy.
| Neighborhood / Area | Why Host Here? (Target Guests & Appeal) | Key Attractions & Landmarks |
|---|---|---|
| Indian Shores Beach | A beautiful and quieter beach location compared to its neighbors, famous for its pristine sands and relaxing atmosphere. Ideal for families and couples looking for a peaceful getaway right on the Gulf of Mexico. | Indian Shores Nature Park, Tiki Gardens, Seaside Seabird Sanctuary, Gulf Coast beaches, local dining and cafes, fishing and boating activities |
| John's Pass Village & Boardwalk | A historic fishing village and boardwalk offering shopping, dining, and entertainment options. It’s a popular tourist destination with activities appealing to all ages. | John's Pass Bridge, waterfront dining, boat tours, shopping at local shops, live music events, dolphin watching |
| North Redington Beach | A family-friendly beach community providing a more laid-back atmosphere. Known for its long stretches of sandy beaches and beachfront parks, perfect for outdoor activities and relaxation. | Redington Long Pier, Constitution Park, beachfront dining, swimming and beachcombing, parks for picnics, kayaking and paddleboarding |
| Treasure Island | Located just south of Indian Shores, this lively beach offers a vibrant atmosphere with tons of local businesses and entertainment options. Great for those seeking a blend of relaxation and excitement. | Treasure Island Beach, John's Pass, Sunset Beach, water sports, local festivals and events, golf courses |
| Madeira Beach | Known for its wide beaches and warm Gulf waters, this beach town is perfect for families and offers various activities such as water sports and fishing. A well-loved location for both visitors and residents. | Madeira Beach Causeway Park, John's Pass Village, Gulf Boulevard shops, the local seafood restaurant scene, boat rentals, jetties for fishing |
| Clearwater Beach | A bit further north, Clearwater Beach is known for its award-winning sandy beaches and vibrant nightlife. It is one of the most popular tourist attractions with lots to do. | Clearwater Beach Pier 60, Clearwater Marine Aquarium, local shops and dining, water sports activities, festivals and events, sunset celebrations |
| St. Pete Beach | Vibrant and lively, St. Pete Beach has a beautiful coastline and lots of amenities. It's popular among tourists for its lively atmosphere, nightlife, and attractions. | Pass-a-Grille Beach, St. Pete Beach Community Center, water sports rentals, dining and nightlife, art galleries, shopping |
| Caladesi Island | A natural paradise known for its untouched beauty and pristine beaches. An ideal spot for nature lovers looking for a peaceful and picturesque getaway. | Caladesi Island State Park, beach trails, picnic areas, bird watching, kayaking, fishing opportunities |
Understanding Airbnb License Requirements & STR Laws in Indian Shores (2026)
While Indian Shores, Florida, United States currently shows low STR regulations, specific Airbnb license requirements might still exist or change. Always verify the latest short term rental regulations and Airbnb license requirements directly with local government authorities for Indian Shores to ensure full compliance before hosting.
(Source: AirROI data, 2026, finding no licensed listings among those analyzed)
Top Performing Airbnb Properties in Indian Shores (2026)
Benchmark your potential! Explore examples of top-performing Airbnb properties in Indian Shoresbased on Trailing Twelve Month (TTM) revenue. Analyze their characteristics, revenue, occupancy rate, and ADR to understand what drives success in this market.
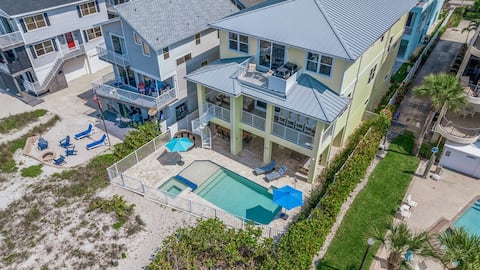
Beach Breeze Paradise w/Sunset Views & Heated Pool
Entire Place • 7 bedrooms
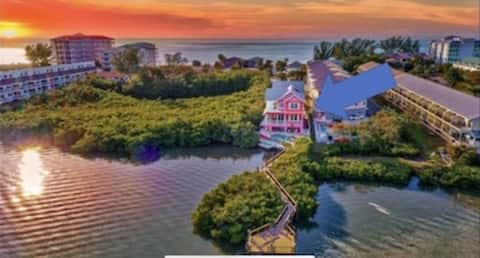
Dream Home Gulf- Intercoastal Views, Water Access
Entire Place • 6 bedrooms

Pipers Run 3 Secluded Beachfront Beauty EV Charger
Entire Place • 2 bedrooms

Pipers Run 8 InstaWorthy Beachfront Gem EV Charger
Entire Place • 3 bedrooms
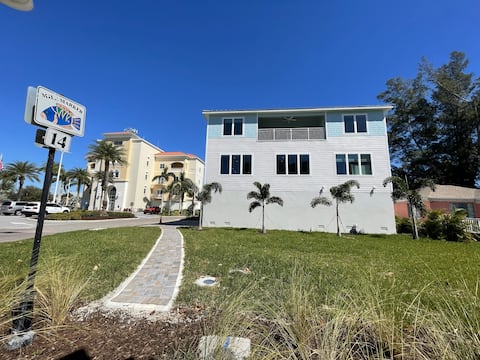
Coastal Breeze - Indian Shores - New Build!
Entire Place • 8 bedrooms
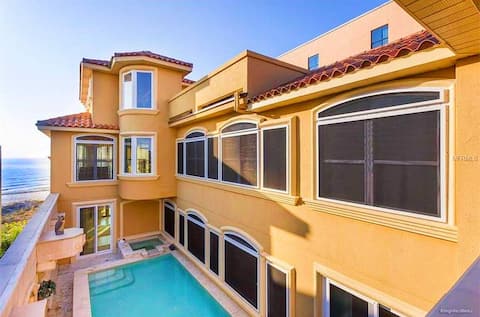
Sea View Beachfront Villa
Entire Place • 7 bedrooms
Note: Performance varies based on location, size, amenities, seasonality, and management quality. Data reflects the past 12 months.
Top Performing Airbnb Hosts in Indian Shores (2026)
Learn from the best! This table showcases top-performing Airbnb hosts in Indian Shores based on the number of properties managed and estimated total revenue over the past year. Analyze their scale and performance metrics.
| Host Name | Properties | Grossing Revenue | Stay Reviews | Avg Rating |
|---|---|---|---|---|
| Beaches USA Rentals And Manage | 30 | $1,991,655 | 1320 | 4.77/5.0 |
| Lindsey | 28 | $1,795,290 | 766 | 4.84/5.0 |
| Resort Rentals | 22 | $1,234,587 | 393 | 4.57/5.0 |
| Happy Place Vacation Rentals | 24 | $1,104,715 | 458 | 4.82/5.0 |
| Kevin | 20 | $743,672 | 377 | 4.58/5.0 |
| Carter Vacation Rentals | 9 | $679,300 | 486 | 4.50/5.0 |
| Jeff And Gina | 2 | $658,801 | 55 | 4.87/5.0 |
| Vacasa Florida | 37 | $622,842 | 941 | 4.65/5.0 |
| Joyce | 9 | $620,883 | 349 | 4.83/5.0 |
| Evolve | 14 | $575,058 | 635 | 4.72/5.0 |
Analyzing the strategies of top hosts, such as their property selection, pricing, and guest communication, can offer valuable lessons for optimizing your own Airbnb operations in Indian Shores.
Dive Deeper: Advanced Indian Shores STR Market Data (2026)
Ready to unlock more insights? AirROI provides access to advanced metrics and comprehensive Airbnb data for Indian Shores. Explore detailed analytics beyond this report to refine your investment strategy, optimize pricing, and maximize your vacation rental profits.
Explore Advanced MetricsIndian Shores Short-Term Rental Market Composition (2026): Property & Room Types
Room Type Distribution
Property Type Distribution
Market Composition Insights for Indian Shores
- The Indian Shores Airbnb market composition is heavily skewed towards Entire Home/Apt listings, which make up 100% of the 629 active rentals. This indicates strong guest preference for privacy and space.
- Looking at the property type distribution in Indian Shores, Apartment/Condo properties are the most common (86.3%), reflecting the local real estate landscape.
- Smaller segments like others (combined 0.2%) offer potential for unique stay experiences.
Indian Shores Airbnb Room Capacity Analysis (2026): Bedroom Distribution
Distribution of Listings by Number of Bedrooms
Room Capacity Insights for Indian Shores
- The dominant room capacity in Indian Shores is 2 bedrooms listings, making up 53.9% of the market. This suggests a strong demand for properties suitable for couples or solo travelers.
- Together, 2 bedrooms and 3 bedrooms properties represent 80.3% of the active Airbnb listings in Indian Shores, indicating a high concentration in these sizes.
- A significant 30.1% of listings offer 3+ bedrooms, catering to larger groups and families seeking more space in Indian Shores.
Indian Shores Vacation Rental Guest Capacity Trends (2026)
Distribution of Listings by Guest Capacity
Guest Capacity Insights for Indian Shores
- The most common guest capacity trend in Indian Shores vacation rentals is listings accommodating 6 guests (45.8%). This suggests the primary traveler segment is likely larger groups.
- Properties designed for 6 guests and 8+ guests dominate the Indian Shores STR market, accounting for 69.2% of listings.
- 72.1% of properties accommodate 6+ guests, serving the market segment for larger families or group travel in Indian Shores.
- On average, properties in Indian Shores are equipped to host 6.0 guests.
Indian Shores Airbnb Booking Patterns (2026): Available vs. Booked Days
Available Days Distribution
Booked Days Distribution
Booking Pattern Insights for Indian Shores
- The most common availability pattern in Indian Shores falls within the 271-366 days range, representing 39% of listings. This suggests many properties have significant open periods on their calendars.
- Approximately 71.8% of listings show high availability (181+ days open annually), indicating potential for increased bookings or specific owner usage patterns.
- For booked days, the 91-180 days range is most frequent in Indian Shores (31.8%), reflecting common guest stay durations or potential owner blocking patterns.
- A notable 30.2% of properties secure long booking periods (181+ days booked per year), highlighting successful long-term rental strategies or significant owner usage.
Indian Shores Airbnb Minimum Stay Requirements Analysis
Distribution of Listings by Minimum Night Requirement
1 Night
12 listings
1.9% of total
2 Nights
41 listings
6.5% of total
3 Nights
56 listings
8.9% of total
4-6 Nights
151 listings
24% of total
7-29 Nights
101 listings
16.1% of total
30+ Nights
267 listings
42.5% of total
Key Insights
- The most prevalent minimum stay requirement in Indian Shores is 30+ Nights, adopted by 42.5% of listings. This highlights the market's preference for longer commitments.
- Very short stays (1-2 nights) are less common (8.4%), suggesting hosts prefer slightly longer bookings to optimize turnover.
- A significant segment (42.5%) caters to monthly stays (30+ nights) in Indian Shores, pointing to opportunities in the extended-stay market.
Recommendations
- Align with the market by considering a 30+ Nights minimum stay, as 42.5% of Indian Shores hosts use this setting.
- If feasible, allowing 1-night stays, especially midweek or during low season, could capture last-minute bookings, as only 1.9% currently do.
- Explore offering discounts for stays of 30+ nights to attract the 42.5% of the market seeking extended stays.
- Adjust minimum nights based on seasonality – potentially shorter during low season and longer during peak demand periods in Indian Shores.
Indian Shores Airbnb Cancellation Policy Trends Analysis (2026)
Super Strict 30 Days
53 listings
8.5% of total
Limited
15 listings
2.4% of total
Super Strict 60 Days
17 listings
2.7% of total
Flexible
40 listings
6.4% of total
Moderate
128 listings
20.4% of total
Firm
300 listings
47.8% of total
Strict
74 listings
11.8% of total
Cancellation Policy Insights for Indian Shores
- The prevailing Airbnb cancellation policy trend in Indian Shores is Firm, used by 47.8% of listings.
- A majority (59.6%) of hosts in Indian Shores utilize Firm or Strict policies, indicating a market where hosts prioritize booking security.
Recommendations for Hosts
- Consider adopting a Firm policy to align with the 47.8% market standard in Indian Shores.
- Using a Strict policy might deter some guests, as only 11.8% of listings use it. Evaluate if potential revenue protection outweighs possible lower booking rates.
- Regularly review your cancellation policy against competitors and market demand shifts in Indian Shores.
Indian Shores STR Booking Lead Time Analysis (2026)
Average Booking Lead Time by Month
Booking Lead Time Insights for Indian Shores
- The overall average booking lead time for vacation rentals in Indian Shores is 79 days.
- Guests book furthest in advance for stays during February (average 119 days), likely coinciding with peak travel demand or local events.
- The shortest booking windows occur for stays in August (average 58 days), indicating more last-minute travel plans during this time.
- Seasonally, Winter (96 days avg.) sees the longest lead times, while Summer (63 days avg.) has the shortest, reflecting typical travel planning cycles.
Recommendations for Hosts
- Use the overall average lead time (79 days) as a baseline for your pricing and availability strategy in Indian Shores.
- For February stays, consider implementing length-of-stay discounts or slightly higher rates for bookings made less than 119 days out to capitalize on advance planning.
- Target marketing efforts for the Winter season well in advance (at least 96 days) to capture early planners.
- Monitor your own booking lead times against these Indian Shores averages to identify opportunities for dynamic pricing adjustments.
Popular & Essential Airbnb Amenities in Indian Shores (2026)
Amenity Prevalence
Amenity Insights for Indian Shores
- Essential amenities in Indian Shores that guests expect include: Wifi, Air conditioning, Kitchen, TV, Free parking on premises, Smoke alarm. Lacking these (any) could significantly impact bookings.
- Popular amenities like Microwave, Coffee maker, Refrigerator are common but not universal. Offering these can provide a competitive edge.
Recommendations for Hosts
- Ensure your listing includes all essential amenities for Indian Shores: Wifi, Air conditioning, Kitchen, TV, Free parking on premises, Smoke alarm.
- Prioritize adding missing essentials: Air conditioning, Kitchen, TV, Free parking on premises, Smoke alarm.
- Consider adding popular differentiators like Microwave or Coffee maker to increase appeal.
- Highlight unique or less common amenities you offer (e.g., hot tub, dedicated workspace, EV charger) in your listing description and photos.
- Regularly check competitor amenities in Indian Shores to stay competitive.
Indian Shores Airbnb Guest Demographics & Profile Analysis (2026)
Guest Profile Summary for Indian Shores
- The typical guest profile for Airbnb in Indian Shores consists of primarily domestic travelers (94%), often arriving from nearby Tampa, typically belonging to the Post-2000s (Gen Z/Alpha) group (50%), primarily speaking English or Spanish.
- Domestic travelers account for 94.4% of guests.
- Key international markets include United States (94.4%) and Canada (2.3%).
- Top languages spoken are English (76.8%) followed by Spanish (10.4%).
- A significant demographic segment is the Post-2000s (Gen Z/Alpha) group, representing 50% of guests.
Recommendations for Hosts
- Target domestic marketing efforts towards travelers from Tampa and Orlando.
- Tailor amenities and listing descriptions to appeal to the dominant Post-2000s (Gen Z/Alpha) demographic (e.g., highlight fast WiFi, smart home features, local guides).
- Highlight unique local experiences or amenities relevant to the primary guest profile.
- Consider seasonal promotions aligned with peak travel times for key origin markets.
Nearby Short-Term Rental Market Comparison
How does the Indian Shores Airbnb market stack up against its neighbors? Compare key performance metrics like average monthly revenue, ADR, and occupancy rates in surrounding areas to understand the broader regional STR landscape.
| Market | Active Properties | Monthly Revenue | Daily Rate | Avg. Occupancy |
|---|---|---|---|---|
| Anna Maria island | 587 | $7,996 | $823.96 | 41% |
| Anna Maria | 56 | $6,434 | $692.96 | 52% |
| Reunion | 12 | $6,321 | $580.45 | 44% |
| Boca Grande | 31 | $6,128 | $787.07 | 37% |
| Indian Rocks Beach | 842 | $5,560 | $419.63 | 49% |
| Captiva | 291 | $5,443 | $667.40 | 36% |
| Siesta Key | 1,175 | $5,206 | $518.91 | 42% |
| Belleair Beach | 94 | $5,086 | $339.65 | 53% |
| Bradenton Beach | 122 | $4,977 | $507.12 | 42% |
| Thonotosassa | 17 | $4,309 | $347.75 | 50% |