Indian Pass Airbnb Market Analysis 2026: Short Term Rental Data & Vacation Rental Statistics in Florida, United States
Is Airbnb profitable in Indian Pass in 2026? Explore comprehensive Airbnb analytics for Indian Pass, Florida, United States to uncover income potential. This 2026 STR market report for Indian Pass, based on AirROI data from February 2025 to January 2026, reveals key trends in the niche market of 35 active listings.
Whether you're considering an Airbnb investment in Indian Pass, optimizing your existing vacation rental, or exploring rental arbitrage opportunities, understanding the Indian Pass Airbnb data is crucial. Leveraging the low regulation environment is key to maximizing your short term rental income potential. Let's dive into the specifics.
Key Indian Pass Airbnb Performance Metrics Overview
Monthly Airbnb Revenue Variations & Income Potential in Indian Pass (2026)
Understanding the monthly revenue variations for Airbnb listings in Indian Pass is key to maximizing your short term rental income potential. Seasonality significantly impacts earnings. Our analysis, based on data from the past 12 months, shows that the peak revenue month for STRs in Indian Pass is typically July, while November often presents the lowest earnings, highlighting opportunities for strategic pricing adjustments during shoulder and low seasons. Explore the typical Airbnb income in Indian Pass across different performance tiers:
- Best-in-class properties (Top 10%) achieve $12,388+ monthly, often utilizing dynamic pricing and superior guest experiences.
- Strong performing properties (Top 25%) earn $8,197 or more, indicating effective management and desirable locations/amenities.
- Typical properties (Median) generate around $4,931 per month, representing the average market performance.
- Entry-level properties (Bottom 25%) see earnings around $2,931, often with potential for optimization.
Average Monthly Airbnb Earnings Trend in Indian Pass
Indian Pass Airbnb Occupancy Rate Trends (2026)
Maximize your bookings by understanding the Indian Pass STR occupancy trends. Seasonal demand shifts significantly influence how often properties are booked. Typically, Julysees the highest demand (peak season occupancy), while November experiences the lowest (low season). Effective strategies, like adjusting minimum stays or offering promotions, can boost occupancy during slower periods. Here's how different property tiers perform in Indian Pass:
- Best-in-class properties (Top 10%) achieve 71%+ occupancy, indicating high desirability and potentially optimized availability.
- Strong performing properties (Top 25%) maintain 55% or higher occupancy, suggesting good market fit and guest satisfaction.
- Typical properties (Median) have an occupancy rate around 37%.
- Entry-level properties (Bottom 25%) average 21% occupancy, potentially facing higher vacancy.
Average Monthly Occupancy Rate Trend in Indian Pass
Average Daily Rate (ADR) Airbnb Trends in Indian Pass (2026)
Effective short term rental pricing strategy in Indian Pass involves understanding monthly ADR fluctuations. The Average Daily Rate (ADR) for Airbnb in Indian Pass typically peaks in June and dips lowest during February. Leveraging Airbnb dynamic pricing tools or strategies based on this seasonality can significantly boost revenue. Here's a look at the typical nightly rates achieved:
- Best-in-class properties (Top 10%) command rates of $699+ per night, often due to premium features or locations.
- Strong performing properties (Top 25%) achieve nightly rates of $536 or more.
- Typical properties (Median) charge around $423 per night.
- Entry-level properties (Bottom 25%) earn around $342 per night.
Average Daily Rate (ADR) Trend by Month in Indian Pass
Get Live Indian Pass Market Intelligence 👇

Explore Real-time Analytics
Airbnb Seasonality Analysis & Trends in Indian Pass (2026)
Peak Season (July, June, March)
- Revenue averages $9,085 per month
- Occupancy rates average 57.1%
- Daily rates average $503
Shoulder Season
- Revenue averages $5,758 per month
- Occupancy maintains around 37.5%
- Daily rates hold near $440
Low Season (January, October, November)
- Revenue drops to average $4,012 per month
- Occupancy decreases to average 27.7%
- Daily rates adjust to average $432
Seasonality Insights for Indian Pass
- The Airbnb seasonality in Indian Pass shows highly seasonal trends requiring careful strategy. While the sections above show seasonal averages, it's also insightful to look at the extremes:
- During the high season, the absolute peak month showcases Indian Pass's highest earning potential, with monthly revenues capable of climbing to $10,009, occupancy reaching a high of 61.8%, and ADRs peaking at $539.
- Conversely, the slowest single month of the year, typically falling within the low season, marks the market's lowest point. In this month, revenue might dip to $3,716, occupancy could drop to 26.3%, and ADRs may adjust down to $406.
- Understanding both the seasonal averages and these monthly peaks and troughs in revenue, occupancy, and ADR is crucial for maximizing your Airbnb profit potential in Indian Pass.
Seasonal Strategies for Maximizing Profit
- Peak Season: Maximize revenue through premium pricing and potentially longer minimum stays. Ensure high availability.
- Low Season: Offer competitive pricing, special promotions (e.g., extended stay discounts), and flexible cancellation policies. Target off-season travelers like remote workers or budget-conscious guests.
- Shoulder Seasons: Implement dynamic pricing that balances peak and low rates. Target weekend travelers or specific events. Offer slightly more flexible terms than peak season.
- Regularly analyze your own performance against these Indian Pass seasonality benchmarks and adjust your pricing and availability strategy accordingly.
Best Areas for Airbnb Investment in Indian Pass (2026)
Exploring the top neighborhoods for short-term rentals in Indian Pass? This section highlights key areas, outlining why they are attractive for hosts and guests, along with notable local attractions. Consider these locations based on your target guest profile and investment strategy.
| Neighborhood / Area | Why Host Here? (Target Guests & Appeal) | Key Attractions & Landmarks |
|---|---|---|
| Indian Pass Beach | A serene beach community known for its natural beauty and laid-back atmosphere. This location offers direct beach access and is perfect for vacationers seeking peace and quiet away from crowded tourist spots. | Indian Pass Beach, St. Vincent National Wildlife Refuge, Cape San Blas, Scalloping in the Gulf, Gulf Coast sunsets, Local seafood restaurants |
| Cape San Blas | An upscale vacation destination celebrated for its pristine beaches and outdoor activities. Ideal for families and nature lovers, the area offers a mix of relaxation and adventure opportunities like paddleboarding and hiking. | St. Joseph Peninsula State Park, Cape San Blas Lighthouse, Gulf of Mexico beaches, Fishing and boating, Wildlife viewing, Kayaking in clean waters |
| Port St. Joe | A charming town with a vibrant waterfront and rich history. Offers a mix of local culture, access to beautiful beaches, and a variety of shopping and dining experiences attractive to visitors. | Port St. Joe Marina, Eagle Harbor, Port St. Joe Historical Society Museum, Local shops and eateries, Fishing and boating from the marina, Scenic nature walks |
| Mexico Beach | Known for its tranquil atmosphere and family-friendly environment, Mexico Beach is perfect for those seeking an escape. The area features beautiful beaches and recreational opportunities, making it attractive for families. | Mexico Beach Pier, The pristine beaches, Local shops and dining, Fishing opportunities, Beachcombing and shelling, Amazing sunrises and sunsets |
| Carrabelle | A small town known for its picturesque coastal views and relaxed vibe. Ideal for visitors looking to explore local culture and enjoy fishing, boating, and outdoor activities. | Carrabelle River, Carrabelle Beach, Camp Gordon Johnston Museum, Local fishing charters, Scenic coastal drives, Recreational parks |
| Alligator Point | A hidden gem known for its natural beauty and untouched beaches. Perfect for those seeking a quiet getaway with opportunities for outdoor activities and wildlife watching. | Alligator Point Beach, Local wildlife, Fishing spots, Kayaking and paddleboarding, Scenic nature trails, Uncrowded beaches |
| Apalachicola | A historic town famous for its oysters and rich maritime history. Offers a unique cultural experience along with opportunities for boating and exploring local art galleries. | Apalachicola River, Downtown Historic District, Apalachicola Bay, Local seafood dining, Art galleries and shops, Outdoor festivals |
| Sopchoppy | Known for its scenic beauty and proximity to natural attractions, this small town is ideal for outdoor enthusiasts looking for hiking, fishing, and local charm. | Sopchoppy River, Local parks, Cedar Key beaches nearby, Hiking in nearby forests, Small-town charm and community events, Wildlife viewing |
Understanding Airbnb License Requirements & STR Laws in Indian Pass (2026)
While Indian Pass, Florida, United States currently shows low STR regulations, specific Airbnb license requirements might still exist or change. Always verify the latest short term rental regulations and Airbnb license requirements directly with local government authorities for Indian Pass to ensure full compliance before hosting.
(Source: AirROI data, 2026, finding no licensed listings among those analyzed)
Top Performing Airbnb Properties in Indian Pass (2026)
Benchmark your potential! Explore examples of top-performing Airbnb properties in Indian Passbased on Trailing Twelve Month (TTM) revenue. Analyze their characteristics, revenue, occupancy rate, and ADR to understand what drives success in this market.
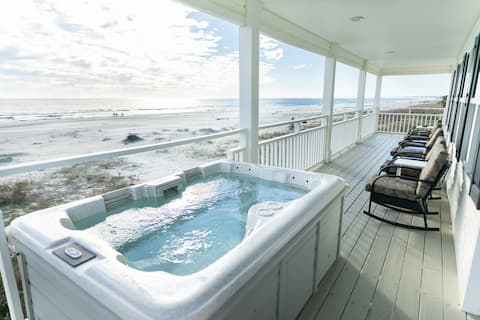
Beachfront, Hot Tub, Quiet Beach ~ Coastawhile
Entire Place • 3 bedrooms
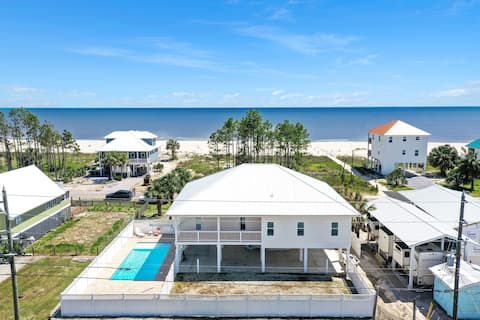
Private Pool, Easy Beach Access ~ Treasure Road
Entire Place • 4 bedrooms
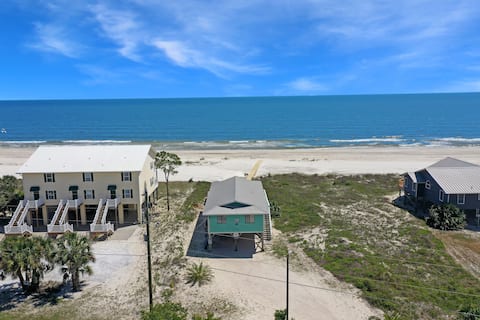
Beachfront, Single Level, 2BR ~ Pelican Bend
Entire Place • 2 bedrooms
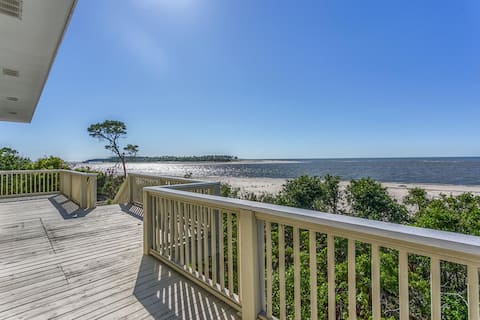
Beachfront, Quiet, Natural, Elevator ~ Island Idyl
Entire Place • 4 bedrooms
Hatchling Hideaway~ Get the whole group together!
Entire Place • 5 bedrooms

Scallop Pass - Gulf Front! Captivating views!
Entire Place • 6 bedrooms
Note: Performance varies based on location, size, amenities, seasonality, and management quality. Data reflects the past 12 months.
Top Performing Airbnb Hosts in Indian Pass (2026)
Learn from the best! This table showcases top-performing Airbnb hosts in Indian Pass based on the number of properties managed and estimated total revenue over the past year. Analyze their scale and performance metrics.
| Host Name | Properties | Grossing Revenue | Stay Reviews | Avg Rating |
|---|---|---|---|---|
| Pristine Properties Vacation R | 32 | $1,437,931 | 402 | 4.46/5.0 |
| Natural Retreats (E) | 3 | $192,654 | 47 | 4.58/5.0 |
Analyzing the strategies of top hosts, such as their property selection, pricing, and guest communication, can offer valuable lessons for optimizing your own Airbnb operations in Indian Pass.
Dive Deeper: Advanced Indian Pass STR Market Data (2026)
Ready to unlock more insights? AirROI provides access to advanced metrics and comprehensive Airbnb data for Indian Pass. Explore detailed analytics beyond this report to refine your investment strategy, optimize pricing, and maximize your vacation rental profits.
Explore Advanced MetricsIndian Pass Short-Term Rental Market Composition (2026): Property & Room Types
Room Type Distribution
Property Type Distribution
Market Composition Insights for Indian Pass
- The Indian Pass Airbnb market composition is heavily skewed towards Entire Home/Apt listings, which make up 100% of the 35 active rentals. This indicates strong guest preference for privacy and space.
- Looking at the property type distribution in Indian Pass, House properties are the most common (100%), reflecting the local real estate landscape.
- Houses represent a significant 100% portion, catering likely to families or larger groups.
Indian Pass Airbnb Room Capacity Analysis (2026): Bedroom Distribution
Distribution of Listings by Number of Bedrooms
Room Capacity Insights for Indian Pass
- The dominant room capacity in Indian Pass is 3 bedrooms listings, making up 48.6% of the market. This suggests a strong demand for properties suitable for families or small groups.
- Together, 3 bedrooms and 4 bedrooms properties represent 71.5% of the active Airbnb listings in Indian Pass, indicating a high concentration in these sizes.
- A significant 85.8% of listings offer 3+ bedrooms, catering to larger groups and families seeking more space in Indian Pass.
Indian Pass Vacation Rental Guest Capacity Trends (2026)
Distribution of Listings by Guest Capacity
Guest Capacity Insights for Indian Pass
- The most common guest capacity trend in Indian Pass vacation rentals is listings accommodating 8+ guests (68.6%). This suggests the primary traveler segment is likely larger groups.
- Properties designed for 8+ guests and 6 guests dominate the Indian Pass STR market, accounting for 88.6% of listings.
- 97.2% of properties accommodate 6+ guests, serving the market segment for larger families or group travel in Indian Pass.
- On average, properties in Indian Pass are equipped to host 7.4 guests.
Indian Pass Airbnb Booking Patterns (2026): Available vs. Booked Days
Available Days Distribution
Booked Days Distribution
Booking Pattern Insights for Indian Pass
- The most common availability pattern in Indian Pass falls within the 271-366 days range, representing 48.6% of listings. This suggests many properties have significant open periods on their calendars.
- Approximately 91.5% of listings show high availability (181+ days open annually), indicating potential for increased bookings or specific owner usage patterns.
- For booked days, the 91-180 days range is most frequent in Indian Pass (45.7%), reflecting common guest stay durations or potential owner blocking patterns.
- A notable 8.6% of properties secure long booking periods (181+ days booked per year), highlighting successful long-term rental strategies or significant owner usage.
Indian Pass Airbnb Minimum Stay Requirements Analysis
Distribution of Listings by Minimum Night Requirement
3 Nights
5 listings
14.3% of total
4-6 Nights
1 listings
2.9% of total
7-29 Nights
2 listings
5.7% of total
30+ Nights
27 listings
77.1% of total
Key Insights
- The most prevalent minimum stay requirement in Indian Pass is 30+ Nights, adopted by 77.1% of listings. This highlights the market's preference for longer commitments.
- A significant segment (77.1%) caters to monthly stays (30+ nights) in Indian Pass, pointing to opportunities in the extended-stay market.
Recommendations
- Align with the market by considering a 30+ Nights minimum stay, as 77.1% of Indian Pass hosts use this setting.
- Explore offering discounts for stays of 30+ nights to attract the 77.1% of the market seeking extended stays.
- Adjust minimum nights based on seasonality – potentially shorter during low season and longer during peak demand periods in Indian Pass.
Indian Pass Airbnb Cancellation Policy Trends Analysis (2026)
Super Strict 60 Days
3 listings
8.6% of total
Super Strict 30 Days
23 listings
65.7% of total
Firm
9 listings
25.7% of total
Cancellation Policy Insights for Indian Pass
- The prevailing Airbnb cancellation policy trend in Indian Pass is Super Strict 30 Days, used by 65.7% of listings.
- There's a relatively balanced mix between guest-friendly (0.0%) and stricter (25.7%) policies, offering choices for different guest needs.
Recommendations for Hosts
- Consider adopting a Super Strict 30 Days policy to align with the 65.7% market standard in Indian Pass.
- Regularly review your cancellation policy against competitors and market demand shifts in Indian Pass.
Indian Pass STR Booking Lead Time Analysis (2026)
Average Booking Lead Time by Month
Booking Lead Time Insights for Indian Pass
- The overall average booking lead time for vacation rentals in Indian Pass is 92 days.
- Guests book furthest in advance for stays during December (average 165 days), likely coinciding with peak travel demand or local events.
- The shortest booking windows occur for stays in June (average 54 days), indicating more last-minute travel plans during this time.
- Seasonally, Winter (158 days avg.) sees the longest lead times, while Summer (57 days avg.) has the shortest, reflecting typical travel planning cycles.
Recommendations for Hosts
- Use the overall average lead time (92 days) as a baseline for your pricing and availability strategy in Indian Pass.
- For December stays, consider implementing length-of-stay discounts or slightly higher rates for bookings made less than 165 days out to capitalize on advance planning.
- Target marketing efforts for the Winter season well in advance (at least 158 days) to capture early planners.
- Monitor your own booking lead times against these Indian Pass averages to identify opportunities for dynamic pricing adjustments.
Popular & Essential Airbnb Amenities in Indian Pass (2026)
Amenity Prevalence
No amenities with partial availability (less than 100%) were found to display in the chart. All essential amenities might be present in all listings. Check insights below.
Amenity Insights for Indian Pass
- Essential amenities in Indian Pass that guests expect include: Refrigerator, TV, Heating, Bed linens, Wifi, Washer, Kitchen, Oven, Smoke alarm, Microwave. Lacking these (any) could significantly impact bookings.
Recommendations for Hosts
- Ensure your listing includes all essential amenities for Indian Pass: Refrigerator, TV, Heating, Bed linens, Wifi, Washer, Kitchen, Oven, Smoke alarm, Microwave.
- Highlight unique or less common amenities you offer (e.g., hot tub, dedicated workspace, EV charger) in your listing description and photos.
- Regularly check competitor amenities in Indian Pass to stay competitive.
Indian Pass Airbnb Guest Demographics & Profile Analysis (2026)
Guest Profile Summary for Indian Pass
- The typical guest profile for Airbnb in Indian Pass consists of primarily domestic travelers (100%), often arriving from nearby Canton, typically belonging to the Post-2000s (Gen Z/Alpha) group (50%), primarily speaking English or Spanish.
- Domestic travelers account for 100.0% of guests.
- Top languages spoken are English (91.7%) followed by Spanish (8.3%).
- A significant demographic segment is the Post-2000s (Gen Z/Alpha) group, representing 50% of guests.
Recommendations for Hosts
- Target domestic marketing efforts towards travelers from Canton and Atlanta.
- Tailor amenities and listing descriptions to appeal to the dominant Post-2000s (Gen Z/Alpha) demographic (e.g., highlight fast WiFi, smart home features, local guides).
- Highlight unique local experiences or amenities relevant to the primary guest profile.
- Consider seasonal promotions aligned with peak travel times for key origin markets.
Nearby Short-Term Rental Market Comparison
How does the Indian Pass Airbnb market stack up against its neighbors? Compare key performance metrics like average monthly revenue, ADR, and occupancy rates in surrounding areas to understand the broader regional STR landscape.
| Market | Active Properties | Monthly Revenue | Daily Rate | Avg. Occupancy |
|---|---|---|---|---|
| Alys Beach | 441 | $6,989 | $682.56 | 43% |
| Seaside | 669 | $6,696 | $783.03 | 38% |
| Seacrest Beach | 350 | $6,613 | $593.69 | 44% |
| Rosemary Beach | 533 | $6,251 | $659.86 | 42% |
| Santa Rosa Beach | 3,191 | $5,047 | $539.15 | 41% |
| Seacrest | 28 | $4,993 | $635.35 | 39% |
| Inlet Beach | 98 | $4,870 | $534.43 | 41% |
| Saint George Island | 153 | $4,832 | $490.02 | 43% |
| Walton County | 134 | $4,764 | $592.07 | 38% |
| Watersound | 126 | $4,640 | $495.06 | 40% |