Homosassa Airbnb Market Analysis 2026: Short Term Rental Data & Vacation Rental Statistics in Florida, United States
Is Airbnb profitable in Homosassa in 2026? Explore comprehensive Airbnb analytics for Homosassa, Florida, United States to uncover income potential. This 2026 STR market report for Homosassa, based on AirROI data from February 2025 to January 2026, reveals key trends in the niche market of 129 active listings.
Whether you're considering an Airbnb investment in Homosassa, optimizing your existing vacation rental, or exploring rental arbitrage opportunities, understanding the Homosassa Airbnb data is crucial. Leveraging the low regulation environment is key to maximizing your short term rental income potential. Let's dive into the specifics.
Key Homosassa Airbnb Performance Metrics Overview
Monthly Airbnb Revenue Variations & Income Potential in Homosassa (2026)
Understanding the monthly revenue variations for Airbnb listings in Homosassa is key to maximizing your short term rental income potential. Seasonality significantly impacts earnings. Our analysis, based on data from the past 12 months, shows that the peak revenue month for STRs in Homosassa is typically March, while October often presents the lowest earnings, highlighting opportunities for strategic pricing adjustments during shoulder and low seasons. Explore the typical Airbnb income in Homosassa across different performance tiers:
- Best-in-class properties (Top 10%) achieve $5,696+ monthly, often utilizing dynamic pricing and superior guest experiences.
- Strong performing properties (Top 25%) earn $3,680 or more, indicating effective management and desirable locations/amenities.
- Typical properties (Median) generate around $2,093 per month, representing the average market performance.
- Entry-level properties (Bottom 25%) see earnings around $1,130, often with potential for optimization.
Average Monthly Airbnb Earnings Trend in Homosassa
Homosassa Airbnb Occupancy Rate Trends (2026)
Maximize your bookings by understanding the Homosassa STR occupancy trends. Seasonal demand shifts significantly influence how often properties are booked. Typically, Marchsees the highest demand (peak season occupancy), while September experiences the lowest (low season). Effective strategies, like adjusting minimum stays or offering promotions, can boost occupancy during slower periods. Here's how different property tiers perform in Homosassa:
- Best-in-class properties (Top 10%) achieve 68%+ occupancy, indicating high desirability and potentially optimized availability.
- Strong performing properties (Top 25%) maintain 51% or higher occupancy, suggesting good market fit and guest satisfaction.
- Typical properties (Median) have an occupancy rate around 33%.
- Entry-level properties (Bottom 25%) average 19% occupancy, potentially facing higher vacancy.
Average Monthly Occupancy Rate Trend in Homosassa
Average Daily Rate (ADR) Airbnb Trends in Homosassa (2026)
Effective short term rental pricing strategy in Homosassa involves understanding monthly ADR fluctuations. The Average Daily Rate (ADR) for Airbnb in Homosassa typically peaks in July and dips lowest during April. Leveraging Airbnb dynamic pricing tools or strategies based on this seasonality can significantly boost revenue. Here's a look at the typical nightly rates achieved:
- Best-in-class properties (Top 10%) command rates of $390+ per night, often due to premium features or locations.
- Strong performing properties (Top 25%) achieve nightly rates of $282 or more.
- Typical properties (Median) charge around $195 per night.
- Entry-level properties (Bottom 25%) earn around $139 per night.
Average Daily Rate (ADR) Trend by Month in Homosassa
Get Live Homosassa Market Intelligence 👇

Explore Real-time Analytics
Airbnb Seasonality Analysis & Trends in Homosassa (2026)
Peak Season (March, July, February)
- Revenue averages $4,000 per month
- Occupancy rates average 53.7%
- Daily rates average $233
Shoulder Season
- Revenue averages $2,518 per month
- Occupancy maintains around 32.7%
- Daily rates hold near $232
Low Season (September, October, November)
- Revenue drops to average $1,941 per month
- Occupancy decreases to average 25.3%
- Daily rates adjust to average $239
Seasonality Insights for Homosassa
- The Airbnb seasonality in Homosassa shows highly seasonal trends requiring careful strategy. While the sections above show seasonal averages, it's also insightful to look at the extremes:
- During the high season, the absolute peak month showcases Homosassa's highest earning potential, with monthly revenues capable of climbing to $4,237, occupancy reaching a high of 59.5%, and ADRs peaking at $243.
- Conversely, the slowest single month of the year, typically falling within the low season, marks the market's lowest point. In this month, revenue might dip to $1,786, occupancy could drop to 23.5%, and ADRs may adjust down to $217.
- Understanding both the seasonal averages and these monthly peaks and troughs in revenue, occupancy, and ADR is crucial for maximizing your Airbnb profit potential in Homosassa.
Seasonal Strategies for Maximizing Profit
- Peak Season: Maximize revenue through premium pricing and potentially longer minimum stays. Ensure high availability.
- Low Season: Offer competitive pricing, special promotions (e.g., extended stay discounts), and flexible cancellation policies. Target off-season travelers like remote workers or budget-conscious guests.
- Shoulder Seasons: Implement dynamic pricing that balances peak and low rates. Target weekend travelers or specific events. Offer slightly more flexible terms than peak season.
- Regularly analyze your own performance against these Homosassa seasonality benchmarks and adjust your pricing and availability strategy accordingly.
Best Areas for Airbnb Investment in Homosassa (2026)
Exploring the top neighborhoods for short-term rentals in Homosassa? This section highlights key areas, outlining why they are attractive for hosts and guests, along with notable local attractions. Consider these locations based on your target guest profile and investment strategy.
| Neighborhood / Area | Why Host Here? (Target Guests & Appeal) | Key Attractions & Landmarks |
|---|---|---|
| Homosassa Springs | A unique natural spring area known for its diverse wildlife and beautiful scenery, making it popular among nature lovers and tourists seeking adventure. | Homosassa Springs Wildlife State Park, Crystal River National Wildlife Refuge, Homosassa River, Manatee Observation and Education Center, Nugget Pond, Homosassa River Kayak Tours |
| Sunshine Park | A peaceful neighborhood with easy access to local amenities and the Homosassa River, attracting families and short term visitors looking for a quiet getaway. | Sunshine Park, Homosassa River, local restaurants, shopping areas, parks |
| Old Homosassa | A historic district with charming cottages and proximity to the river, appealing to visitors interested in local culture and history. | Old Homosassa Heritage Park, local art galleries, fish camps, Homosassa Fishing Guides |
| Beverly Hills | A suburban area close to Homosassa with good access to local attractions, popular with families and long-term visitors. | Beverly Hills Lakeside Park, Citrus County Historical Society, local dining options, golf courses |
| Crystal River | A nearby town known for its crystal clear waters and manatee tours, attracting those interested in marine life and outdoor activities. | Three Sisters Springs, Crystal River State Park, manatee tours, snorkeling and kayaking, local seafood restaurants |
| Chassahowitzka | A scenic area with natural springs and wildlife, ideal for those looking for a secluded, nature-focused experience. | Chassahowitzka National Wildlife Refuge, Chassahowitzka River, nature trails, bird watching |
| Citrus Springs | A growing community with easy access to outdoor activities, appealing to visitors searching for more space and tranquility. | Citrus Springs Golf & Country Club, local parks and trails, nearby rivers and lakes |
| Inverness | A larger town with a historic downtown area and access to local lakes, making it a suitable base for tourists exploring the region. | Inverness Historic District, Lake Henderson, Tennis Courts, local shops and restaurants |
Understanding Airbnb License Requirements & STR Laws in Homosassa (2026)
While Homosassa, Florida, United States currently shows low STR regulations, specific Airbnb license requirements might still exist or change. Always verify the latest short term rental regulations and Airbnb license requirements directly with local government authorities for Homosassa to ensure full compliance before hosting.
(Source: AirROI data, 2026, finding no licensed listings among those analyzed)
Top Performing Airbnb Properties in Homosassa (2026)
Benchmark your potential! Explore examples of top-performing Airbnb properties in Homosassabased on Trailing Twelve Month (TTM) revenue. Analyze their characteristics, revenue, occupancy rate, and ADR to understand what drives success in this market.

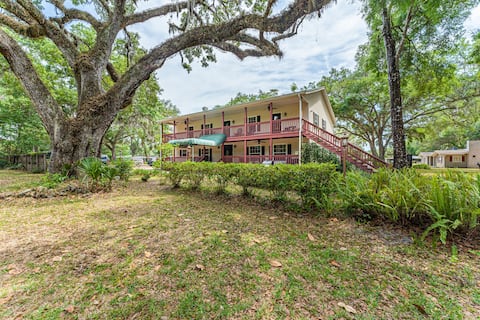
Hampton House Homosassa 5BR Waterfront Estate
Entire Place • 5 bedrooms

Old Homosassa Water Front, Ice Machine & Kayaks
Entire Place • 4 bedrooms
Entire Boutique Hotel...walking distance to river
Private Room • 9 bedrooms
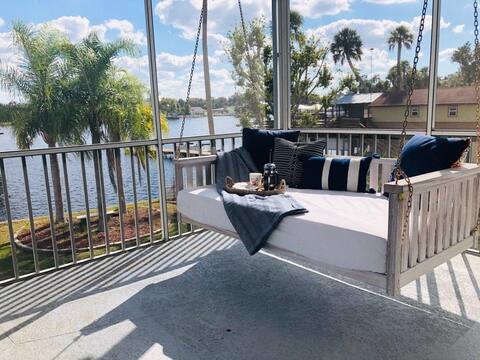
Safe, Clean: Luxury Waterfront - Homosassa
Entire Place • 4 bedrooms

Chaz River Cottage
Entire Place • 3 bedrooms

Waterside Retreat~River Access
Entire Place • 4 bedrooms
Note: Performance varies based on location, size, amenities, seasonality, and management quality. Data reflects the past 12 months.
Top Performing Airbnb Hosts in Homosassa (2026)
Learn from the best! This table showcases top-performing Airbnb hosts in Homosassa based on the number of properties managed and estimated total revenue over the past year. Analyze their scale and performance metrics.
| Host Name | Properties | Grossing Revenue | Stay Reviews | Avg Rating |
|---|---|---|---|---|
| Sean | 11 | $220,744 | 253 | 4.61/5.0 |
| TradeWinds Homosassa | 7 | $126,831 | 49 | 4.92/5.0 |
| Marni | 2 | $124,889 | 319 | 4.92/5.0 |
| Evolve | 9 | $119,472 | 179 | 4.48/5.0 |
| Juliet | 1 | $102,809 | 58 | 5.00/5.0 |
| Susan | 3 | $96,183 | 356 | 4.96/5.0 |
| Mason Creek | 3 | $90,595 | 294 | 4.86/5.0 |
| Eric | 1 | $88,461 | 63 | 4.92/5.0 |
| Allen Martin | 1 | $66,361 | 70 | 5.00/5.0 |
| William Terry | 2 | $65,381 | 141 | 4.99/5.0 |
Analyzing the strategies of top hosts, such as their property selection, pricing, and guest communication, can offer valuable lessons for optimizing your own Airbnb operations in Homosassa.
Dive Deeper: Advanced Homosassa STR Market Data (2026)
Ready to unlock more insights? AirROI provides access to advanced metrics and comprehensive Airbnb data for Homosassa. Explore detailed analytics beyond this report to refine your investment strategy, optimize pricing, and maximize your vacation rental profits.
Explore Advanced MetricsHomosassa Short-Term Rental Market Composition (2026): Property & Room Types
Room Type Distribution
Property Type Distribution
Market Composition Insights for Homosassa
- The Homosassa Airbnb market composition is heavily skewed towards Entire Home/Apt listings, which make up 96.9% of the 129 active rentals. This indicates strong guest preference for privacy and space.
- Looking at the property type distribution in Homosassa, House properties are the most common (82.2%), reflecting the local real estate landscape.
- Houses represent a significant 82.2% portion, catering likely to families or larger groups.
- Smaller segments like apartment/condo, others, hotel/boutique, unique stays (combined 7.0%) offer potential for unique stay experiences.
Homosassa Airbnb Room Capacity Analysis (2026): Bedroom Distribution
Distribution of Listings by Number of Bedrooms
Room Capacity Insights for Homosassa
- The dominant room capacity in Homosassa is 2 bedrooms listings, making up 35.7% of the market. This suggests a strong demand for properties suitable for couples or solo travelers.
- Together, 2 bedrooms and 3 bedrooms properties represent 65.9% of the active Airbnb listings in Homosassa, indicating a high concentration in these sizes.
- A significant 44.2% of listings offer 3+ bedrooms, catering to larger groups and families seeking more space in Homosassa.
Homosassa Vacation Rental Guest Capacity Trends (2026)
Distribution of Listings by Guest Capacity
Guest Capacity Insights for Homosassa
- The most common guest capacity trend in Homosassa vacation rentals is listings accommodating 6 guests (30.2%). This suggests the primary traveler segment is likely larger groups.
- Properties designed for 6 guests and 8+ guests dominate the Homosassa STR market, accounting for 55.0% of listings.
- 62.0% of properties accommodate 6+ guests, serving the market segment for larger families or group travel in Homosassa.
- On average, properties in Homosassa are equipped to host 5.7 guests.
Homosassa Airbnb Booking Patterns (2026): Available vs. Booked Days
Available Days Distribution
Booked Days Distribution
Booking Pattern Insights for Homosassa
- The most common availability pattern in Homosassa falls within the 271-366 days range, representing 59.7% of listings. This suggests many properties have significant open periods on their calendars.
- Approximately 89.9% of listings show high availability (181+ days open annually), indicating potential for increased bookings or specific owner usage patterns.
- For booked days, the 31-90 days range is most frequent in Homosassa (45%), reflecting common guest stay durations or potential owner blocking patterns.
- A notable 10.1% of properties secure long booking periods (181+ days booked per year), highlighting successful long-term rental strategies or significant owner usage.
Homosassa Airbnb Minimum Stay Requirements Analysis
Distribution of Listings by Minimum Night Requirement
1 Night
12 listings
9.3% of total
2 Nights
43 listings
33.3% of total
3 Nights
26 listings
20.2% of total
4-6 Nights
3 listings
2.3% of total
7-29 Nights
4 listings
3.1% of total
30+ Nights
41 listings
31.8% of total
Key Insights
- The most prevalent minimum stay requirement in Homosassa is 2 Nights, adopted by 33.3% of listings. This highlights the market's preference for shorter, flexible bookings.
- A significant segment (31.8%) caters to monthly stays (30+ nights) in Homosassa, pointing to opportunities in the extended-stay market.
Recommendations
- Align with the market by considering a 2 Nights minimum stay, as 33.3% of Homosassa hosts use this setting.
- If feasible, allowing 1-night stays, especially midweek or during low season, could capture last-minute bookings, as only 9.3% currently do.
- A 2-night minimum appears standard (33.3%). Consider this for weekends or peak periods.
- Explore offering discounts for stays of 30+ nights to attract the 31.8% of the market seeking extended stays.
- Adjust minimum nights based on seasonality – potentially shorter during low season and longer during peak demand periods in Homosassa.
Homosassa Airbnb Cancellation Policy Trends Analysis (2026)
Limited
3 listings
2.3% of total
Flexible
15 listings
11.7% of total
Moderate
34 listings
26.6% of total
Firm
45 listings
35.2% of total
Strict
31 listings
24.2% of total
Cancellation Policy Insights for Homosassa
- The prevailing Airbnb cancellation policy trend in Homosassa is Firm, used by 35.2% of listings.
- A majority (59.4%) of hosts in Homosassa utilize Firm or Strict policies, indicating a market where hosts prioritize booking security.
Recommendations for Hosts
- Consider adopting a Firm policy to align with the 35.2% market standard in Homosassa.
- Regularly review your cancellation policy against competitors and market demand shifts in Homosassa.
Homosassa STR Booking Lead Time Analysis (2026)
Average Booking Lead Time by Month
Booking Lead Time Insights for Homosassa
- The overall average booking lead time for vacation rentals in Homosassa is 54 days.
- Guests book furthest in advance for stays during July (average 73 days), likely coinciding with peak travel demand or local events.
- The shortest booking windows occur for stays in September (average 35 days), indicating more last-minute travel plans during this time.
- Seasonally, Winter (63 days avg.) sees the longest lead times, while Fall (49 days avg.) has the shortest, reflecting typical travel planning cycles.
Recommendations for Hosts
- Use the overall average lead time (54 days) as a baseline for your pricing and availability strategy in Homosassa.
- For July stays, consider implementing length-of-stay discounts or slightly higher rates for bookings made less than 73 days out to capitalize on advance planning.
- Target marketing efforts for the Winter season well in advance (at least 63 days) to capture early planners.
- Monitor your own booking lead times against these Homosassa averages to identify opportunities for dynamic pricing adjustments.
Popular & Essential Airbnb Amenities in Homosassa (2026)
Amenity Prevalence
Amenity Insights for Homosassa
- Essential amenities in Homosassa that guests expect include: Air conditioning, Wifi, TV, Free parking on premises. Lacking these (any) could significantly impact bookings.
- Popular amenities like Smoke alarm, Kitchen, Hot water are common but not universal. Offering these can provide a competitive edge.
Recommendations for Hosts
- Ensure your listing includes all essential amenities for Homosassa: Air conditioning, Wifi, TV, Free parking on premises.
- Prioritize adding missing essentials: Wifi, TV, Free parking on premises.
- Consider adding popular differentiators like Smoke alarm or Kitchen to increase appeal.
- Highlight unique or less common amenities you offer (e.g., hot tub, dedicated workspace, EV charger) in your listing description and photos.
- Regularly check competitor amenities in Homosassa to stay competitive.
Homosassa Airbnb Guest Demographics & Profile Analysis (2026)
Guest Profile Summary for Homosassa
- The typical guest profile for Airbnb in Homosassa consists of primarily domestic travelers (98%), often arriving from nearby Tampa, typically belonging to the Post-2000s (Gen Z/Alpha) group (50%), primarily speaking English or Spanish.
- Domestic travelers account for 97.9% of guests.
- Key international markets include United States (97.9%) and Canada (0.5%).
- Top languages spoken are English (81.1%) followed by Spanish (8%).
- A significant demographic segment is the Post-2000s (Gen Z/Alpha) group, representing 50% of guests.
Recommendations for Hosts
- Target domestic marketing efforts towards travelers from Tampa and Sarasota.
- Tailor amenities and listing descriptions to appeal to the dominant Post-2000s (Gen Z/Alpha) demographic (e.g., highlight fast WiFi, smart home features, local guides).
- Highlight unique local experiences or amenities relevant to the primary guest profile.
- Consider seasonal promotions aligned with peak travel times for key origin markets.
Nearby Short-Term Rental Market Comparison
How does the Homosassa Airbnb market stack up against its neighbors? Compare key performance metrics like average monthly revenue, ADR, and occupancy rates in surrounding areas to understand the broader regional STR landscape.
| Market | Active Properties | Monthly Revenue | Daily Rate | Avg. Occupancy |
|---|---|---|---|---|
| Anna Maria island | 587 | $7,996 | $823.96 | 41% |
| Anna Maria | 56 | $6,434 | $692.96 | 52% |
| Reunion | 12 | $6,321 | $580.45 | 44% |
| Vilano Beach | 173 | $5,571 | $442.95 | 45% |
| Indian Rocks Beach | 842 | $5,560 | $419.63 | 49% |
| Siesta Key | 1,175 | $5,206 | $518.91 | 42% |
| Belleair Beach | 94 | $5,086 | $339.65 | 53% |
| Bradenton Beach | 122 | $4,977 | $507.12 | 42% |
| Thonotosassa | 17 | $4,309 | $347.75 | 50% |
| Seminole | 519 | $4,223 | $316.69 | 52% |