Holmes Beach Airbnb Market Analysis 2026: Short Term Rental Data & Vacation Rental Statistics in Florida, United States
Is Airbnb profitable in Holmes Beach in 2026? Explore comprehensive Airbnb analytics for Holmes Beach, Florida, United States to uncover income potential. This 2026 STR market report for Holmes Beach, based on AirROI data from February 2025 to January 2026, reveals key trends in the market of 881 active listings.
Whether you're considering an Airbnb investment in Holmes Beach, optimizing your existing vacation rental, or exploring rental arbitrage opportunities, understanding the Holmes Beach Airbnb data is crucial. Leveraging the low regulation environment is key to maximizing your short term rental income potential. Let's dive into the specifics.
Key Holmes Beach Airbnb Performance Metrics Overview
Monthly Airbnb Revenue Variations & Income Potential in Holmes Beach (2026)
Understanding the monthly revenue variations for Airbnb listings in Holmes Beach is key to maximizing your short term rental income potential. Seasonality significantly impacts earnings. Our analysis, based on data from the past 12 months, shows that the peak revenue month for STRs in Holmes Beach is typically March, while September often presents the lowest earnings, highlighting opportunities for strategic pricing adjustments during shoulder and low seasons. Explore the typical Airbnb income in Holmes Beach across different performance tiers:
- Best-in-class properties (Top 10%) achieve $12,288+ monthly, often utilizing dynamic pricing and superior guest experiences.
- Strong performing properties (Top 25%) earn $8,089 or more, indicating effective management and desirable locations/amenities.
- Typical properties (Median) generate around $4,748 per month, representing the average market performance.
- Entry-level properties (Bottom 25%) see earnings around $2,526, often with potential for optimization.
Average Monthly Airbnb Earnings Trend in Holmes Beach
Holmes Beach Airbnb Occupancy Rate Trends (2026)
Maximize your bookings by understanding the Holmes Beach STR occupancy trends. Seasonal demand shifts significantly influence how often properties are booked. Typically, Marchsees the highest demand (peak season occupancy), while December experiences the lowest (low season). Effective strategies, like adjusting minimum stays or offering promotions, can boost occupancy during slower periods. Here's how different property tiers perform in Holmes Beach:
- Best-in-class properties (Top 10%) achieve 75%+ occupancy, indicating high desirability and potentially optimized availability.
- Strong performing properties (Top 25%) maintain 61% or higher occupancy, suggesting good market fit and guest satisfaction.
- Typical properties (Median) have an occupancy rate around 37%.
- Entry-level properties (Bottom 25%) average 20% occupancy, potentially facing higher vacancy.
Average Monthly Occupancy Rate Trend in Holmes Beach
Average Daily Rate (ADR) Airbnb Trends in Holmes Beach (2026)
Effective short term rental pricing strategy in Holmes Beach involves understanding monthly ADR fluctuations. The Average Daily Rate (ADR) for Airbnb in Holmes Beach typically peaks in March and dips lowest during September. Leveraging Airbnb dynamic pricing tools or strategies based on this seasonality can significantly boost revenue. Here's a look at the typical nightly rates achieved:
- Best-in-class properties (Top 10%) command rates of $780+ per night, often due to premium features or locations.
- Strong performing properties (Top 25%) achieve nightly rates of $547 or more.
- Typical properties (Median) charge around $387 per night.
- Entry-level properties (Bottom 25%) earn around $281 per night.
Average Daily Rate (ADR) Trend by Month in Holmes Beach
Get Live Holmes Beach Market Intelligence 👇

Explore Real-time Analytics
Airbnb Seasonality Analysis & Trends in Holmes Beach (2026)
Peak Season (March, February, April)
- Revenue averages $8,647 per month
- Occupancy rates average 52.2%
- Daily rates average $503
Shoulder Season
- Revenue averages $5,719 per month
- Occupancy maintains around 40.8%
- Daily rates hold near $435
Low Season (January, September, December)
- Revenue drops to average $4,090 per month
- Occupancy decreases to average 29.0%
- Daily rates adjust to average $455
Seasonality Insights for Holmes Beach
- The Airbnb seasonality in Holmes Beach shows highly seasonal trends requiring careful strategy. While the sections above show seasonal averages, it's also insightful to look at the extremes:
- During the high season, the absolute peak month showcases Holmes Beach's highest earning potential, with monthly revenues capable of climbing to $9,947, occupancy reaching a high of 57.0%, and ADRs peaking at $527.
- Conversely, the slowest single month of the year, typically falling within the low season, marks the market's lowest point. In this month, revenue might dip to $3,751, occupancy could drop to 27.7%, and ADRs may adjust down to $394.
- Understanding both the seasonal averages and these monthly peaks and troughs in revenue, occupancy, and ADR is crucial for maximizing your Airbnb profit potential in Holmes Beach.
Seasonal Strategies for Maximizing Profit
- Peak Season: Maximize revenue through premium pricing and potentially longer minimum stays. Ensure high availability.
- Low Season: Offer competitive pricing, special promotions (e.g., extended stay discounts), and flexible cancellation policies. Target off-season travelers like remote workers or budget-conscious guests.
- Shoulder Seasons: Implement dynamic pricing that balances peak and low rates. Target weekend travelers or specific events. Offer slightly more flexible terms than peak season.
- Regularly analyze your own performance against these Holmes Beach seasonality benchmarks and adjust your pricing and availability strategy accordingly.
Best Areas for Airbnb Investment in Holmes Beach (2026)
Exploring the top neighborhoods for short-term rentals in Holmes Beach? This section highlights key areas, outlining why they are attractive for hosts and guests, along with notable local attractions. Consider these locations based on your target guest profile and investment strategy.
| Neighborhood / Area | Why Host Here? (Target Guests & Appeal) | Key Attractions & Landmarks |
|---|---|---|
| Bradenton Beach | A charming beach town with beautiful sandy beaches and a relaxed atmosphere. Ideal for families and visitors looking for a laid-back vacation experience. | Coquina Beach, Bridge Street, Anna Maria Island Historical Society, The BeachHouse Restaurant, Manatee Public Beach |
| Anna Maria Island | Known for its pristine beaches and quaint, small-town feel. A sought-after destination for beach lovers and those looking for a scenic getaway. | Bean Point, Anna Maria Island Pier, Holmes Beach, Cortez Beach, Anna Maria Island Historical Museum |
| Longboat Key | An upscale beachfront area offering luxury accommodations, secluded beaches, and fine dining. This is a favored spot for affluent tourists seeking relaxation. | Longboat Key Beach, Joan M. Durante Community Park, Lido Key, Mote Marine Laboratory & Aquarium, The Chart House |
| Sarasota | Cultural hub with art galleries, theaters, and incredible beaches. Attracts a diverse range of tourists and is perfect for visitors who appreciate arts and culture. | Ringling Museum of Art, Siesta Key Beach, Marie Selby Botanical Gardens, Sarasota Opera, St. Armands Circle |
| Siesta Key | Renowned for its powdery white sand beaches and vibrant nightlife. A perfect destination for younger crowds and families alike. | Siesta Key Beach, Turtle Beach, Siesta Key Village, Point of Rocks, Captain Curt's |
| Eggmont Key State Park | A beautiful, uninhabited island accessible only by boat, offering stunning natural beauty and wildlife. Perfect for eco-tourism and adventurous visitors. | Historic Fort Dade, Wildlife watching, Snorkeling spots, Pristine beaches, Hiking trails |
| Lido Key | A small barrier island known for upscale resorts and exclusive beaches. Attracts affluent travelers looking for a peaceful beach escape. | Lido Key Beach, South Lido Park, Lido Key Marina, St. Armands Key, Beachfront dining options |
| Palmetto | A growing city with a mix of suburban and waterfront living. Attractive to families and those looking for a quieter alternative to beaches while still being close to attractions. | Palmetto Historical Park, Riverside Park, Ellenton Premium Outlets, Regatta Point Marina, Green Bridge |
Understanding Airbnb License Requirements & STR Laws in Holmes Beach (2026)
While Holmes Beach, Florida, United States currently shows low STR regulations, specific Airbnb license requirements might still exist or change. Always verify the latest short term rental regulations and Airbnb license requirements directly with local government authorities for Holmes Beach to ensure full compliance before hosting.
(Source: AirROI data, 2026, finding no licensed listings among those analyzed)
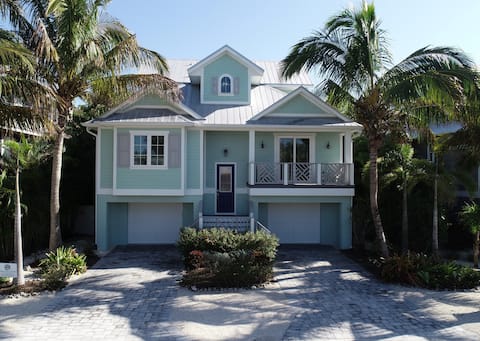
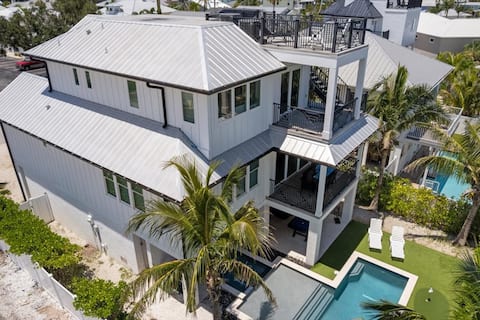
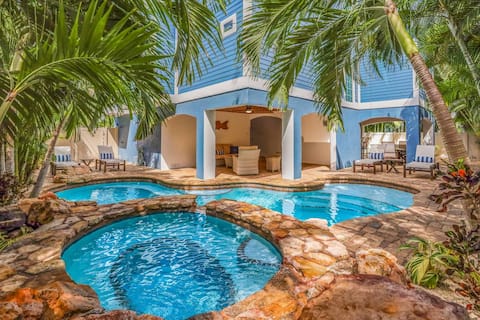
Top Performing Airbnb Properties in Holmes Beach (2026)
Benchmark your potential! Explore examples of top-performing Airbnb properties in Holmes Beachbased on Trailing Twelve Month (TTM) revenue. Analyze their characteristics, revenue, occupancy rate, and ADR to understand what drives success in this market.
6 BR/5.5 Bth Heated Pool/Spa/Slide -1 Min to Beach
Entire Place • 6 bedrooms
Beach! Spa, Pool, PuttPutt Games&More
Entire Place • 4 bedrooms

Luxury BEACH HOME! 2 King Suites! Heated Pool/Spa!
Entire Place • 4 bedrooms
Above it All: Rooftop Deck, Pool, 5 Homes to Beach
Entire Place • 5 bedrooms

Octopus Cottage: 1.5 Blocks to Beach, Pool & Spa
Entire Place • 4 bedrooms

Sunkissed&Salty: Prime Location!
Entire Place • 4 bedrooms
Note: Performance varies based on location, size, amenities, seasonality, and management quality. Data reflects the past 12 months.
Top Performing Airbnb Hosts in Holmes Beach (2026)
Learn from the best! This table showcases top-performing Airbnb hosts in Holmes Beach based on the number of properties managed and estimated total revenue over the past year. Analyze their scale and performance metrics.
| Host Name | Properties | Grossing Revenue | Stay Reviews | Avg Rating |
|---|---|---|---|---|
| AMI Locals And AMI Accommodati | 156 | $5,217,226 | 1475 | 4.69/5.0 |
| Anna Maria Life | 46 | $2,628,169 | 293 | 4.84/5.0 |
| Beach Boutique Rentals | 29 | $1,954,512 | 693 | 4.93/5.0 |
| Sato Real Estate | 39 | $1,948,609 | 426 | 4.70/5.0 |
| Duncan | 37 | $1,403,362 | 356 | 4.83/5.0 |
| Anna Maria Vacations | 41 | $963,619 | 128 | 4.56/5.0 |
| Mainsail Lodging | 9 | $719,198 | 33 | 4.95/5.0 |
| Island Vacation | 40 | $661,827 | 82 | 4.73/5.0 |
| SeaBreeze | 25 | $630,061 | 192 | 4.74/5.0 |
| Beach House Real Estate | 14 | $583,983 | 46 | 4.65/5.0 |
Analyzing the strategies of top hosts, such as their property selection, pricing, and guest communication, can offer valuable lessons for optimizing your own Airbnb operations in Holmes Beach.
Dive Deeper: Advanced Holmes Beach STR Market Data (2026)
Ready to unlock more insights? AirROI provides access to advanced metrics and comprehensive Airbnb data for Holmes Beach. Explore detailed analytics beyond this report to refine your investment strategy, optimize pricing, and maximize your vacation rental profits.
Explore Advanced MetricsHolmes Beach Short-Term Rental Market Composition (2026): Property & Room Types
Room Type Distribution
Property Type Distribution
Market Composition Insights for Holmes Beach
- The Holmes Beach Airbnb market composition is heavily skewed towards Entire Home/Apt listings, which make up 98.6% of the 881 active rentals. This indicates strong guest preference for privacy and space.
- Looking at the property type distribution in Holmes Beach, House properties are the most common (70.4%), reflecting the local real estate landscape.
- Houses represent a significant 70.4% portion, catering likely to families or larger groups.
- Smaller segments like hotel/boutique (combined 1.4%) offer potential for unique stay experiences.
Holmes Beach Airbnb Room Capacity Analysis (2026): Bedroom Distribution
Distribution of Listings by Number of Bedrooms
Room Capacity Insights for Holmes Beach
- The dominant room capacity in Holmes Beach is 2 bedrooms listings, making up 39.4% of the market. This suggests a strong demand for properties suitable for couples or solo travelers.
- Together, 2 bedrooms and 3 bedrooms properties represent 66.9% of the active Airbnb listings in Holmes Beach, indicating a high concentration in these sizes.
- A significant 48.6% of listings offer 3+ bedrooms, catering to larger groups and families seeking more space in Holmes Beach.
Holmes Beach Vacation Rental Guest Capacity Trends (2026)
Distribution of Listings by Guest Capacity
Guest Capacity Insights for Holmes Beach
- The most common guest capacity trend in Holmes Beach vacation rentals is listings accommodating 6 guests (47.1%). This suggests the primary traveler segment is likely larger groups.
- Properties designed for 6 guests and 4 guests dominate the Holmes Beach STR market, accounting for 71.2% of listings.
- 70.1% of properties accommodate 6+ guests, serving the market segment for larger families or group travel in Holmes Beach.
- On average, properties in Holmes Beach are equipped to host 5.8 guests.
Holmes Beach Airbnb Booking Patterns (2026): Available vs. Booked Days
Available Days Distribution
Booked Days Distribution
Booking Pattern Insights for Holmes Beach
- The most common availability pattern in Holmes Beach falls within the 271-366 days range, representing 58.6% of listings. This suggests many properties have significant open periods on their calendars.
- Approximately 86.2% of listings show high availability (181+ days open annually), indicating potential for increased bookings or specific owner usage patterns.
- For booked days, the 31-90 days range is most frequent in Holmes Beach (35.4%), reflecting common guest stay durations or potential owner blocking patterns.
- A notable 14.4% of properties secure long booking periods (181+ days booked per year), highlighting successful long-term rental strategies or significant owner usage.
Holmes Beach Airbnb Minimum Stay Requirements Analysis
Distribution of Listings by Minimum Night Requirement
1 Night
39 listings
4.4% of total
2 Nights
7 listings
0.8% of total
3 Nights
4 listings
0.5% of total
4-6 Nights
116 listings
13.2% of total
7-29 Nights
365 listings
41.4% of total
30+ Nights
350 listings
39.7% of total
Key Insights
- The most prevalent minimum stay requirement in Holmes Beach is 7-29 Nights, adopted by 41.4% of listings. This highlights the market's preference for shorter, flexible bookings.
- Very short stays (1-2 nights) are less common (5.2%), suggesting hosts prefer slightly longer bookings to optimize turnover.
- A significant segment (39.7%) caters to monthly stays (30+ nights) in Holmes Beach, pointing to opportunities in the extended-stay market.
Recommendations
- Align with the market by considering a 7-29 Nights minimum stay, as 41.4% of Holmes Beach hosts use this setting.
- If feasible, allowing 1-night stays, especially midweek or during low season, could capture last-minute bookings, as only 4.4% currently do.
- Explore offering discounts for stays of 30+ nights to attract the 39.7% of the market seeking extended stays.
- Adjust minimum nights based on seasonality – potentially shorter during low season and longer during peak demand periods in Holmes Beach.
Holmes Beach Airbnb Cancellation Policy Trends Analysis (2026)
Limited
13 listings
1.5% of total
Super Strict 60 Days
114 listings
13% of total
Super Strict 30 Days
323 listings
37% of total
Flexible
16 listings
1.8% of total
Moderate
69 listings
7.9% of total
Firm
200 listings
22.9% of total
Strict
139 listings
15.9% of total
Cancellation Policy Insights for Holmes Beach
- The prevailing Airbnb cancellation policy trend in Holmes Beach is Super Strict 30 Days, used by 37% of listings.
- There's a relatively balanced mix between guest-friendly (9.7%) and stricter (38.8%) policies, offering choices for different guest needs.
Recommendations for Hosts
- Consider adopting a Super Strict 30 Days policy to align with the 37% market standard in Holmes Beach.
- Regularly review your cancellation policy against competitors and market demand shifts in Holmes Beach.
Holmes Beach STR Booking Lead Time Analysis (2026)
Average Booking Lead Time by Month
Booking Lead Time Insights for Holmes Beach
- The overall average booking lead time for vacation rentals in Holmes Beach is 99 days.
- Guests book furthest in advance for stays during March (average 143 days), likely coinciding with peak travel demand or local events.
- The shortest booking windows occur for stays in July (average 64 days), indicating more last-minute travel plans during this time.
- Seasonally, Spring (124 days avg.) sees the longest lead times, while Summer (70 days avg.) has the shortest, reflecting typical travel planning cycles.
Recommendations for Hosts
- Use the overall average lead time (99 days) as a baseline for your pricing and availability strategy in Holmes Beach.
- For March stays, consider implementing length-of-stay discounts or slightly higher rates for bookings made less than 143 days out to capitalize on advance planning.
- Target marketing efforts for the Spring season well in advance (at least 124 days) to capture early planners.
- Monitor your own booking lead times against these Holmes Beach averages to identify opportunities for dynamic pricing adjustments.
Popular & Essential Airbnb Amenities in Holmes Beach (2026)
Amenity Prevalence
Amenity Insights for Holmes Beach
- Essential amenities in Holmes Beach that guests expect include: Air conditioning, Wifi, Kitchen, TV, Free parking on premises, Refrigerator, Coffee maker, Smoke alarm, Hair dryer. Lacking these (any) could significantly impact bookings.
- Popular amenities like Heating are common but not universal. Offering these can provide a competitive edge.
Recommendations for Hosts
- Ensure your listing includes all essential amenities for Holmes Beach: Air conditioning, Wifi, Kitchen, TV, Free parking on premises, Refrigerator, Coffee maker, Smoke alarm, Hair dryer.
- Prioritize adding missing essentials: Kitchen, TV, Free parking on premises, Refrigerator, Coffee maker, Smoke alarm, Hair dryer.
- Consider adding popular differentiators like Heating to increase appeal.
- Highlight unique or less common amenities you offer (e.g., hot tub, dedicated workspace, EV charger) in your listing description and photos.
- Regularly check competitor amenities in Holmes Beach to stay competitive.
Holmes Beach Airbnb Guest Demographics & Profile Analysis (2026)
Guest Profile Summary for Holmes Beach
- The typical guest profile for Airbnb in Holmes Beach consists of primarily domestic travelers (93%), often arriving from nearby Miami, typically belonging to the Post-2000s (Gen Z/Alpha) group (50%), primarily speaking English or Spanish.
- Domestic travelers account for 92.8% of guests.
- Key international markets include United States (92.8%) and United Kingdom (2.2%).
- Top languages spoken are English (71.7%) followed by Spanish (11.4%).
- A significant demographic segment is the Post-2000s (Gen Z/Alpha) group, representing 50% of guests.
Recommendations for Hosts
- Target domestic marketing efforts towards travelers from Miami and Orlando.
- Tailor amenities and listing descriptions to appeal to the dominant Post-2000s (Gen Z/Alpha) demographic (e.g., highlight fast WiFi, smart home features, local guides).
- Highlight unique local experiences or amenities relevant to the primary guest profile.
- Consider seasonal promotions aligned with peak travel times for key origin markets.
Nearby Short-Term Rental Market Comparison
How does the Holmes Beach Airbnb market stack up against its neighbors? Compare key performance metrics like average monthly revenue, ADR, and occupancy rates in surrounding areas to understand the broader regional STR landscape.
| Market | Active Properties | Monthly Revenue | Daily Rate | Avg. Occupancy |
|---|---|---|---|---|
| Anna Maria island | 587 | $7,996 | $823.96 | 41% |
| Anna Maria | 56 | $6,434 | $692.96 | 52% |
| Reunion | 12 | $6,321 | $580.45 | 44% |
| Boca Grande | 31 | $6,128 | $787.07 | 37% |
| Indian Rocks Beach | 842 | $5,560 | $419.63 | 49% |
| Captiva | 291 | $5,443 | $667.40 | 36% |
| Siesta Key | 1,175 | $5,206 | $518.91 | 42% |
| Belleair Beach | 94 | $5,086 | $339.65 | 53% |
| Bradenton Beach | 122 | $4,977 | $507.12 | 42% |
| Thonotosassa | 17 | $4,309 | $347.75 | 50% |