Holiday Airbnb Market Analysis 2026: Short Term Rental Data & Vacation Rental Statistics in Florida, United States
Is Airbnb profitable in Holiday in 2026? Explore comprehensive Airbnb analytics for Holiday, Florida, United States to uncover income potential. This 2026 STR market report for Holiday, based on AirROI data from February 2025 to January 2026, reveals key trends in the niche market of 105 active listings.
Whether you're considering an Airbnb investment in Holiday, optimizing your existing vacation rental, or exploring rental arbitrage opportunities, understanding the Holiday Airbnb data is crucial. Leveraging the low regulation environment is key to maximizing your short term rental income potential. Let's dive into the specifics.
Key Holiday Airbnb Performance Metrics Overview
Monthly Airbnb Revenue Variations & Income Potential in Holiday (2026)
Understanding the monthly revenue variations for Airbnb listings in Holiday is key to maximizing your short term rental income potential. Seasonality significantly impacts earnings. Our analysis, based on data from the past 12 months, shows that the peak revenue month for STRs in Holiday is typically March, while September often presents the lowest earnings, highlighting opportunities for strategic pricing adjustments during shoulder and low seasons. Explore the typical Airbnb income in Holiday across different performance tiers:
- Best-in-class properties (Top 10%) achieve $5,401+ monthly, often utilizing dynamic pricing and superior guest experiences.
- Strong performing properties (Top 25%) earn $3,504 or more, indicating effective management and desirable locations/amenities.
- Typical properties (Median) generate around $1,936 per month, representing the average market performance.
- Entry-level properties (Bottom 25%) see earnings around $1,034, often with potential for optimization.
Average Monthly Airbnb Earnings Trend in Holiday
Holiday Airbnb Occupancy Rate Trends (2026)
Maximize your bookings by understanding the Holiday STR occupancy trends. Seasonal demand shifts significantly influence how often properties are booked. Typically, Marchsees the highest demand (peak season occupancy), while September experiences the lowest (low season). Effective strategies, like adjusting minimum stays or offering promotions, can boost occupancy during slower periods. Here's how different property tiers perform in Holiday:
- Best-in-class properties (Top 10%) achieve 84%+ occupancy, indicating high desirability and potentially optimized availability.
- Strong performing properties (Top 25%) maintain 71% or higher occupancy, suggesting good market fit and guest satisfaction.
- Typical properties (Median) have an occupancy rate around 48%.
- Entry-level properties (Bottom 25%) average 24% occupancy, potentially facing higher vacancy.
Average Monthly Occupancy Rate Trend in Holiday
Average Daily Rate (ADR) Airbnb Trends in Holiday (2026)
Effective short term rental pricing strategy in Holiday involves understanding monthly ADR fluctuations. The Average Daily Rate (ADR) for Airbnb in Holiday typically peaks in September and dips lowest during April. Leveraging Airbnb dynamic pricing tools or strategies based on this seasonality can significantly boost revenue. Here's a look at the typical nightly rates achieved:
- Best-in-class properties (Top 10%) command rates of $277+ per night, often due to premium features or locations.
- Strong performing properties (Top 25%) achieve nightly rates of $211 or more.
- Typical properties (Median) charge around $153 per night.
- Entry-level properties (Bottom 25%) earn around $94 per night.
Average Daily Rate (ADR) Trend by Month in Holiday
Get Live Holiday Market Intelligence 👇

Explore Real-time Analytics
Airbnb Seasonality Analysis & Trends in Holiday (2026)
Peak Season (March, February, July)
- Revenue averages $3,243 per month
- Occupancy rates average 62.5%
- Daily rates average $153
Shoulder Season
- Revenue averages $2,365 per month
- Occupancy maintains around 45.5%
- Daily rates hold near $159
Low Season (January, September, October)
- Revenue drops to average $1,969 per month
- Occupancy decreases to average 38.9%
- Daily rates adjust to average $170
Seasonality Insights for Holiday
- The Airbnb seasonality in Holiday shows highly seasonal trends requiring careful strategy. While the sections above show seasonal averages, it's also insightful to look at the extremes:
- During the high season, the absolute peak month showcases Holiday's highest earning potential, with monthly revenues capable of climbing to $3,664, occupancy reaching a high of 69.9%, and ADRs peaking at $172.
- Conversely, the slowest single month of the year, typically falling within the low season, marks the market's lowest point. In this month, revenue might dip to $1,829, occupancy could drop to 36.7%, and ADRs may adjust down to $148.
- Understanding both the seasonal averages and these monthly peaks and troughs in revenue, occupancy, and ADR is crucial for maximizing your Airbnb profit potential in Holiday.
Seasonal Strategies for Maximizing Profit
- Peak Season: Maximize revenue through premium pricing and potentially longer minimum stays. Ensure high availability.
- Low Season: Offer competitive pricing, special promotions (e.g., extended stay discounts), and flexible cancellation policies. Target off-season travelers like remote workers or budget-conscious guests.
- Shoulder Seasons: Implement dynamic pricing that balances peak and low rates. Target weekend travelers or specific events. Offer slightly more flexible terms than peak season.
- Regularly analyze your own performance against these Holiday seasonality benchmarks and adjust your pricing and availability strategy accordingly.
Best Areas for Airbnb Investment in Holiday (2026)
Exploring the top neighborhoods for short-term rentals in Holiday? This section highlights key areas, outlining why they are attractive for hosts and guests, along with notable local attractions. Consider these locations based on your target guest profile and investment strategy.
| Neighborhood / Area | Why Host Here? (Target Guests & Appeal) | Key Attractions & Landmarks |
|---|---|---|
| Tarpon Springs | Known for its historic sponge docks and Greek heritage, attracting tourists looking for unique cultural experiences and waterfront activities. | Sponge Docks, Tarpon Springs Aquarium, Downtown Tarpon Springs, Anclote Key Preserve, Sunset Beach |
| Caladesi Island State Park | A pristine, undeveloped island offering beautiful beaches and nature trails, perfect for travelers interested in outdoor activities and solitude. | Caladesi Island Beach, Nature Trails, Kayaking, Wildlife Viewing, Picnic Areas |
| Clearwater Beach | Famous for its white sandy beaches and vibrant atmosphere, attracting families and vacationers looking for sun and entertainment. | Clearwater Marine Aquarium, Pier 60, Beach Walk, Water Sports, Dining Options |
| Dunedin | A charming small town with a vibrant downtown area and beautiful parks, popular with both tourists and locals for its community feel. | Dunedin Marina, Honeymoon Island, Downtown Dunedin, St. Andrews Links, Craft Breweries |
| Palm Harbor | A suburban area with access to beaches and golf courses, appealing to families and retirees looking for a peaceful getaway. | Innisbrook Golf Resort, Lake Tarpon, Wall Springs Park, Palm Harbor Historical Museum, Nearby Beaches |
| Safety Harbor | A quaint town with a rich history and spa resorts, perfect for travelers seeking relaxation and a slower pace of life. | Safety Harbor Spa, Philippe Park, Old Safety Harbor Museum, Craft Breweries, Café and Shops |
| Holiday | A quiet residential area with proximity to beaches and parks, suitable for family vacations and long-term stays. | Anclote River Park, Key Vista Nature Park, Nearby beaches, Shopping Centers, Local Restaurants |
| St. Petersburg | An artsy city with a lively waterfront and cultural attractions, attracting those looking for urban experiences and beach access. | The Dalí Museum, Fort De Soto Park, St. Pete Pier, Chihuly Collection, Art District |
Understanding Airbnb License Requirements & STR Laws in Holiday (2026)
While Holiday, Florida, United States currently shows low STR regulations, specific Airbnb license requirements might still exist or change. Always verify the latest short term rental regulations and Airbnb license requirements directly with local government authorities for Holiday to ensure full compliance before hosting.
(Source: AirROI data, 2026, finding no licensed listings among those analyzed)
Top Performing Airbnb Properties in Holiday (2026)
Benchmark your potential! Explore examples of top-performing Airbnb properties in Holidaybased on Trailing Twelve Month (TTM) revenue. Analyze their characteristics, revenue, occupancy rate, and ADR to understand what drives success in this market.
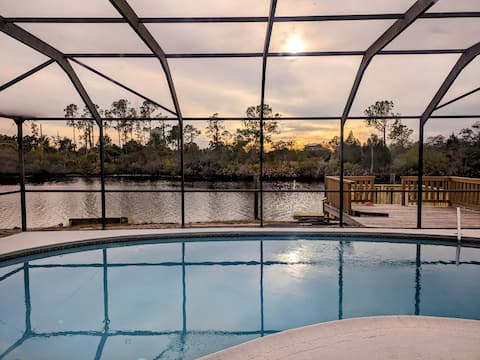
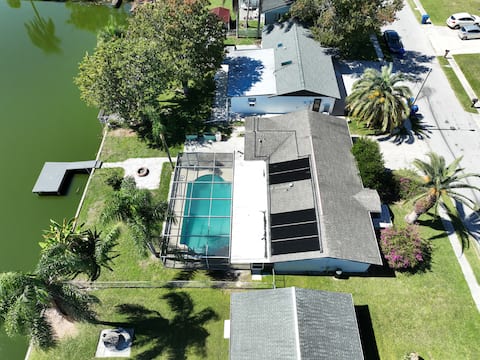
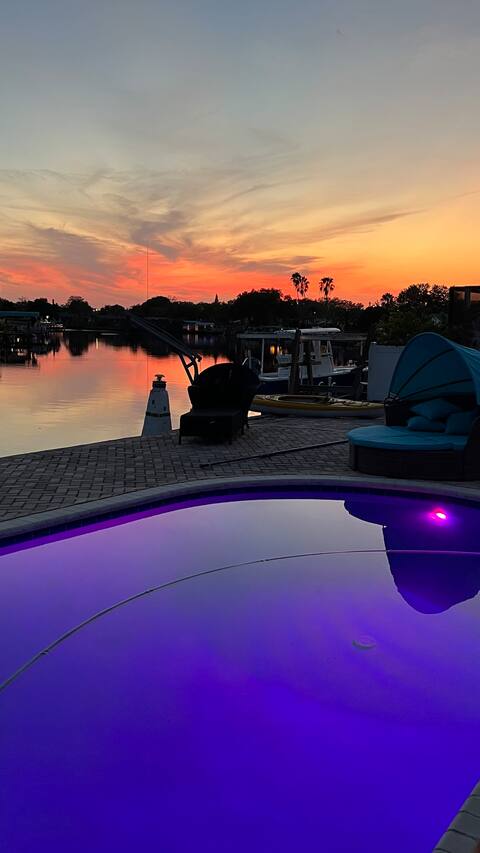
River Home with Pool, Sunset, Dolphin & Fishing
Entire Place • 3 bedrooms
Lakefront Paradise with Heated Saltwater Pool
Entire Place • 2 bedrooms

The Dolphin-Watch Waterway – Pool/Spa Tarpon
Entire Place • 2 bedrooms

Lavish Holiday Home w/ Lanai & Heated Outdoor Pool
Entire Place • 3 bedrooms
Paradise!Renovated waterfront pool home.Sunsets!
Entire Place • 2 bedrooms

Lake Front Getaway - Sleeps 13
Entire Place • 4 bedrooms
Note: Performance varies based on location, size, amenities, seasonality, and management quality. Data reflects the past 12 months.
Top Performing Airbnb Hosts in Holiday (2026)
Learn from the best! This table showcases top-performing Airbnb hosts in Holiday based on the number of properties managed and estimated total revenue over the past year. Analyze their scale and performance metrics.
| Host Name | Properties | Grossing Revenue | Stay Reviews | Avg Rating |
|---|---|---|---|---|
| Marco | 2 | $103,766 | 45 | 5.00/5.0 |
| Evolve | 3 | $91,516 | 50 | 4.69/5.0 |
| Dino | 10 | $81,764 | 204 | 4.61/5.0 |
| Gissella Maria | 2 | $72,370 | 220 | 4.95/5.0 |
| Smita | 1 | $69,351 | 52 | 4.98/5.0 |
| Nicole | 1 | $67,540 | 103 | 4.92/5.0 |
| Brian | 1 | $64,567 | 75 | 4.88/5.0 |
| Alissa | 3 | $62,993 | 85 | 4.74/5.0 |
| Aneta | 1 | $61,270 | 94 | 4.97/5.0 |
| Donna | 1 | $61,238 | 16 | 4.63/5.0 |
Analyzing the strategies of top hosts, such as their property selection, pricing, and guest communication, can offer valuable lessons for optimizing your own Airbnb operations in Holiday.
Dive Deeper: Advanced Holiday STR Market Data (2026)
Ready to unlock more insights? AirROI provides access to advanced metrics and comprehensive Airbnb data for Holiday. Explore detailed analytics beyond this report to refine your investment strategy, optimize pricing, and maximize your vacation rental profits.
Explore Advanced MetricsHoliday Short-Term Rental Market Composition (2026): Property & Room Types
Room Type Distribution
Property Type Distribution
Market Composition Insights for Holiday
- The Holiday Airbnb market composition is heavily skewed towards Entire Home/Apt listings, which make up 87.6% of the 105 active rentals. This indicates strong guest preference for privacy and space.
- Looking at the property type distribution in Holiday, House properties are the most common (83.8%), reflecting the local real estate landscape.
- Houses represent a significant 83.8% portion, catering likely to families or larger groups.
Holiday Airbnb Room Capacity Analysis (2026): Bedroom Distribution
Distribution of Listings by Number of Bedrooms
Room Capacity Insights for Holiday
- The dominant room capacity in Holiday is 3 bedrooms listings, making up 34.3% of the market. This suggests a strong demand for properties suitable for families or small groups.
- Together, 3 bedrooms and 2 bedrooms properties represent 64.8% of the active Airbnb listings in Holiday, indicating a high concentration in these sizes.
- A significant 44.8% of listings offer 3+ bedrooms, catering to larger groups and families seeking more space in Holiday.
Holiday Vacation Rental Guest Capacity Trends (2026)
Distribution of Listings by Guest Capacity
Guest Capacity Insights for Holiday
- The most common guest capacity trend in Holiday vacation rentals is listings accommodating 8+ guests (25.7%). This suggests the primary traveler segment is likely larger groups.
- Properties designed for 8+ guests and 6 guests dominate the Holiday STR market, accounting for 50.5% of listings.
- 52.4% of properties accommodate 6+ guests, serving the market segment for larger families or group travel in Holiday.
- On average, properties in Holiday are equipped to host 4.9 guests.
Holiday Airbnb Booking Patterns (2026): Available vs. Booked Days
Available Days Distribution
Booked Days Distribution
Booking Pattern Insights for Holiday
- The most common availability pattern in Holiday falls within the 271-366 days range, representing 41% of listings. This suggests many properties have significant open periods on their calendars.
- Approximately 69.6% of listings show high availability (181+ days open annually), indicating potential for increased bookings or specific owner usage patterns.
- For booked days, the 91-180 days range is most frequent in Holiday (29.5%), reflecting common guest stay durations or potential owner blocking patterns.
- A notable 30.5% of properties secure long booking periods (181+ days booked per year), highlighting successful long-term rental strategies or significant owner usage.
Holiday Airbnb Minimum Stay Requirements Analysis
Distribution of Listings by Minimum Night Requirement
1 Night
31 listings
29.5% of total
2 Nights
17 listings
16.2% of total
3 Nights
11 listings
10.5% of total
4-6 Nights
10 listings
9.5% of total
7-29 Nights
7 listings
6.7% of total
30+ Nights
29 listings
27.6% of total
Key Insights
- The most prevalent minimum stay requirement in Holiday is 1 Night, adopted by 29.5% of listings. This highlights the market's preference for shorter, flexible bookings.
- A significant segment (27.6%) caters to monthly stays (30+ nights) in Holiday, pointing to opportunities in the extended-stay market.
Recommendations
- Align with the market by considering a 1 Night minimum stay, as 29.5% of Holiday hosts use this setting.
- If feasible, allowing 1-night stays, especially midweek or during low season, could capture last-minute bookings, as only 29.5% currently do.
- Explore offering discounts for stays of 30+ nights to attract the 27.6% of the market seeking extended stays.
- Adjust minimum nights based on seasonality – potentially shorter during low season and longer during peak demand periods in Holiday.
Holiday Airbnb Cancellation Policy Trends Analysis (2026)
Limited
1 listings
1% of total
Flexible
16 listings
15.4% of total
Moderate
43 listings
41.3% of total
Firm
25 listings
24% of total
Strict
19 listings
18.3% of total
Cancellation Policy Insights for Holiday
- The prevailing Airbnb cancellation policy trend in Holiday is Moderate, used by 41.3% of listings.
- There's a relatively balanced mix between guest-friendly (56.7%) and stricter (42.3%) policies, offering choices for different guest needs.
Recommendations for Hosts
- Consider adopting a Moderate policy to align with the 41.3% market standard in Holiday.
- Regularly review your cancellation policy against competitors and market demand shifts in Holiday.
Holiday STR Booking Lead Time Analysis (2026)
Average Booking Lead Time by Month
Booking Lead Time Insights for Holiday
- The overall average booking lead time for vacation rentals in Holiday is 39 days.
- Guests book furthest in advance for stays during February (average 81 days), likely coinciding with peak travel demand or local events.
- The shortest booking windows occur for stays in September (average 22 days), indicating more last-minute travel plans during this time.
- Seasonally, Winter (65 days avg.) sees the longest lead times, while Fall (28 days avg.) has the shortest, reflecting typical travel planning cycles.
Recommendations for Hosts
- Use the overall average lead time (39 days) as a baseline for your pricing and availability strategy in Holiday.
- For February stays, consider implementing length-of-stay discounts or slightly higher rates for bookings made less than 81 days out to capitalize on advance planning.
- Target marketing efforts for the Winter season well in advance (at least 65 days) to capture early planners.
- Monitor your own booking lead times against these Holiday averages to identify opportunities for dynamic pricing adjustments.
Popular & Essential Airbnb Amenities in Holiday (2026)
Amenity Prevalence
Amenity Insights for Holiday
- Essential amenities in Holiday that guests expect include: Air conditioning, Wifi, Free parking on premises, TV, Smoke alarm. Lacking these (any) could significantly impact bookings.
- Popular amenities like Coffee maker, Microwave, Kitchen are common but not universal. Offering these can provide a competitive edge.
Recommendations for Hosts
- Ensure your listing includes all essential amenities for Holiday: Air conditioning, Wifi, Free parking on premises, TV, Smoke alarm.
- Prioritize adding missing essentials: Wifi, Free parking on premises, TV, Smoke alarm.
- Consider adding popular differentiators like Coffee maker or Microwave to increase appeal.
- Highlight unique or less common amenities you offer (e.g., hot tub, dedicated workspace, EV charger) in your listing description and photos.
- Regularly check competitor amenities in Holiday to stay competitive.
Holiday Airbnb Guest Demographics & Profile Analysis (2026)
Guest Profile Summary for Holiday
- The typical guest profile for Airbnb in Holiday consists of primarily domestic travelers (93%), often arriving from nearby Orlando, typically belonging to the Post-2000s (Gen Z/Alpha) group (50%), primarily speaking English or Spanish.
- Domestic travelers account for 92.8% of guests.
- Key international markets include United States (92.8%) and Canada (3.4%).
- Top languages spoken are English (75.1%) followed by Spanish (11.1%).
- A significant demographic segment is the Post-2000s (Gen Z/Alpha) group, representing 50% of guests.
Recommendations for Hosts
- Target domestic marketing efforts towards travelers from Orlando and Tampa.
- Tailor amenities and listing descriptions to appeal to the dominant Post-2000s (Gen Z/Alpha) demographic (e.g., highlight fast WiFi, smart home features, local guides).
- Highlight unique local experiences or amenities relevant to the primary guest profile.
- Consider seasonal promotions aligned with peak travel times for key origin markets.
Nearby Short-Term Rental Market Comparison
How does the Holiday Airbnb market stack up against its neighbors? Compare key performance metrics like average monthly revenue, ADR, and occupancy rates in surrounding areas to understand the broader regional STR landscape.
| Market | Active Properties | Monthly Revenue | Daily Rate | Avg. Occupancy |
|---|---|---|---|---|
| Anna Maria island | 587 | $7,996 | $823.96 | 41% |
| Anna Maria | 56 | $6,434 | $692.96 | 52% |
| Reunion | 12 | $6,321 | $580.45 | 44% |
| Vilano Beach | 173 | $5,571 | $442.95 | 45% |
| Indian Rocks Beach | 842 | $5,560 | $419.63 | 49% |
| Siesta Key | 1,175 | $5,206 | $518.91 | 42% |
| Belleair Beach | 94 | $5,086 | $339.65 | 53% |
| Bradenton Beach | 122 | $4,977 | $507.12 | 42% |
| Thonotosassa | 17 | $4,309 | $347.75 | 50% |
| Seminole | 519 | $4,223 | $316.69 | 52% |