Hammock Beach Airbnb Market Analysis 2026: Short Term Rental Data & Vacation Rental Statistics in Florida, United States
Is Airbnb profitable in Hammock Beach in 2026? Explore comprehensive Airbnb analytics for Hammock Beach, Florida, United States to uncover income potential. This 2026 STR market report for Hammock Beach, based on AirROI data from February 2025 to January 2026, reveals key trends in the niche market of 197 active listings.
Whether you're considering an Airbnb investment in Hammock Beach, optimizing your existing vacation rental, or exploring rental arbitrage opportunities, understanding the Hammock Beach Airbnb data is crucial. Leveraging the low regulation environment is key to maximizing your short term rental income potential. Let's dive into the specifics.
Key Hammock Beach Airbnb Performance Metrics Overview
Monthly Airbnb Revenue Variations & Income Potential in Hammock Beach (2026)
Understanding the monthly revenue variations for Airbnb listings in Hammock Beach is key to maximizing your short term rental income potential. Seasonality significantly impacts earnings. Our analysis, based on data from the past 12 months, shows that the peak revenue month for STRs in Hammock Beach is typically March, while September often presents the lowest earnings, highlighting opportunities for strategic pricing adjustments during shoulder and low seasons. Explore the typical Airbnb income in Hammock Beach across different performance tiers:
- Best-in-class properties (Top 10%) achieve $10,139+ monthly, often utilizing dynamic pricing and superior guest experiences.
- Strong performing properties (Top 25%) earn $6,787 or more, indicating effective management and desirable locations/amenities.
- Typical properties (Median) generate around $4,163 per month, representing the average market performance.
- Entry-level properties (Bottom 25%) see earnings around $2,264, often with potential for optimization.
Average Monthly Airbnb Earnings Trend in Hammock Beach
Hammock Beach Airbnb Occupancy Rate Trends (2026)
Maximize your bookings by understanding the Hammock Beach STR occupancy trends. Seasonal demand shifts significantly influence how often properties are booked. Typically, Marchsees the highest demand (peak season occupancy), while January experiences the lowest (low season). Effective strategies, like adjusting minimum stays or offering promotions, can boost occupancy during slower periods. Here's how different property tiers perform in Hammock Beach:
- Best-in-class properties (Top 10%) achieve 77%+ occupancy, indicating high desirability and potentially optimized availability.
- Strong performing properties (Top 25%) maintain 58% or higher occupancy, suggesting good market fit and guest satisfaction.
- Typical properties (Median) have an occupancy rate around 38%.
- Entry-level properties (Bottom 25%) average 20% occupancy, potentially facing higher vacancy.
Average Monthly Occupancy Rate Trend in Hammock Beach
Average Daily Rate (ADR) Airbnb Trends in Hammock Beach (2026)
Effective short term rental pricing strategy in Hammock Beach involves understanding monthly ADR fluctuations. The Average Daily Rate (ADR) for Airbnb in Hammock Beach typically peaks in January and dips lowest during August. Leveraging Airbnb dynamic pricing tools or strategies based on this seasonality can significantly boost revenue. Here's a look at the typical nightly rates achieved:
- Best-in-class properties (Top 10%) command rates of $758+ per night, often due to premium features or locations.
- Strong performing properties (Top 25%) achieve nightly rates of $470 or more.
- Typical properties (Median) charge around $380 per night.
- Entry-level properties (Bottom 25%) earn around $297 per night.
Average Daily Rate (ADR) Trend by Month in Hammock Beach
Get Live Hammock Beach Market Intelligence 👇

Explore Real-time Analytics
Airbnb Seasonality Analysis & Trends in Hammock Beach (2026)
Peak Season (March, July, June)
- Revenue averages $6,967 per month
- Occupancy rates average 52.6%
- Daily rates average $434
Shoulder Season
- Revenue averages $4,993 per month
- Occupancy maintains around 40.3%
- Daily rates hold near $424
Low Season (January, September, December)
- Revenue drops to average $3,721 per month
- Occupancy decreases to average 29.9%
- Daily rates adjust to average $456
Seasonality Insights for Hammock Beach
- The Airbnb seasonality in Hammock Beach shows highly seasonal trends requiring careful strategy. While the sections above show seasonal averages, it's also insightful to look at the extremes:
- During the high season, the absolute peak month showcases Hammock Beach's highest earning potential, with monthly revenues capable of climbing to $7,535, occupancy reaching a high of 58.9%, and ADRs peaking at $473.
- Conversely, the slowest single month of the year, typically falling within the low season, marks the market's lowest point. In this month, revenue might dip to $3,382, occupancy could drop to 28.9%, and ADRs may adjust down to $409.
- Understanding both the seasonal averages and these monthly peaks and troughs in revenue, occupancy, and ADR is crucial for maximizing your Airbnb profit potential in Hammock Beach.
Seasonal Strategies for Maximizing Profit
- Peak Season: Maximize revenue through premium pricing and potentially longer minimum stays. Ensure high availability.
- Low Season: Offer competitive pricing, special promotions (e.g., extended stay discounts), and flexible cancellation policies. Target off-season travelers like remote workers or budget-conscious guests.
- Shoulder Seasons: Implement dynamic pricing that balances peak and low rates. Target weekend travelers or specific events. Offer slightly more flexible terms than peak season.
- Regularly analyze your own performance against these Hammock Beach seasonality benchmarks and adjust your pricing and availability strategy accordingly.
Best Areas for Airbnb Investment in Hammock Beach (2026)
Exploring the top neighborhoods for short-term rentals in Hammock Beach? This section highlights key areas, outlining why they are attractive for hosts and guests, along with notable local attractions. Consider these locations based on your target guest profile and investment strategy.
| Neighborhood / Area | Why Host Here? (Target Guests & Appeal) | Key Attractions & Landmarks |
|---|---|---|
| Hammock Beach | A renowned resort area known for its luxurious amenities and proximity to pristine beaches. Ideal for families and couples looking for a relaxing getaway with golf courses and spa services. | Hammock Beach Resort, Hammock Dunes Golf Club, Flagler Beach, Washington Oaks Gardens State Park, Marine Land |
| Palm Coast | A growing community with beautiful waterfront views and numerous parks. Attracts tourists interested in outdoor activities and nature. | Palm Coast Marina, European Village, Cypress Knoll Golf Club, Presidential Park, Bing's Landing |
| Flagler Beach | A laid-back beach town with a friendly vibe. Offers a unique experience for those looking for a quieter beach getaway. | Flagler Beach Pier, Gamble Rogers Memorial State Recreation Area, The Turtle Shack, Flagler Beach Historical Museum |
| Ormond Beach | Just north of Daytona Beach, known for its beautiful beaches and historic sites. Great for tourists who want to mix history with beach life. | Ormond Beach Boardwalk, Tomoka State Park, The Casements, Ormond Memorial Art Museum |
| Daytona Beach | Famous for its speedway and lively atmosphere, this destination is popular among tourists seeking excitement and entertainment year-round. | Daytona International Speedway, Boardwalk Amusements, Daytona Beach Pier, Ocean Walk Village |
| St. Augustine | The oldest city in the U.S. is rich in history and charm. Perfect for those interested in culture, history, and beautiful architecture. | Castillo de San Marcos, St. George Street, Fountain of Youth Archaeological Park, Flagler College |
| Bunnell | A smaller town that offers a more rural feel, attracting those who prefer peace and quiet not far from the coast. | Bull Creek Fish Camp, Bunnell City Park, Hammock Community Center |
| Crescent Beach | A serene beach destination ideal for families and those seeking solitude, offering lovely beachfront properties. | Crescent Beach Park, Anastasia State Park, Fort Matanzas National Monument |
Understanding Airbnb License Requirements & STR Laws in Hammock Beach (2026)
While Hammock Beach, Florida, United States currently shows low STR regulations, specific Airbnb license requirements might still exist or change. Always verify the latest short term rental regulations and Airbnb license requirements directly with local government authorities for Hammock Beach to ensure full compliance before hosting.
(Source: AirROI data, 2026, finding no licensed listings among those analyzed)
Top Performing Airbnb Properties in Hammock Beach (2026)
Benchmark your potential! Explore examples of top-performing Airbnb properties in Hammock Beachbased on Trailing Twelve Month (TTM) revenue. Analyze their characteristics, revenue, occupancy rate, and ADR to understand what drives success in this market.
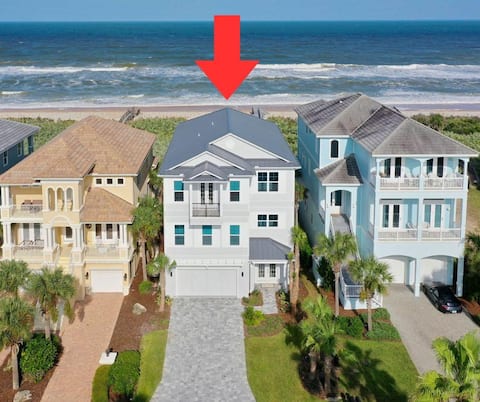
Cinnamon Beach New Oceanfront Heated Pool Home/Pri
Entire Place • 6 bedrooms
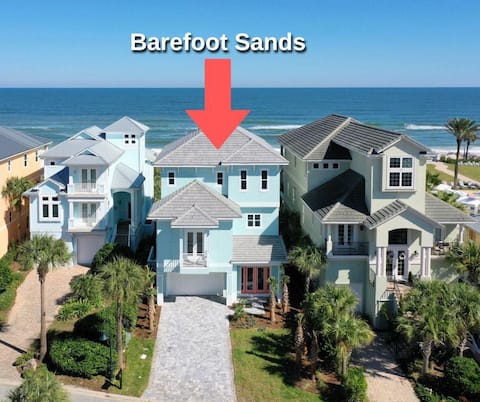
Barefoot Sands! Brand New Oceanfront 6 Bedroom Poo
Entire Place • 5 bedrooms
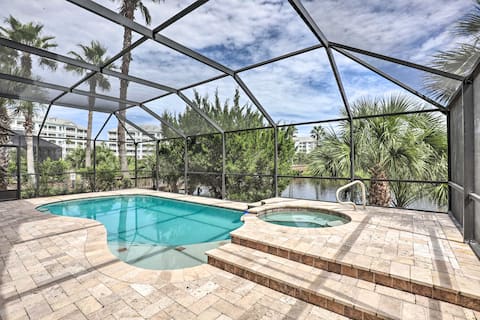
Palm Coast Oasis w/ Pool: Steps to Cinnamon Beach!
Entire Place • 7 bedrooms

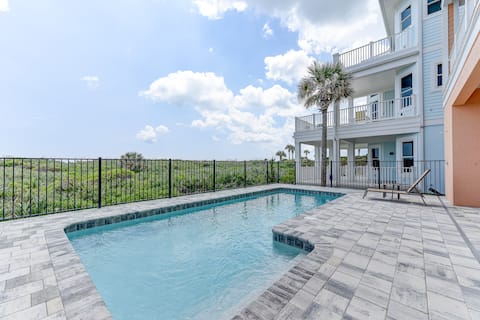
Blue Pearl - Heated Pool & Spa Home With Boardwalk
Entire Place • 6 bedrooms
Coastal Heaven | Pet Friendly, Pool, Beach Access!
Entire Place • 6 bedrooms
Cinnamon Beach Villa Heated Pool Sleeps 18
Entire Place • 6 bedrooms
Note: Performance varies based on location, size, amenities, seasonality, and management quality. Data reflects the past 12 months.
Top Performing Airbnb Hosts in Hammock Beach (2026)
Learn from the best! This table showcases top-performing Airbnb hosts in Hammock Beach based on the number of properties managed and estimated total revenue over the past year. Analyze their scale and performance metrics.
| Host Name | Properties | Grossing Revenue | Stay Reviews | Avg Rating |
|---|---|---|---|---|
| Scott | 85 | $2,910,058 | 581 | 4.86/5.0 |
| Distinctive Beach Rentals | 32 | $1,631,526 | 301 | 4.73/5.0 |
| Evolve | 5 | $282,307 | 173 | 4.72/5.0 |
| Courtney | 3 | $227,975 | 201 | 4.99/5.0 |
| Casago | 4 | $223,399 | 117 | 4.92/5.0 |
| Alina | 2 | $208,308 | 78 | 4.92/5.0 |
| Lee & Laura | 2 | $205,154 | 137 | 4.79/5.0 |
| Sue | 5 | $175,234 | 123 | 4.99/5.0 |
| John | 2 | $152,609 | 155 | 5.00/5.0 |
| Anthony Robert | 3 | $125,638 | 139 | 4.77/5.0 |
Analyzing the strategies of top hosts, such as their property selection, pricing, and guest communication, can offer valuable lessons for optimizing your own Airbnb operations in Hammock Beach.
Dive Deeper: Advanced Hammock Beach STR Market Data (2026)
Ready to unlock more insights? AirROI provides access to advanced metrics and comprehensive Airbnb data for Hammock Beach. Explore detailed analytics beyond this report to refine your investment strategy, optimize pricing, and maximize your vacation rental profits.
Explore Advanced MetricsHammock Beach Short-Term Rental Market Composition (2026): Property & Room Types
Room Type Distribution
Property Type Distribution
Market Composition Insights for Hammock Beach
- The Hammock Beach Airbnb market composition is heavily skewed towards Entire Home/Apt listings, which make up 100% of the 197 active rentals. This indicates strong guest preference for privacy and space.
- Looking at the property type distribution in Hammock Beach, Apartment/Condo properties are the most common (68%), reflecting the local real estate landscape.
- Houses represent a significant 28.9% portion, catering likely to families or larger groups.
- Smaller segments like others, hotel/boutique (combined 3.0%) offer potential for unique stay experiences.
Hammock Beach Airbnb Room Capacity Analysis (2026): Bedroom Distribution
Distribution of Listings by Number of Bedrooms
Room Capacity Insights for Hammock Beach
- The dominant room capacity in Hammock Beach is 3 bedrooms listings, making up 69.5% of the market. This suggests a strong demand for properties suitable for families or small groups.
- Together, 3 bedrooms and 5+ bedrooms properties represent 82.7% of the active Airbnb listings in Hammock Beach, indicating a high concentration in these sizes.
- A significant 90.8% of listings offer 3+ bedrooms, catering to larger groups and families seeking more space in Hammock Beach.
Hammock Beach Vacation Rental Guest Capacity Trends (2026)
Distribution of Listings by Guest Capacity
Guest Capacity Insights for Hammock Beach
- The most common guest capacity trend in Hammock Beach vacation rentals is listings accommodating 8+ guests (56.3%). This suggests the primary traveler segment is likely larger groups.
- Properties designed for 8+ guests and 6 guests dominate the Hammock Beach STR market, accounting for 90.8% of listings.
- 91.8% of properties accommodate 6+ guests, serving the market segment for larger families or group travel in Hammock Beach.
- On average, properties in Hammock Beach are equipped to host 6.9 guests.
Hammock Beach Airbnb Booking Patterns (2026): Available vs. Booked Days
Available Days Distribution
Booked Days Distribution
Booking Pattern Insights for Hammock Beach
- The most common availability pattern in Hammock Beach falls within the 271-366 days range, representing 57.4% of listings. This suggests many properties have significant open periods on their calendars.
- Approximately 84.8% of listings show high availability (181+ days open annually), indicating potential for increased bookings or specific owner usage patterns.
- For booked days, the 31-90 days range is most frequent in Hammock Beach (40.1%), reflecting common guest stay durations or potential owner blocking patterns.
- A notable 15.2% of properties secure long booking periods (181+ days booked per year), highlighting successful long-term rental strategies or significant owner usage.
Hammock Beach Airbnb Minimum Stay Requirements Analysis
Distribution of Listings by Minimum Night Requirement
1 Night
7 listings
3.6% of total
2 Nights
17 listings
8.6% of total
3 Nights
29 listings
14.7% of total
4-6 Nights
16 listings
8.1% of total
7-29 Nights
4 listings
2% of total
30+ Nights
124 listings
62.9% of total
Key Insights
- The most prevalent minimum stay requirement in Hammock Beach is 30+ Nights, adopted by 62.9% of listings. This highlights the market's preference for longer commitments.
- Very short stays (1-2 nights) are less common (12.2%), suggesting hosts prefer slightly longer bookings to optimize turnover.
- A significant segment (62.9%) caters to monthly stays (30+ nights) in Hammock Beach, pointing to opportunities in the extended-stay market.
Recommendations
- Align with the market by considering a 30+ Nights minimum stay, as 62.9% of Hammock Beach hosts use this setting.
- If feasible, allowing 1-night stays, especially midweek or during low season, could capture last-minute bookings, as only 3.6% currently do.
- Explore offering discounts for stays of 30+ nights to attract the 62.9% of the market seeking extended stays.
- Adjust minimum nights based on seasonality – potentially shorter during low season and longer during peak demand periods in Hammock Beach.
Hammock Beach Airbnb Cancellation Policy Trends Analysis (2026)
Super Strict 60 Days
7 listings
3.6% of total
Limited
1 listings
0.5% of total
Super Strict 30 Days
1 listings
0.5% of total
Flexible
11 listings
5.6% of total
Moderate
12 listings
6.2% of total
Firm
155 listings
79.5% of total
Strict
8 listings
4.1% of total
Cancellation Policy Insights for Hammock Beach
- The prevailing Airbnb cancellation policy trend in Hammock Beach is Firm, used by 79.5% of listings.
- A majority (83.6%) of hosts in Hammock Beach utilize Firm or Strict policies, indicating a market where hosts prioritize booking security.
- Strict cancellation policies are quite rare (4.1%), potentially making listings with this policy less competitive unless justified by high demand or property type.
Recommendations for Hosts
- Consider adopting a Firm policy to align with the 79.5% market standard in Hammock Beach.
- Using a Strict policy might deter some guests, as only 4.1% of listings use it. Evaluate if potential revenue protection outweighs possible lower booking rates.
- Regularly review your cancellation policy against competitors and market demand shifts in Hammock Beach.
Hammock Beach STR Booking Lead Time Analysis (2026)
Average Booking Lead Time by Month
Booking Lead Time Insights for Hammock Beach
- The overall average booking lead time for vacation rentals in Hammock Beach is 77 days.
- Guests book furthest in advance for stays during February (average 112 days), likely coinciding with peak travel demand or local events.
- The shortest booking windows occur for stays in September (average 62 days), indicating more last-minute travel plans during this time.
- Seasonally, Winter (91 days avg.) sees the longest lead times, while Summer (67 days avg.) has the shortest, reflecting typical travel planning cycles.
Recommendations for Hosts
- Use the overall average lead time (77 days) as a baseline for your pricing and availability strategy in Hammock Beach.
- For February stays, consider implementing length-of-stay discounts or slightly higher rates for bookings made less than 112 days out to capitalize on advance planning.
- Target marketing efforts for the Winter season well in advance (at least 91 days) to capture early planners.
- Monitor your own booking lead times against these Hammock Beach averages to identify opportunities for dynamic pricing adjustments.
Popular & Essential Airbnb Amenities in Hammock Beach (2026)
Amenity Prevalence
Amenity Insights for Hammock Beach
- Essential amenities in Hammock Beach that guests expect include: Wifi, Air conditioning, Free parking on premises, TV, Heating, Hair dryer, Refrigerator, Kitchen, Cooking basics, Coffee maker. Lacking these (any) could significantly impact bookings.
Recommendations for Hosts
- Ensure your listing includes all essential amenities for Hammock Beach: Wifi, Air conditioning, Free parking on premises, TV, Heating, Hair dryer, Refrigerator, Kitchen, Cooking basics, Coffee maker.
- Prioritize adding missing essentials: Free parking on premises, TV, Heating, Hair dryer, Refrigerator, Kitchen, Cooking basics, Coffee maker.
- Highlight unique or less common amenities you offer (e.g., hot tub, dedicated workspace, EV charger) in your listing description and photos.
- Regularly check competitor amenities in Hammock Beach to stay competitive.
Hammock Beach Airbnb Guest Demographics & Profile Analysis (2026)
Guest Profile Summary for Hammock Beach
- The typical guest profile for Airbnb in Hammock Beach consists of primarily domestic travelers (97%), often arriving from nearby Orlando, typically belonging to the Post-2000s (Gen Z/Alpha) group (50%), primarily speaking English or Spanish.
- Domestic travelers account for 97.2% of guests.
- Key international markets include United States (97.2%) and Canada (0.9%).
- Top languages spoken are English (75.6%) followed by Spanish (14.5%).
- A significant demographic segment is the Post-2000s (Gen Z/Alpha) group, representing 50% of guests.
Recommendations for Hosts
- Target domestic marketing efforts towards travelers from Orlando and Gainesville.
- Tailor amenities and listing descriptions to appeal to the dominant Post-2000s (Gen Z/Alpha) demographic (e.g., highlight fast WiFi, smart home features, local guides).
- Highlight unique local experiences or amenities relevant to the primary guest profile.
- Consider seasonal promotions aligned with peak travel times for key origin markets.
Nearby Short-Term Rental Market Comparison
How does the Hammock Beach Airbnb market stack up against its neighbors? Compare key performance metrics like average monthly revenue, ADR, and occupancy rates in surrounding areas to understand the broader regional STR landscape.
| Market | Active Properties | Monthly Revenue | Daily Rate | Avg. Occupancy |
|---|---|---|---|---|
| St. Johns County | 12 | $6,964 | $592.43 | 47% |
| Reunion | 12 | $6,321 | $580.45 | 44% |
| Ponte Vedra Beach | 224 | $5,720 | $574.75 | 43% |
| Vilano Beach | 173 | $5,571 | $442.95 | 45% |
| Melbourne Beach | 275 | $5,384 | $488.83 | 43% |
| Thonotosassa | 17 | $4,309 | $347.75 | 50% |
| Jacksonville Beach | 763 | $4,123 | $328.32 | 49% |
| Campbell | 22 | $4,011 | $343.05 | 51% |
| Indian Harbour Beach | 131 | $3,895 | $289.71 | 50% |
| Cocoa Beach | 983 | $3,883 | $307.17 | 48% |