Haile Plantation Airbnb Market Analysis 2026: Short Term Rental Data & Vacation Rental Statistics in Florida, United States
Is Airbnb profitable in Haile Plantation in 2026? Explore comprehensive Airbnb analytics for Haile Plantation, Florida, United States to uncover income potential. This 2026 STR market report for Haile Plantation, based on AirROI data from February 2025 to January 2026, reveals key trends in the niche market of 29 active listings.
Whether you're considering an Airbnb investment in Haile Plantation, optimizing your existing vacation rental, or exploring rental arbitrage opportunities, understanding the Haile Plantation Airbnb data is crucial. Leveraging the low regulation environment is key to maximizing your short term rental income potential. Let's dive into the specifics.
Key Haile Plantation Airbnb Performance Metrics Overview
Monthly Airbnb Revenue Variations & Income Potential in Haile Plantation (2026)
Understanding the monthly revenue variations for Airbnb listings in Haile Plantation is key to maximizing your short term rental income potential. Seasonality significantly impacts earnings. Our analysis, based on data from the past 12 months, shows that the peak revenue month for STRs in Haile Plantation is typically March, while January often presents the lowest earnings, highlighting opportunities for strategic pricing adjustments during shoulder and low seasons. Explore the typical Airbnb income in Haile Plantation across different performance tiers:
- Best-in-class properties (Top 10%) achieve $5,163+ monthly, often utilizing dynamic pricing and superior guest experiences.
- Strong performing properties (Top 25%) earn $3,954 or more, indicating effective management and desirable locations/amenities.
- Typical properties (Median) generate around $2,385 per month, representing the average market performance.
- Entry-level properties (Bottom 25%) see earnings around $1,301, often with potential for optimization.
Average Monthly Airbnb Earnings Trend in Haile Plantation
Haile Plantation Airbnb Occupancy Rate Trends (2026)
Maximize your bookings by understanding the Haile Plantation STR occupancy trends. Seasonal demand shifts significantly influence how often properties are booked. Typically, Februarysees the highest demand (peak season occupancy), while September experiences the lowest (low season). Effective strategies, like adjusting minimum stays or offering promotions, can boost occupancy during slower periods. Here's how different property tiers perform in Haile Plantation:
- Best-in-class properties (Top 10%) achieve 75%+ occupancy, indicating high desirability and potentially optimized availability.
- Strong performing properties (Top 25%) maintain 56% or higher occupancy, suggesting good market fit and guest satisfaction.
- Typical properties (Median) have an occupancy rate around 35%.
- Entry-level properties (Bottom 25%) average 19% occupancy, potentially facing higher vacancy.
Average Monthly Occupancy Rate Trend in Haile Plantation
Average Daily Rate (ADR) Airbnb Trends in Haile Plantation (2026)
Effective short term rental pricing strategy in Haile Plantation involves understanding monthly ADR fluctuations. The Average Daily Rate (ADR) for Airbnb in Haile Plantation typically peaks in October and dips lowest during February. Leveraging Airbnb dynamic pricing tools or strategies based on this seasonality can significantly boost revenue. Here's a look at the typical nightly rates achieved:
- Best-in-class properties (Top 10%) command rates of $442+ per night, often due to premium features or locations.
- Strong performing properties (Top 25%) achieve nightly rates of $266 or more.
- Typical properties (Median) charge around $192 per night.
- Entry-level properties (Bottom 25%) earn around $167 per night.
Average Daily Rate (ADR) Trend by Month in Haile Plantation
Get Live Haile Plantation Market Intelligence 👇

Explore Real-time Analytics
Airbnb Seasonality Analysis & Trends in Haile Plantation (2026)
Peak Season (March, April, February)
- Revenue averages $3,345 per month
- Occupancy rates average 53.0%
- Daily rates average $229
Shoulder Season
- Revenue averages $2,770 per month
- Occupancy maintains around 37.8%
- Daily rates hold near $252
Low Season (January, June, September)
- Revenue drops to average $1,985 per month
- Occupancy decreases to average 28.2%
- Daily rates adjust to average $243
Seasonality Insights for Haile Plantation
- The Airbnb seasonality in Haile Plantation shows moderate seasonality with distinct peak and low periods. While the sections above show seasonal averages, it's also insightful to look at the extremes:
- During the high season, the absolute peak month showcases Haile Plantation's highest earning potential, with monthly revenues capable of climbing to $3,528, occupancy reaching a high of 53.4%, and ADRs peaking at $274.
- Conversely, the slowest single month of the year, typically falling within the low season, marks the market's lowest point. In this month, revenue might dip to $1,704, occupancy could drop to 24.7%, and ADRs may adjust down to $227.
- Understanding both the seasonal averages and these monthly peaks and troughs in revenue, occupancy, and ADR is crucial for maximizing your Airbnb profit potential in Haile Plantation.
Seasonal Strategies for Maximizing Profit
- Peak Season: Maximize revenue through premium pricing and potentially longer minimum stays. Ensure high availability.
- Low Season: Offer competitive pricing, special promotions (e.g., extended stay discounts), and flexible cancellation policies. Target off-season travelers like remote workers or budget-conscious guests.
- Shoulder Seasons: Implement dynamic pricing that balances peak and low rates. Target weekend travelers or specific events. Offer slightly more flexible terms than peak season.
- Regularly analyze your own performance against these Haile Plantation seasonality benchmarks and adjust your pricing and availability strategy accordingly.
Best Areas for Airbnb Investment in Haile Plantation (2026)
Exploring the top neighborhoods for short-term rentals in Haile Plantation? This section highlights key areas, outlining why they are attractive for hosts and guests, along with notable local attractions. Consider these locations based on your target guest profile and investment strategy.
| Neighborhood / Area | Why Host Here? (Target Guests & Appeal) | Key Attractions & Landmarks |
|---|---|---|
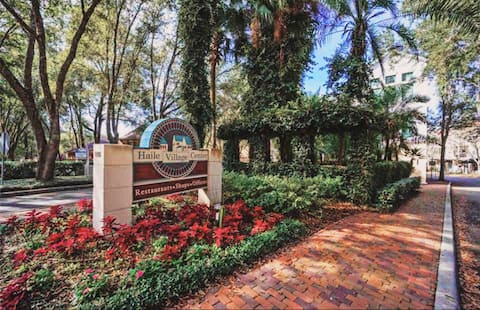
| Haile Village Center | A charming mixed-use community hub, known for its restaurants, shops, and farmer's market. Ideal for travelers wanting a quaint, local vibe close to amenities. | Haile Plantation Farmers Market, Haile Village Center Park, Local shops and cafes, Nature trails, Gainesville Golf and Country Club |
| Newberry Road | A major thoroughfare with a variety of shopping and dining options. Convenient for guests looking for easy access to both Gainesville and surrounding attractions. | North Florida Regional Medical Center, Regal Royal Park Stadium 16, Various restaurant chains, Shopping centers, Gainesville's mall |
| Gainesville Downtown | The vibrant heart of Gainesville, offering nightlife, culture, and proximity to the University of Florida. Great for students, university visitors, and young professionals. | University of Florida, Florida Museum of Natural History, Downtown nightlife, Cultural venues, Local festivals |
| San Felasco Hammock Preserve | A beautiful natural area perfect for nature lovers and outdoor enthusiasts. Attracts guests interested in hiking, biking, and enjoying Florida’s ecosystems. | Hiking trails, Wildlife viewing, Picnic areas, Nature education programs, Vast natural landscapes |
| Kanapaha Park | A large park district providing recreational opportunities. Appeals to families and groups looking for outdoor activities. | Kanapaha Botanical Gardens, Picnic areas, Playgrounds, Walking trails, Community events |
| Tioga Town Center | An upscale community center offering shopping, dining, and entertainment. Attractive for visitors looking for a suburban experience with local flair. | Tioga's local shops and eateries, Recreational facilities, Community events, Consistent foot traffic, Outdoor movie nights |
| Paynes Prairie Preserve State Park | An expansive natural preserve offering unique wildlife viewing and outdoor activities. Ideal for eco-tourists and nature-loving guests. | Wildlife viewing opportunities, Scenic vistas, Nature trails, Birdwatching, Educational programs |
| The Oaks Mall | A major shopping destination in the region. Great for travelers who want easy access to shopping and dining during their stay. | Wide variety of retail stores, Dining options, Entertainment facilities, Cinemas, Seasonal events |
Understanding Airbnb License Requirements & STR Laws in Haile Plantation (2026)
While Haile Plantation, Florida, United States currently shows low STR regulations, specific Airbnb license requirements might still exist or change. Always verify the latest short term rental regulations and Airbnb license requirements directly with local government authorities for Haile Plantation to ensure full compliance before hosting.
(Source: AirROI data, 2026, finding no licensed listings among those analyzed)
Top Performing Airbnb Properties in Haile Plantation (2026)
Benchmark your potential! Explore examples of top-performing Airbnb properties in Haile Plantationbased on Trailing Twelve Month (TTM) revenue. Analyze their characteristics, revenue, occupancy rate, and ADR to understand what drives success in this market.
Southern Comfort!
Entire Place • 2 bedrooms
Modern Haven - KB, QB SfBd, GIG WIFI & Balcony
Entire Place • 1 bedroom
| Haile Village Getaway 2/2 w Pool & Gym Access |
Entire Place • 2 bedrooms
Fully Remodeled Townhome in Haile
Entire Place • 2 bedrooms
Single Story Townhouse Adj Haile Village/King Bed
Entire Place • 2 bedrooms

Super clean corner townhouse, walk to food & bars
Entire Place • 3 bedrooms
Note: Performance varies based on location, size, amenities, seasonality, and management quality. Data reflects the past 12 months.
Top Performing Airbnb Hosts in Haile Plantation (2026)
Learn from the best! This table showcases top-performing Airbnb hosts in Haile Plantation based on the number of properties managed and estimated total revenue over the past year. Analyze their scale and performance metrics.
| Host Name | Properties | Grossing Revenue | Stay Reviews | Avg Rating |
|---|---|---|---|---|
| Cigi | 3 | $102,101 | 199 | 4.93/5.0 |
| Jessica | 1 | $54,864 | 116 | 4.98/5.0 |
| Marcos | 1 | $52,448 | 84 | 4.95/5.0 |
| Cece | 1 | $50,281 | 134 | 4.95/5.0 |
| Tyler | 1 | $49,352 | 13 | 5.00/5.0 |
| Pamela | 2 | $47,316 | 138 | 4.98/5.0 |
| Ellen | 1 | $38,675 | 47 | 4.89/5.0 |
| Colleen | 2 | $37,062 | 163 | 4.97/5.0 |
| Maria | 1 | $34,333 | 109 | 4.91/5.0 |
| Greg | 2 | $33,430 | 46 | 4.79/5.0 |
Analyzing the strategies of top hosts, such as their property selection, pricing, and guest communication, can offer valuable lessons for optimizing your own Airbnb operations in Haile Plantation.
Dive Deeper: Advanced Haile Plantation STR Market Data (2026)
Ready to unlock more insights? AirROI provides access to advanced metrics and comprehensive Airbnb data for Haile Plantation. Explore detailed analytics beyond this report to refine your investment strategy, optimize pricing, and maximize your vacation rental profits.
Explore Advanced MetricsHaile Plantation Short-Term Rental Market Composition (2026): Property & Room Types
Room Type Distribution
Property Type Distribution
Market Composition Insights for Haile Plantation
- The Haile Plantation Airbnb market composition is heavily skewed towards Entire Home/Apt listings, which make up 93.1% of the 29 active rentals. This indicates strong guest preference for privacy and space.
- Looking at the property type distribution in Haile Plantation, House properties are the most common (48.3%), reflecting the local real estate landscape.
- Houses represent a significant 48.3% portion, catering likely to families or larger groups.
- The presence of 10.3% Hotel/Boutique listings indicates integration with traditional hospitality.
Haile Plantation Airbnb Room Capacity Analysis (2026): Bedroom Distribution
Distribution of Listings by Number of Bedrooms
Room Capacity Insights for Haile Plantation
- The dominant room capacity in Haile Plantation is 2 bedrooms listings, making up 51.7% of the market. This suggests a strong demand for properties suitable for couples or solo travelers.
- Together, 2 bedrooms and 3 bedrooms properties represent 72.4% of the active Airbnb listings in Haile Plantation, indicating a high concentration in these sizes.
- A significant 24.1% of listings offer 3+ bedrooms, catering to larger groups and families seeking more space in Haile Plantation.
Haile Plantation Vacation Rental Guest Capacity Trends (2026)
Distribution of Listings by Guest Capacity
Guest Capacity Insights for Haile Plantation
- The most common guest capacity trend in Haile Plantation vacation rentals is listings accommodating 4 guests (41.4%). This suggests the primary traveler segment is likely small families or groups.
- Properties designed for 4 guests and 6 guests dominate the Haile Plantation STR market, accounting for 65.5% of listings.
- 37.8% of properties accommodate 6+ guests, serving the market segment for larger families or group travel in Haile Plantation.
- On average, properties in Haile Plantation are equipped to host 4.6 guests.
Haile Plantation Airbnb Booking Patterns (2026): Available vs. Booked Days
Available Days Distribution
Booked Days Distribution
Booking Pattern Insights for Haile Plantation
- The most common availability pattern in Haile Plantation falls within the 271-366 days range, representing 44.8% of listings. This suggests many properties have significant open periods on their calendars.
- Approximately 72.4% of listings show high availability (181+ days open annually), indicating potential for increased bookings or specific owner usage patterns.
- For booked days, the 91-180 days range is most frequent in Haile Plantation (31%), reflecting common guest stay durations or potential owner blocking patterns.
- A notable 27.5% of properties secure long booking periods (181+ days booked per year), highlighting successful long-term rental strategies or significant owner usage.
Haile Plantation Airbnb Minimum Stay Requirements Analysis
Distribution of Listings by Minimum Night Requirement
1 Night
6 listings
20.7% of total
2 Nights
7 listings
24.1% of total
3 Nights
2 listings
6.9% of total
7-29 Nights
2 listings
6.9% of total
30+ Nights
12 listings
41.4% of total
Key Insights
- The most prevalent minimum stay requirement in Haile Plantation is 30+ Nights, adopted by 41.4% of listings. This highlights the market's preference for longer commitments.
- A significant segment (41.4%) caters to monthly stays (30+ nights) in Haile Plantation, pointing to opportunities in the extended-stay market.
Recommendations
- Align with the market by considering a 30+ Nights minimum stay, as 41.4% of Haile Plantation hosts use this setting.
- If feasible, allowing 1-night stays, especially midweek or during low season, could capture last-minute bookings, as only 20.7% currently do.
- Explore offering discounts for stays of 30+ nights to attract the 41.4% of the market seeking extended stays.
- Adjust minimum nights based on seasonality – potentially shorter during low season and longer during peak demand periods in Haile Plantation.
Haile Plantation Airbnb Cancellation Policy Trends Analysis (2026)
Flexible
3 listings
10.3% of total
Moderate
8 listings
27.6% of total
Firm
16 listings
55.2% of total
Strict
2 listings
6.9% of total
Cancellation Policy Insights for Haile Plantation
- The prevailing Airbnb cancellation policy trend in Haile Plantation is Firm, used by 55.2% of listings.
- A majority (62.1%) of hosts in Haile Plantation utilize Firm or Strict policies, indicating a market where hosts prioritize booking security.
- Strict cancellation policies are quite rare (6.9%), potentially making listings with this policy less competitive unless justified by high demand or property type.
Recommendations for Hosts
- Consider adopting a Firm policy to align with the 55.2% market standard in Haile Plantation.
- Using a Strict policy might deter some guests, as only 6.9% of listings use it. Evaluate if potential revenue protection outweighs possible lower booking rates.
- Regularly review your cancellation policy against competitors and market demand shifts in Haile Plantation.
Haile Plantation STR Booking Lead Time Analysis (2026)
Average Booking Lead Time by Month
Booking Lead Time Insights for Haile Plantation
- The overall average booking lead time for vacation rentals in Haile Plantation is 73 days.
- Guests book furthest in advance for stays during November (average 126 days), likely coinciding with peak travel demand or local events.
- The shortest booking windows occur for stays in December (average 36 days), indicating more last-minute travel plans during this time.
- Seasonally, Fall (104 days avg.) sees the longest lead times, while Winter (48 days avg.) has the shortest, reflecting typical travel planning cycles.
Recommendations for Hosts
- Use the overall average lead time (73 days) as a baseline for your pricing and availability strategy in Haile Plantation.
- For November stays, consider implementing length-of-stay discounts or slightly higher rates for bookings made less than 126 days out to capitalize on advance planning.
- Target marketing efforts for the Fall season well in advance (at least 104 days) to capture early planners.
- Monitor your own booking lead times against these Haile Plantation averages to identify opportunities for dynamic pricing adjustments.
Popular & Essential Airbnb Amenities in Haile Plantation (2026)
Amenity Prevalence
Amenity Insights for Haile Plantation
- Essential amenities in Haile Plantation that guests expect include: TV, Smoke alarm, Air conditioning, Wifi, Heating, Dishes and silverware, Coffee maker, Free parking on premises. Lacking these (any) could significantly impact bookings.
- Popular amenities like Kitchen, Refrigerator are common but not universal. Offering these can provide a competitive edge.
Recommendations for Hosts
- Ensure your listing includes all essential amenities for Haile Plantation: TV, Smoke alarm, Air conditioning, Wifi, Heating, Dishes and silverware, Coffee maker, Free parking on premises.
- Prioritize adding missing essentials: Dishes and silverware, Coffee maker, Free parking on premises.
- Consider adding popular differentiators like Kitchen or Refrigerator to increase appeal.
- Highlight unique or less common amenities you offer (e.g., hot tub, dedicated workspace, EV charger) in your listing description and photos.
- Regularly check competitor amenities in Haile Plantation to stay competitive.
Haile Plantation Airbnb Guest Demographics & Profile Analysis (2026)
Guest Profile Summary for Haile Plantation
- The typical guest profile for Airbnb in Haile Plantation consists of primarily domestic travelers (95%), often arriving from nearby Gainesville, typically belonging to the Post-2000s (Gen Z/Alpha) group (50%), primarily speaking English or Spanish.
- Domestic travelers account for 94.6% of guests.
- Key international markets include United States (94.6%) and California (1.2%).
- Top languages spoken are English (64.6%) followed by Spanish (19.2%).
- A significant demographic segment is the Post-2000s (Gen Z/Alpha) group, representing 50% of guests.
Recommendations for Hosts
- Target domestic marketing efforts towards travelers from Gainesville and Miami.
- Tailor amenities and listing descriptions to appeal to the dominant Post-2000s (Gen Z/Alpha) demographic (e.g., highlight fast WiFi, smart home features, local guides).
- Highlight unique local experiences or amenities relevant to the primary guest profile.
- Consider seasonal promotions aligned with peak travel times for key origin markets.
Nearby Short-Term Rental Market Comparison
How does the Haile Plantation Airbnb market stack up against its neighbors? Compare key performance metrics like average monthly revenue, ADR, and occupancy rates in surrounding areas to understand the broader regional STR landscape.
| Market | Active Properties | Monthly Revenue | Daily Rate | Avg. Occupancy |
|---|---|---|---|---|
| St. Johns County | 12 | $6,964 | $592.43 | 47% |
| Reunion | 12 | $6,321 | $580.45 | 44% |
| Ponte Vedra Beach | 224 | $5,720 | $574.75 | 43% |
| Vilano Beach | 173 | $5,571 | $442.95 | 45% |
| Thonotosassa | 17 | $4,309 | $347.75 | 50% |
| Jacksonville Beach | 763 | $4,123 | $328.32 | 49% |
| Campbell | 22 | $4,011 | $343.05 | 51% |
| Hernando Beach | 83 | $3,741 | $297.76 | 45% |
| Saint Augustine | 1,749 | $3,586 | $287.24 | 46% |
| Polk County | 57 | $3,517 | $269.99 | 48% |