Greenacres Airbnb Market Analysis 2026: Short Term Rental Data & Vacation Rental Statistics in Florida, United States
Is Airbnb profitable in Greenacres in 2026? Explore comprehensive Airbnb analytics for Greenacres, Florida, United States to uncover income potential. This 2026 STR market report for Greenacres, based on AirROI data from February 2025 to January 2026, reveals key trends in the niche market of 47 active listings.
Whether you're considering an Airbnb investment in Greenacres, optimizing your existing vacation rental, or exploring rental arbitrage opportunities, understanding the Greenacres Airbnb data is crucial. Navigating the high regulation landscape is key to maximizing your short term rental income potential. Let's dive into the specifics.
Key Greenacres Airbnb Performance Metrics Overview
Monthly Airbnb Revenue Variations & Income Potential in Greenacres (2026)
Understanding the monthly revenue variations for Airbnb listings in Greenacres is key to maximizing your short term rental income potential. Seasonality significantly impacts earnings. Our analysis, based on data from the past 12 months, shows that the peak revenue month for STRs in Greenacres is typically February, while September often presents the lowest earnings, highlighting opportunities for strategic pricing adjustments during shoulder and low seasons. Explore the typical Airbnb income in Greenacres across different performance tiers:
- Best-in-class properties (Top 10%) achieve $5,282+ monthly, often utilizing dynamic pricing and superior guest experiences.
- Strong performing properties (Top 25%) earn $3,424 or more, indicating effective management and desirable locations/amenities.
- Typical properties (Median) generate around $1,847 per month, representing the average market performance.
- Entry-level properties (Bottom 25%) see earnings around $1,001, often with potential for optimization.
Average Monthly Airbnb Earnings Trend in Greenacres
Greenacres Airbnb Occupancy Rate Trends (2026)
Maximize your bookings by understanding the Greenacres STR occupancy trends. Seasonal demand shifts significantly influence how often properties are booked. Typically, Februarysees the highest demand (peak season occupancy), while September experiences the lowest (low season). Effective strategies, like adjusting minimum stays or offering promotions, can boost occupancy during slower periods. Here's how different property tiers perform in Greenacres:
- Best-in-class properties (Top 10%) achieve 85%+ occupancy, indicating high desirability and potentially optimized availability.
- Strong performing properties (Top 25%) maintain 76% or higher occupancy, suggesting good market fit and guest satisfaction.
- Typical properties (Median) have an occupancy rate around 55%.
- Entry-level properties (Bottom 25%) average 31% occupancy, potentially facing higher vacancy.
Average Monthly Occupancy Rate Trend in Greenacres
Average Daily Rate (ADR) Airbnb Trends in Greenacres (2026)
Effective short term rental pricing strategy in Greenacres involves understanding monthly ADR fluctuations. The Average Daily Rate (ADR) for Airbnb in Greenacres typically peaks in December and dips lowest during September. Leveraging Airbnb dynamic pricing tools or strategies based on this seasonality can significantly boost revenue. Here's a look at the typical nightly rates achieved:
- Best-in-class properties (Top 10%) command rates of $277+ per night, often due to premium features or locations.
- Strong performing properties (Top 25%) achieve nightly rates of $198 or more.
- Typical properties (Median) charge around $108 per night.
- Entry-level properties (Bottom 25%) earn around $74 per night.
Average Daily Rate (ADR) Trend by Month in Greenacres
Get Live Greenacres Market Intelligence 👇

Explore Real-time Analytics
Airbnb Seasonality Analysis & Trends in Greenacres (2026)
Peak Season (February, March, October)
- Revenue averages $3,384 per month
- Occupancy rates average 63.1%
- Daily rates average $154
Shoulder Season
- Revenue averages $2,384 per month
- Occupancy maintains around 51.9%
- Daily rates hold near $152
Low Season (June, August, September)
- Revenue drops to average $1,861 per month
- Occupancy decreases to average 45.3%
- Daily rates adjust to average $143
Seasonality Insights for Greenacres
- The Airbnb seasonality in Greenacres shows highly seasonal trends requiring careful strategy. While the sections above show seasonal averages, it's also insightful to look at the extremes:
- During the high season, the absolute peak month showcases Greenacres's highest earning potential, with monthly revenues capable of climbing to $3,670, occupancy reaching a high of 75.2%, and ADRs peaking at $165.
- Conversely, the slowest single month of the year, typically falling within the low season, marks the market's lowest point. In this month, revenue might dip to $1,694, occupancy could drop to 43.3%, and ADRs may adjust down to $139.
- Understanding both the seasonal averages and these monthly peaks and troughs in revenue, occupancy, and ADR is crucial for maximizing your Airbnb profit potential in Greenacres.
Seasonal Strategies for Maximizing Profit
- Peak Season: Maximize revenue through premium pricing and potentially longer minimum stays. Ensure high availability.
- Low Season: Offer competitive pricing, special promotions (e.g., extended stay discounts), and flexible cancellation policies. Target off-season travelers like remote workers or budget-conscious guests.
- Shoulder Seasons: Implement dynamic pricing that balances peak and low rates. Target weekend travelers or specific events. Offer slightly more flexible terms than peak season.
- Regularly analyze your own performance against these Greenacres seasonality benchmarks and adjust your pricing and availability strategy accordingly.
Best Areas for Airbnb Investment in Greenacres (2026)
Exploring the top neighborhoods for short-term rentals in Greenacres? This section highlights key areas, outlining why they are attractive for hosts and guests, along with notable local attractions. Consider these locations based on your target guest profile and investment strategy.
| Neighborhood / Area | Why Host Here? (Target Guests & Appeal) | Key Attractions & Landmarks |
|---|---|---|
| Greenacres Town Center | The heart of Greenacres with shopping, dining, and entertainment options. A great location for visitors looking for convenience and accessibility to local attractions. | Greenacres Community Park, Greenacres Dog Park, Greenacres Library, Shopping Centers, Local Restaurants |
| Lake Worth Beach | Located just a few miles from Greenacres, this beach area is popular among tourists for its beautiful beaches and vibrant community events. | Lake Worth Beach, Lake Worth Pier, Cultural Council of Palm Beach County, Beachfront restaurants, Pineapple Park |
| Okeeheelee Park | A large park offering various outdoor activities including boating, biking, and picnicking, appealing to nature lovers. | Okeeheelee Nature Center, Trail System, Horseback Riding, Golf Course, Fishing Opportunities |
| Palm Springs | A neighboring community that offers a suburban feel with proximity to Greenacres, popular for family stays and longer vacations. | Palm Springs Park, Shopping facilities, Dining options, Local Markets, Palm Springs Historical Society |
| West Palm Beach | A vibrant city nearby known for its nightlife, arts, and cultural scene, making it a major draw for visitors. | Clematis Street, Norton Museum of Art, Kravis Center for the Performing Arts, CityPlace, Lake Pavilion |
| Lantana | A quaint beach town close to Greenacres, known for its charming town center and proximity to the beach, catering to both relaxation and recreation. | Lantana Beach, Old Key Lime House, Lantana Nature Preserve, Local Festivals, Shopping District |
| Royal Palm Beach | A suburban community with a mix of parks and shopping areas, appealing to families and those looking for a peaceful stay. | Royal Palm Beach Commons Park, Wellington Regional Park, Shopping Malls, Dining Options, Local Events |
| Boynton Beach | A popular beach destination with a mix of residential and tourist attractions, ideal for short-term rentals. | Boynton Beach Oceanfront Park, The Boardwalk, Gumbo Limbo Nature Center, Shopping and Restaurants, Local Art Galleries |
Understanding Airbnb License Requirements & STR Laws in Greenacres (2026)
Yes, Greenacres, Florida, United States enforces high STR regulations. Obtaining a license and ensuring compliance is almost certainly required according to current 2026 STR laws. Always verify the latest short term rental regulations and Airbnb license requirements directly with local government authorities for Greenacres to ensure full compliance before hosting.
(Source: AirROI data, 2026, based on 100% licensed listings)
Top Performing Airbnb Properties in Greenacres (2026)
Benchmark your potential! Explore examples of top-performing Airbnb properties in Greenacresbased on Trailing Twelve Month (TTM) revenue. Analyze their characteristics, revenue, occupancy rate, and ADR to understand what drives success in this market.
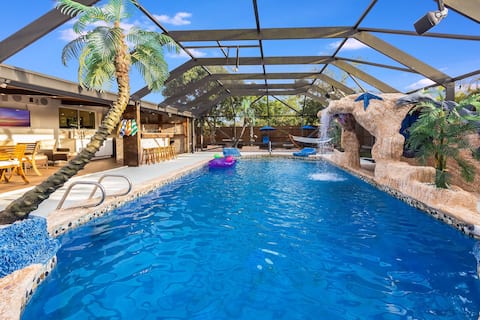
Family Villa: Heated Pool Waterfall Year-Round Fun
Entire Place • 3 bedrooms

The Palm Oasis: Luxurious comfort with Heated pool
Entire Place • 3 bedrooms

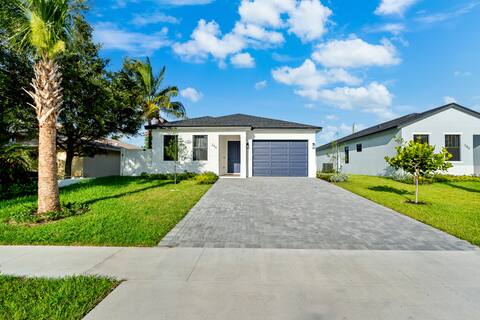
Modern Retreat - minutes to the beach 🏝 🪴
Entire Place • 3 bedrooms
Meadowlark Residence
Entire Place • 4 bedrooms

Modern & Cozy house 2/2 with hot tub
Entire Place • 2 bedrooms

Sunshine Retreat! New! Sparkling Blue Pool And Spa
Entire Place • 3 bedrooms
Note: Performance varies based on location, size, amenities, seasonality, and management quality. Data reflects the past 12 months.
Top Performing Airbnb Hosts in Greenacres (2026)
Learn from the best! This table showcases top-performing Airbnb hosts in Greenacres based on the number of properties managed and estimated total revenue over the past year. Analyze their scale and performance metrics.
| Host Name | Properties | Grossing Revenue | Stay Reviews | Avg Rating |
|---|---|---|---|---|
| Pinny And Ushey | 1 | $105,386 | 93 | 4.78/5.0 |
| Angela | 2 | $65,516 | 328 | 4.93/5.0 |
| Darlene | 1 | $56,556 | 42 | 4.76/5.0 |
| David | 1 | $54,383 | 75 | 4.92/5.0 |
| Lyonie | 1 | $52,648 | 29 | 4.90/5.0 |
| Dunia | 1 | $46,119 | 107 | 4.93/5.0 |
| Edward | 2 | $45,829 | 61 | 4.76/5.0 |
| Jodi | 1 | $43,340 | 52 | 4.92/5.0 |
| Marina | 2 | $43,121 | 32 | 4.97/5.0 |
| Nicolas | 4 | $43,111 | 474 | 4.80/5.0 |
Analyzing the strategies of top hosts, such as their property selection, pricing, and guest communication, can offer valuable lessons for optimizing your own Airbnb operations in Greenacres.
Dive Deeper: Advanced Greenacres STR Market Data (2026)
Ready to unlock more insights? AirROI provides access to advanced metrics and comprehensive Airbnb data for Greenacres. Explore detailed analytics beyond this report to refine your investment strategy, optimize pricing, and maximize your vacation rental profits.
Explore Advanced MetricsGreenacres Short-Term Rental Market Composition (2026): Property & Room Types
Room Type Distribution
Property Type Distribution
Market Composition Insights for Greenacres
- The Greenacres Airbnb market composition is heavily skewed towards Entire Home/Apt listings, which make up 63.8% of the 47 active rentals. This indicates strong guest preference for privacy and space.
- However, a notable 36.2% share for Private Rooms suggests opportunities for budget-conscious travelers or hosts renting out spare rooms.
- Looking at the property type distribution in Greenacres, House properties are the most common (61.7%), reflecting the local real estate landscape.
- Houses represent a significant 61.7% portion, catering likely to families or larger groups.
- The presence of 14.9% Hotel/Boutique listings indicates integration with traditional hospitality.
- Smaller segments like outdoor/unique, others (combined 8.6%) offer potential for unique stay experiences.
Greenacres Airbnb Room Capacity Analysis (2026): Bedroom Distribution
Distribution of Listings by Number of Bedrooms
Room Capacity Insights for Greenacres
- The dominant room capacity in Greenacres is 1 bedroom listings, making up 42.6% of the market. This suggests a strong demand for properties suitable for couples or solo travelers.
- Together, 1 bedroom and 3 bedrooms properties represent 61.7% of the active Airbnb listings in Greenacres, indicating a high concentration in these sizes.
- A significant 27.6% of listings offer 3+ bedrooms, catering to larger groups and families seeking more space in Greenacres.
Greenacres Vacation Rental Guest Capacity Trends (2026)
Distribution of Listings by Guest Capacity
Guest Capacity Insights for Greenacres
- The most common guest capacity trend in Greenacres vacation rentals is listings accommodating 2 guests (25.5%). This suggests the primary traveler segment is likely couples or solo travelers.
- Properties designed for 2 guests and 8+ guests dominate the Greenacres STR market, accounting for 42.5% of listings.
- 29.8% of properties accommodate 6+ guests, serving the market segment for larger families or group travel in Greenacres.
- On average, properties in Greenacres are equipped to host 3.5 guests.
Greenacres Airbnb Booking Patterns (2026): Available vs. Booked Days
Available Days Distribution
Booked Days Distribution
Booking Pattern Insights for Greenacres
- The most common availability pattern in Greenacres falls within the 271-366 days range, representing 36.2% of listings. This suggests many properties have significant open periods on their calendars.
- Approximately 63.9% of listings show high availability (181+ days open annually), indicating potential for increased bookings or specific owner usage patterns.
- For booked days, the 91-180 days range is most frequent in Greenacres (29.8%), reflecting common guest stay durations or potential owner blocking patterns.
- A notable 36.2% of properties secure long booking periods (181+ days booked per year), highlighting successful long-term rental strategies or significant owner usage.
Greenacres Airbnb Minimum Stay Requirements Analysis
Distribution of Listings by Minimum Night Requirement
1 Night
21 listings
44.7% of total
2 Nights
11 listings
23.4% of total
3 Nights
1 listings
2.1% of total
7-29 Nights
1 listings
2.1% of total
30+ Nights
13 listings
27.7% of total
Key Insights
- The most prevalent minimum stay requirement in Greenacres is 1 Night, adopted by 44.7% of listings. This highlights the market's preference for shorter, flexible bookings.
- A strong majority (68.1%) of the Greenacres Airbnb data shows acceptance of very short stays (1-2 nights), indicating a dynamic, high-turnover market.
- A significant segment (27.7%) caters to monthly stays (30+ nights) in Greenacres, pointing to opportunities in the extended-stay market.
Recommendations
- Align with the market by considering a 1 Night minimum stay, as 44.7% of Greenacres hosts use this setting.
- Explore offering discounts for stays of 30+ nights to attract the 27.7% of the market seeking extended stays.
- Adjust minimum nights based on seasonality – potentially shorter during low season and longer during peak demand periods in Greenacres.
Greenacres Airbnb Cancellation Policy Trends Analysis (2026)
Limited
1 listings
2.1% of total
Flexible
12 listings
25.5% of total
Moderate
10 listings
21.3% of total
Firm
18 listings
38.3% of total
Strict
6 listings
12.8% of total
Cancellation Policy Insights for Greenacres
- The prevailing Airbnb cancellation policy trend in Greenacres is Firm, used by 38.3% of listings.
- A majority (51.1%) of hosts in Greenacres utilize Firm or Strict policies, indicating a market where hosts prioritize booking security.
Recommendations for Hosts
- Consider adopting a Firm policy to align with the 38.3% market standard in Greenacres.
- Using a Strict policy might deter some guests, as only 12.8% of listings use it. Evaluate if potential revenue protection outweighs possible lower booking rates.
- Regularly review your cancellation policy against competitors and market demand shifts in Greenacres.
Greenacres STR Booking Lead Time Analysis (2026)
Average Booking Lead Time by Month
Booking Lead Time Insights for Greenacres
- The overall average booking lead time for vacation rentals in Greenacres is 35 days.
- Guests book furthest in advance for stays during February (average 41 days), likely coinciding with peak travel demand or local events.
- The shortest booking windows occur for stays in October (average 16 days), indicating more last-minute travel plans during this time.
- Seasonally, Winter (32 days avg.) sees the longest lead times, while Fall (23 days avg.) has the shortest, reflecting typical travel planning cycles.
Recommendations for Hosts
- Use the overall average lead time (35 days) as a baseline for your pricing and availability strategy in Greenacres.
- Target marketing efforts for the Winter season well in advance (at least 32 days) to capture early planners.
- Monitor your own booking lead times against these Greenacres averages to identify opportunities for dynamic pricing adjustments.
Popular & Essential Airbnb Amenities in Greenacres (2026)
Amenity Prevalence
Amenity Insights for Greenacres
- Essential amenities in Greenacres that guests expect include: Air conditioning, TV, Wifi. Lacking these (any) could significantly impact bookings.
- Popular amenities like Hot water, Dishes and silverware, Free parking on premises are common but not universal. Offering these can provide a competitive edge.
Recommendations for Hosts
- Ensure your listing includes all essential amenities for Greenacres: Air conditioning, TV, Wifi.
- Prioritize adding missing essentials: Wifi.
- Consider adding popular differentiators like Hot water or Dishes and silverware to increase appeal.
- Highlight unique or less common amenities you offer (e.g., hot tub, dedicated workspace, EV charger) in your listing description and photos.
- Regularly check competitor amenities in Greenacres to stay competitive.
Greenacres Airbnb Guest Demographics & Profile Analysis (2026)
Guest Profile Summary for Greenacres
- The typical guest profile for Airbnb in Greenacres consists of primarily domestic travelers (91%), often arriving from nearby Orlando, typically belonging to the Post-2000s (Gen Z/Alpha) group (50%), primarily speaking English or Spanish.
- Domestic travelers account for 91.2% of guests.
- Key international markets include United States (91.2%) and DC (2.6%).
- Top languages spoken are English (63.7%) followed by Spanish (20.7%).
- A significant demographic segment is the Post-2000s (Gen Z/Alpha) group, representing 50% of guests.
Recommendations for Hosts
- Target domestic marketing efforts towards travelers from Orlando and New York.
- Tailor amenities and listing descriptions to appeal to the dominant Post-2000s (Gen Z/Alpha) demographic (e.g., highlight fast WiFi, smart home features, local guides).
- Highlight unique local experiences or amenities relevant to the primary guest profile.
- Consider seasonal promotions aligned with peak travel times for key origin markets.
Nearby Short-Term Rental Market Comparison
How does the Greenacres Airbnb market stack up against its neighbors? Compare key performance metrics like average monthly revenue, ADR, and occupancy rates in surrounding areas to understand the broader regional STR landscape.
| Market | Active Properties | Monthly Revenue | Daily Rate | Avg. Occupancy |
|---|---|---|---|---|
| Sailfish Point | 19 | $16,709 | $1587.63 | 48% |
| Bal Harbour Village | 37 | $8,846 | $850.63 | 34% |
| Lake Clarke Shores | 26 | $6,710 | $516.52 | 46% |
| Lighthouse Point | 75 | $6,205 | $472.94 | 51% |
| Pinecrest | 11 | $6,117 | $861.24 | 43% |
| North Bay Village | 120 | $6,032 | $561.12 | 44% |
| Tequesta | 43 | $4,920 | $376.96 | 50% |
| Juno Beach | 39 | $4,807 | $377.00 | 47% |
| Parkland | 17 | $4,637 | $369.21 | 47% |
| Ocean Ridge | 14 | $4,588 | $602.78 | 48% |