Fort Lauderdale Airbnb Market Analysis 2026: Short Term Rental Data & Vacation Rental Statistics in Florida, United States
Is Airbnb profitable in Fort Lauderdale in 2026? Explore comprehensive Airbnb analytics for Fort Lauderdale, Florida, United States to uncover income potential. This 2026 STR market report for Fort Lauderdale, based on AirROI data from February 2025 to January 2026, reveals key trends in the bustling market of 3,562 active listings.
Whether you're considering an Airbnb investment in Fort Lauderdale, optimizing your existing vacation rental, or exploring rental arbitrage opportunities, understanding the Fort Lauderdale Airbnb data is crucial. Leveraging the low regulation environment is key to maximizing your short term rental income potential. Let's dive into the specifics.
Key Fort Lauderdale Airbnb Performance Metrics Overview
Monthly Airbnb Revenue Variations & Income Potential in Fort Lauderdale (2026)
Understanding the monthly revenue variations for Airbnb listings in Fort Lauderdale is key to maximizing your short term rental income potential. Seasonality significantly impacts earnings. Our analysis, based on data from the past 12 months, shows that the peak revenue month for STRs in Fort Lauderdale is typically March, while September often presents the lowest earnings, highlighting opportunities for strategic pricing adjustments during shoulder and low seasons. Explore the typical Airbnb income in Fort Lauderdale across different performance tiers:
- Best-in-class properties (Top 10%) achieve $11,586+ monthly, often utilizing dynamic pricing and superior guest experiences.
- Strong performing properties (Top 25%) earn $6,426 or more, indicating effective management and desirable locations/amenities.
- Typical properties (Median) generate around $3,404 per month, representing the average market performance.
- Entry-level properties (Bottom 25%) see earnings around $1,734, often with potential for optimization.
Average Monthly Airbnb Earnings Trend in Fort Lauderdale
Fort Lauderdale Airbnb Occupancy Rate Trends (2026)
Maximize your bookings by understanding the Fort Lauderdale STR occupancy trends. Seasonal demand shifts significantly influence how often properties are booked. Typically, Marchsees the highest demand (peak season occupancy), while September experiences the lowest (low season). Effective strategies, like adjusting minimum stays or offering promotions, can boost occupancy during slower periods. Here's how different property tiers perform in Fort Lauderdale:
- Best-in-class properties (Top 10%) achieve 86%+ occupancy, indicating high desirability and potentially optimized availability.
- Strong performing properties (Top 25%) maintain 72% or higher occupancy, suggesting good market fit and guest satisfaction.
- Typical properties (Median) have an occupancy rate around 51%.
- Entry-level properties (Bottom 25%) average 28% occupancy, potentially facing higher vacancy.
Average Monthly Occupancy Rate Trend in Fort Lauderdale
Average Daily Rate (ADR) Airbnb Trends in Fort Lauderdale (2026)
Effective short term rental pricing strategy in Fort Lauderdale involves understanding monthly ADR fluctuations. The Average Daily Rate (ADR) for Airbnb in Fort Lauderdale typically peaks in December and dips lowest during August. Leveraging Airbnb dynamic pricing tools or strategies based on this seasonality can significantly boost revenue. Here's a look at the typical nightly rates achieved:
- Best-in-class properties (Top 10%) command rates of $672+ per night, often due to premium features or locations.
- Strong performing properties (Top 25%) achieve nightly rates of $390 or more.
- Typical properties (Median) charge around $225 per night.
- Entry-level properties (Bottom 25%) earn around $146 per night.
Average Daily Rate (ADR) Trend by Month in Fort Lauderdale
Get Live Fort Lauderdale Market Intelligence 👇

Explore Real-time Analytics
Airbnb Seasonality Analysis & Trends in Fort Lauderdale (2026)
Peak Season (March, February, December)
- Revenue averages $7,180 per month
- Occupancy rates average 60.2%
- Daily rates average $384
Shoulder Season
- Revenue averages $5,051 per month
- Occupancy maintains around 48.3%
- Daily rates hold near $339
Low Season (August, September, October)
- Revenue drops to average $4,010 per month
- Occupancy decreases to average 43.3%
- Daily rates adjust to average $316
Seasonality Insights for Fort Lauderdale
- The Airbnb seasonality in Fort Lauderdale shows highly seasonal trends requiring careful strategy. While the sections above show seasonal averages, it's also insightful to look at the extremes:
- During the high season, the absolute peak month showcases Fort Lauderdale's highest earning potential, with monthly revenues capable of climbing to $8,136, occupancy reaching a high of 67.5%, and ADRs peaking at $405.
- Conversely, the slowest single month of the year, typically falling within the low season, marks the market's lowest point. In this month, revenue might dip to $3,350, occupancy could drop to 39.9%, and ADRs may adjust down to $302.
- Understanding both the seasonal averages and these monthly peaks and troughs in revenue, occupancy, and ADR is crucial for maximizing your Airbnb profit potential in Fort Lauderdale.
Seasonal Strategies for Maximizing Profit
- Peak Season: Maximize revenue through premium pricing and potentially longer minimum stays. Ensure high availability.
- Low Season: Offer competitive pricing, special promotions (e.g., extended stay discounts), and flexible cancellation policies. Target off-season travelers like remote workers or budget-conscious guests.
- Shoulder Seasons: Implement dynamic pricing that balances peak and low rates. Target weekend travelers or specific events. Offer slightly more flexible terms than peak season.
- Regularly analyze your own performance against these Fort Lauderdale seasonality benchmarks and adjust your pricing and availability strategy accordingly.
Best Areas for Airbnb Investment in Fort Lauderdale (2026)
Exploring the top neighborhoods for short-term rentals in Fort Lauderdale? This section highlights key areas, outlining why they are attractive for hosts and guests, along with notable local attractions. Consider these locations based on your target guest profile and investment strategy.
| Neighborhood / Area | Why Host Here? (Target Guests & Appeal) | Key Attractions & Landmarks |
|---|---|---|
| Las Olas Boulevard | A famous strip known for its shopping, dining, and nightlife. Las Olas Boulevard is a prime destination for visitors looking for an upscale experience with a taste of local culture and entertainment. | Las Olas Riverfront, Stranahan House, Broward Center for the Performing Arts, Fort Lauderdale Beach, Art galleries |
| Fort Lauderdale Beach | A popular tourist destination with beautiful sandy beaches and a vibrant atmosphere. This area appeals to sun-seekers and beach lovers, making it a lucrative spot for short-term rentals. | Fort Lauderdale Beach Park, Bonnet House Museum & Gardens, International Swimming Hall of Fame, Elbo Room, Hugh Taylor Birch State Park |
| Victoria Park | A charming residential neighborhood with a mix of historic and modern homes. It's close to the beach and is known for a quieter, local vibe, appealing to families and couples. | Victoria Park, Holiday Park, Shops at Wilton Manors, George English Park, Nearby beaches |
| Wilton Manors | A vibrant community known for its nightlife and LGBTQ+ friendly environment. It attracts visitors looking for entertainment and a welcoming atmosphere, making it a strategic area for Airbnb hosting. | Wilton Drive, Equality Park, BARS and Restaurants, Art and Culture Events, Nearby beaches |
| The Galleria at Fort Lauderdale | An upscale shopping mall area that attracts both tourists and locals. Hosting Airbnb here can tap into visitors looking to enjoy shopping and dining during their stay. | The Galleria Mall, Restaurants and cafes, Luxury boutiques, Nearby beaches, Art museums |
| Port Everglades | A key cruise port with a steady influx of visitors. Investing in Airbnb properties here can serve cruise passengers as they seek accommodations before and after their cruises. | Port Everglades, Broward Convention Center, Nearby beaches, Cruise terminals |
| Lauderdale-by-the-Sea | A charming beach town known for its small-town feel, beautiful beaches, and diving opportunities. It's popular for visitors looking for relaxation and beach activities. | Lauderdale-by-the-Sea Beach, Anglin's Fishing Pier, Coral reefs, Local restaurants, Parks |
| East Las Olas | A trendy area with unique shops, restaurants, and art galleries. It's an appealing location for visitors who want to experience a mix of urban culture and leisure. | Las Olas Beach, Art galleries, Cafes and restaurants, Shopping boutiques, Cultural events |
Understanding Airbnb License Requirements & STR Laws in Fort Lauderdale (2026)
While Fort Lauderdale, Florida, United States currently shows low STR regulations, specific Airbnb license requirements might still exist or change. Always verify the latest short term rental regulations and Airbnb license requirements directly with local government authorities for Fort Lauderdale to ensure full compliance before hosting.
(Source: AirROI data, 2026, based on 0% licensed listings)
Top Performing Airbnb Properties in Fort Lauderdale (2026)
Benchmark your potential! Explore examples of top-performing Airbnb properties in Fort Lauderdalebased on Trailing Twelve Month (TTM) revenue. Analyze their characteristics, revenue, occupancy rate, and ADR to understand what drives success in this market.
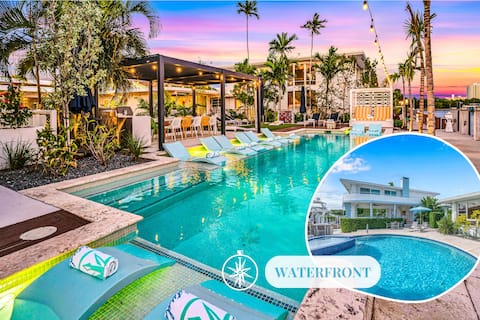
Waterfront Compound | 2 Heated Pools | 8 Kitchens
Entire Place • 13 bedrooms

Tropical Waterfront 7 Bedroom House in Seven Isles
Entire Place • 7 bedrooms

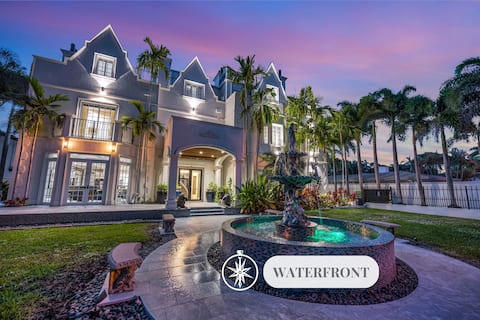
Park Place Mansion
Entire Place • 6 bedrooms
Waterfront | The Modern Castle
Entire Place • 8 bedrooms

Oceanfront Dream Beach House
Entire Place • 6 bedrooms

Spa+Heated Pool Waterfront, Steps to the Beach
Entire Place • 9 bedrooms
Note: Performance varies based on location, size, amenities, seasonality, and management quality. Data reflects the past 12 months.
Top Performing Airbnb Hosts in Fort Lauderdale (2026)
Learn from the best! This table showcases top-performing Airbnb hosts in Fort Lauderdale based on the number of properties managed and estimated total revenue over the past year. Analyze their scale and performance metrics.
| Host Name | Properties | Grossing Revenue | Stay Reviews | Avg Rating |
|---|---|---|---|---|
| Latitude Key | 68 | $12,710,951 | 2061 | 4.92/5.0 |
| BG Luxe Properties | 44 | $3,930,195 | 2061 | 4.86/5.0 |
| Matthew | 72 | $2,375,016 | 13307 | 4.92/5.0 |
| Grimaldi Vacation Rentals | 35 | $2,038,481 | 1682 | 4.78/5.0 |
| Gaby | 46 | $1,981,440 | 7109 | 4.72/5.0 |
| Jordan And Emily | 34 | $1,951,488 | 1541 | 4.68/5.0 |
| David | 16 | $1,717,894 | 524 | 4.99/5.0 |
| Cordova | 63 | $1,595,793 | 913 | 4.86/5.0 |
| Todd | 14 | $1,571,700 | 874 | 4.89/5.0 |
| Nicholette | 16 | $1,214,324 | 1053 | 4.77/5.0 |
Analyzing the strategies of top hosts, such as their property selection, pricing, and guest communication, can offer valuable lessons for optimizing your own Airbnb operations in Fort Lauderdale.
Dive Deeper: Advanced Fort Lauderdale STR Market Data (2026)
Ready to unlock more insights? AirROI provides access to advanced metrics and comprehensive Airbnb data for Fort Lauderdale. Explore detailed analytics beyond this report to refine your investment strategy, optimize pricing, and maximize your vacation rental profits.
Explore Advanced MetricsFort Lauderdale Short-Term Rental Market Composition (2026): Property & Room Types
Room Type Distribution
Property Type Distribution
Market Composition Insights for Fort Lauderdale
- The Fort Lauderdale Airbnb market composition is heavily skewed towards Entire Home/Apt listings, which make up 92% of the 3,562 active rentals. This indicates strong guest preference for privacy and space.
- Looking at the property type distribution in Fort Lauderdale, Apartment/Condo properties are the most common (47.6%), reflecting the local real estate landscape.
- Houses represent a significant 45.1% portion, catering likely to families or larger groups.
- Smaller segments like hotel/boutique, others, outdoor/unique, unique stays (combined 7.3%) offer potential for unique stay experiences.
Fort Lauderdale Airbnb Room Capacity Analysis (2026): Bedroom Distribution
Distribution of Listings by Number of Bedrooms
Room Capacity Insights for Fort Lauderdale
- The dominant room capacity in Fort Lauderdale is 1 bedroom listings, making up 35.7% of the market. This suggests a strong demand for properties suitable for couples or solo travelers.
- Together, 1 bedroom and 2 bedrooms properties represent 58.8% of the active Airbnb listings in Fort Lauderdale, indicating a high concentration in these sizes.
- A significant 30.2% of listings offer 3+ bedrooms, catering to larger groups and families seeking more space in Fort Lauderdale.
Fort Lauderdale Vacation Rental Guest Capacity Trends (2026)
Distribution of Listings by Guest Capacity
Guest Capacity Insights for Fort Lauderdale
- The most common guest capacity trend in Fort Lauderdale vacation rentals is listings accommodating 4 guests (24.9%). This suggests the primary traveler segment is likely small families or groups.
- Properties designed for 4 guests and 8+ guests dominate the Fort Lauderdale STR market, accounting for 47.6% of listings.
- 40.0% of properties accommodate 6+ guests, serving the market segment for larger families or group travel in Fort Lauderdale.
- On average, properties in Fort Lauderdale are equipped to host 4.7 guests.
Fort Lauderdale Airbnb Booking Patterns (2026): Available vs. Booked Days
Available Days Distribution
Booked Days Distribution
Booking Pattern Insights for Fort Lauderdale
- The most common availability pattern in Fort Lauderdale falls within the 271-366 days range, representing 34.6% of listings. This suggests many properties have significant open periods on their calendars.
- Approximately 68.0% of listings show high availability (181+ days open annually), indicating potential for increased bookings or specific owner usage patterns.
- For booked days, the 91-180 days range is most frequent in Fort Lauderdale (33.5%), reflecting common guest stay durations or potential owner blocking patterns.
- A notable 33.4% of properties secure long booking periods (181+ days booked per year), highlighting successful long-term rental strategies or significant owner usage.
Fort Lauderdale Airbnb Minimum Stay Requirements Analysis
Distribution of Listings by Minimum Night Requirement
1 Night
803 listings
22.6% of total
2 Nights
671 listings
18.9% of total
3 Nights
298 listings
8.4% of total
4-6 Nights
227 listings
6.4% of total
7-29 Nights
144 listings
4% of total
30+ Nights
1416 listings
39.8% of total
Key Insights
- The most prevalent minimum stay requirement in Fort Lauderdale is 30+ Nights, adopted by 39.8% of listings. This highlights the market's preference for longer commitments.
- A significant segment (39.8%) caters to monthly stays (30+ nights) in Fort Lauderdale, pointing to opportunities in the extended-stay market.
Recommendations
- Align with the market by considering a 30+ Nights minimum stay, as 39.8% of Fort Lauderdale hosts use this setting.
- If feasible, allowing 1-night stays, especially midweek or during low season, could capture last-minute bookings, as only 22.6% currently do.
- Explore offering discounts for stays of 30+ nights to attract the 39.8% of the market seeking extended stays.
- Adjust minimum nights based on seasonality – potentially shorter during low season and longer during peak demand periods in Fort Lauderdale.
Fort Lauderdale Airbnb Cancellation Policy Trends Analysis (2026)
Super Strict 30 Days
126 listings
3.6% of total
Super Strict 60 Days
114 listings
3.2% of total
Limited
107 listings
3% of total
Flexible
549 listings
15.5% of total
Moderate
833 listings
23.6% of total
Firm
1230 listings
34.8% of total
Strict
578 listings
16.3% of total
Cancellation Policy Insights for Fort Lauderdale
- The prevailing Airbnb cancellation policy trend in Fort Lauderdale is Firm, used by 34.8% of listings.
- A majority (51.1%) of hosts in Fort Lauderdale utilize Firm or Strict policies, indicating a market where hosts prioritize booking security.
Recommendations for Hosts
- Consider adopting a Firm policy to align with the 34.8% market standard in Fort Lauderdale.
- Regularly review your cancellation policy against competitors and market demand shifts in Fort Lauderdale.
Fort Lauderdale STR Booking Lead Time Analysis (2026)
Average Booking Lead Time by Month
Booking Lead Time Insights for Fort Lauderdale
- The overall average booking lead time for vacation rentals in Fort Lauderdale is 39 days.
- Guests book furthest in advance for stays during January (average 50 days), likely coinciding with peak travel demand or local events.
- The shortest booking windows occur for stays in September (average 28 days), indicating more last-minute travel plans during this time.
- Seasonally, Winter (48 days avg.) sees the longest lead times, while Summer (31 days avg.) has the shortest, reflecting typical travel planning cycles.
Recommendations for Hosts
- Use the overall average lead time (39 days) as a baseline for your pricing and availability strategy in Fort Lauderdale.
- For January stays, consider implementing length-of-stay discounts or slightly higher rates for bookings made less than 50 days out to capitalize on advance planning.
- Target marketing efforts for the Winter season well in advance (at least 48 days) to capture early planners.
- Monitor your own booking lead times against these Fort Lauderdale averages to identify opportunities for dynamic pricing adjustments.
Popular & Essential Airbnb Amenities in Fort Lauderdale (2026)
Amenity Prevalence
Amenity Insights for Fort Lauderdale
- Essential amenities in Fort Lauderdale that guests expect include: Air conditioning, Wifi, TV, Smoke alarm. Lacking these (any) could significantly impact bookings.
- Popular amenities like Coffee maker, Kitchen, Hair dryer are common but not universal. Offering these can provide a competitive edge.
Recommendations for Hosts
- Ensure your listing includes all essential amenities for Fort Lauderdale: Air conditioning, Wifi, TV, Smoke alarm.
- Prioritize adding missing essentials: Air conditioning, Wifi, TV, Smoke alarm.
- Consider adding popular differentiators like Coffee maker or Kitchen to increase appeal.
- Highlight unique or less common amenities you offer (e.g., hot tub, dedicated workspace, EV charger) in your listing description and photos.
- Regularly check competitor amenities in Fort Lauderdale to stay competitive.
Fort Lauderdale Airbnb Guest Demographics & Profile Analysis (2026)
Guest Profile Summary for Fort Lauderdale
- The typical guest profile for Airbnb in Fort Lauderdale consists of primarily domestic travelers (84%), often arriving from nearby New York, typically belonging to the Post-2000s (Gen Z/Alpha) group (50%), primarily speaking English or Spanish.
- Domestic travelers account for 84.2% of guests.
- Key international markets include United States (84.2%) and Canada (4.4%).
- Top languages spoken are English (64.1%) followed by Spanish (17.1%).
- A significant demographic segment is the Post-2000s (Gen Z/Alpha) group, representing 50% of guests.
Recommendations for Hosts
- Target domestic marketing efforts towards travelers from New York and Fort Lauderdale.
- Tailor amenities and listing descriptions to appeal to the dominant Post-2000s (Gen Z/Alpha) demographic (e.g., highlight fast WiFi, smart home features, local guides).
- Highlight unique local experiences or amenities relevant to the primary guest profile.
- Consider seasonal promotions aligned with peak travel times for key origin markets.
Nearby Short-Term Rental Market Comparison
How does the Fort Lauderdale Airbnb market stack up against its neighbors? Compare key performance metrics like average monthly revenue, ADR, and occupancy rates in surrounding areas to understand the broader regional STR landscape.
| Market | Active Properties | Monthly Revenue | Daily Rate | Avg. Occupancy |
|---|---|---|---|---|
| Sailfish Point | 19 | $16,709 | $1587.63 | 48% |
| Bal Harbour Village | 37 | $8,846 | $850.63 | 34% |
| Lake Clarke Shores | 26 | $6,710 | $516.52 | 46% |
| Lighthouse Point | 75 | $6,205 | $472.94 | 51% |
| Pinecrest | 11 | $6,117 | $861.24 | 43% |
| North Bay Village | 120 | $6,032 | $561.12 | 44% |
| Tequesta | 43 | $4,920 | $376.96 | 50% |
| Juno Beach | 39 | $4,807 | $377.00 | 47% |
| Parkland | 17 | $4,637 | $369.21 | 47% |
| Ocean Ridge | 14 | $4,588 | $602.78 | 48% |