Flagler Beach Airbnb Market Analysis 2026: Short Term Rental Data & Vacation Rental Statistics in Florida, United States
Is Airbnb profitable in Flagler Beach in 2026? Explore comprehensive Airbnb analytics for Flagler Beach, Florida, United States to uncover income potential. This 2026 STR market report for Flagler Beach, based on AirROI data from February 2025 to January 2026, reveals key trends in the niche market of 197 active listings.
Whether you're considering an Airbnb investment in Flagler Beach, optimizing your existing vacation rental, or exploring rental arbitrage opportunities, understanding the Flagler Beach Airbnb data is crucial. Leveraging the low regulation environment is key to maximizing your short term rental income potential. Let's dive into the specifics.
Key Flagler Beach Airbnb Performance Metrics Overview
Monthly Airbnb Revenue Variations & Income Potential in Flagler Beach (2026)
Understanding the monthly revenue variations for Airbnb listings in Flagler Beach is key to maximizing your short term rental income potential. Seasonality significantly impacts earnings. Our analysis, based on data from the past 12 months, shows that the peak revenue month for STRs in Flagler Beach is typically March, while September often presents the lowest earnings, highlighting opportunities for strategic pricing adjustments during shoulder and low seasons. Explore the typical Airbnb income in Flagler Beach across different performance tiers:
- Best-in-class properties (Top 10%) achieve $9,693+ monthly, often utilizing dynamic pricing and superior guest experiences.
- Strong performing properties (Top 25%) earn $5,075 or more, indicating effective management and desirable locations/amenities.
- Typical properties (Median) generate around $2,822 per month, representing the average market performance.
- Entry-level properties (Bottom 25%) see earnings around $1,635, often with potential for optimization.
Average Monthly Airbnb Earnings Trend in Flagler Beach
Flagler Beach Airbnb Occupancy Rate Trends (2026)
Maximize your bookings by understanding the Flagler Beach STR occupancy trends. Seasonal demand shifts significantly influence how often properties are booked. Typically, Marchsees the highest demand (peak season occupancy), while October experiences the lowest (low season). Effective strategies, like adjusting minimum stays or offering promotions, can boost occupancy during slower periods. Here's how different property tiers perform in Flagler Beach:
- Best-in-class properties (Top 10%) achieve 76%+ occupancy, indicating high desirability and potentially optimized availability.
- Strong performing properties (Top 25%) maintain 60% or higher occupancy, suggesting good market fit and guest satisfaction.
- Typical properties (Median) have an occupancy rate around 42%.
- Entry-level properties (Bottom 25%) average 24% occupancy, potentially facing higher vacancy.
Average Monthly Occupancy Rate Trend in Flagler Beach
Average Daily Rate (ADR) Airbnb Trends in Flagler Beach (2026)
Effective short term rental pricing strategy in Flagler Beach involves understanding monthly ADR fluctuations. The Average Daily Rate (ADR) for Airbnb in Flagler Beach typically peaks in December and dips lowest during April. Leveraging Airbnb dynamic pricing tools or strategies based on this seasonality can significantly boost revenue. Here's a look at the typical nightly rates achieved:
- Best-in-class properties (Top 10%) command rates of $551+ per night, often due to premium features or locations.
- Strong performing properties (Top 25%) achieve nightly rates of $359 or more.
- Typical properties (Median) charge around $226 per night.
- Entry-level properties (Bottom 25%) earn around $173 per night.
Average Daily Rate (ADR) Trend by Month in Flagler Beach
Get Live Flagler Beach Market Intelligence 👇

Explore Real-time Analytics
Airbnb Seasonality Analysis & Trends in Flagler Beach (2026)
Peak Season (March, July, June)
- Revenue averages $5,601 per month
- Occupancy rates average 56.5%
- Daily rates average $303
Shoulder Season
- Revenue averages $3,908 per month
- Occupancy maintains around 42.2%
- Daily rates hold near $298
Low Season (September, October, November)
- Revenue drops to average $3,126 per month
- Occupancy decreases to average 31.9%
- Daily rates adjust to average $295
Seasonality Insights for Flagler Beach
- The Airbnb seasonality in Flagler Beach shows highly seasonal trends requiring careful strategy. While the sections above show seasonal averages, it's also insightful to look at the extremes:
- During the high season, the absolute peak month showcases Flagler Beach's highest earning potential, with monthly revenues capable of climbing to $6,203, occupancy reaching a high of 68.6%, and ADRs peaking at $325.
- Conversely, the slowest single month of the year, typically falling within the low season, marks the market's lowest point. In this month, revenue might dip to $2,774, occupancy could drop to 31.1%, and ADRs may adjust down to $278.
- Understanding both the seasonal averages and these monthly peaks and troughs in revenue, occupancy, and ADR is crucial for maximizing your Airbnb profit potential in Flagler Beach.
Seasonal Strategies for Maximizing Profit
- Peak Season: Maximize revenue through premium pricing and potentially longer minimum stays. Ensure high availability.
- Low Season: Offer competitive pricing, special promotions (e.g., extended stay discounts), and flexible cancellation policies. Target off-season travelers like remote workers or budget-conscious guests.
- Shoulder Seasons: Implement dynamic pricing that balances peak and low rates. Target weekend travelers or specific events. Offer slightly more flexible terms than peak season.
- Regularly analyze your own performance against these Flagler Beach seasonality benchmarks and adjust your pricing and availability strategy accordingly.
Best Areas for Airbnb Investment in Flagler Beach (2026)
Exploring the top neighborhoods for short-term rentals in Flagler Beach? This section highlights key areas, outlining why they are attractive for hosts and guests, along with notable local attractions. Consider these locations based on your target guest profile and investment strategy.
| Neighborhood / Area | Why Host Here? (Target Guests & Appeal) | Key Attractions & Landmarks |
|---|---|---|
| Flagler Beach Boardwalk | A popular destination with direct beach access, vibrant atmosphere, and close proximity to shops and restaurants. Ideal for visitors looking for a classic beach experience. | Flagler Beach Boardwalk, Flagler Beach Pier, Gamble Rogers Memorial State Recreation Area, Betty Steflik Preserve, local dining options |
| South Flagler Avenue | Known for its charming local shops, beachfront dining, and easy access to the beach. Attracts both tourists and locals looking for a relaxed beach town vibe. | The Golden Lion Cafe, Flagler Beach Farmers Market, local boutiques, beachfront parks |
| Ocean Shore Boulevard | Offers oceanfront properties with stunning views and easy access to the beach. A great choice for those wanting a quiet beach retreat with direct water access. | beachfront properties, local seafood restaurants, ocean views, access to water activities |
| Bulow Creek State Park | A beautiful natural area perfect for eco-tourism and nature lovers. Attracts visitors looking for outdoor activities and tranquility away from the beach crowds. | Bulow Creek State Park, hiking trails, kayaking, wildlife viewing |
| Highway A1A | The main scenic route along the coast, lined with beautiful beaches and small beach towns. A great area for those looking to explore the coastline. | scenic ocean views, beach access, local seafood dining, cycling routes |
| Washington Oaks Gardens State Park | Features beautiful gardens and natural shorelines, attracting visitors interested in nature and photography. Ideal for those who appreciate serene landscapes. | gardens, nature trails, historic buildings, beach access |
| Old Port Marina | A lively marina area with access to boating and fishing, appealing to water sports enthusiasts and families looking for fun activities on the water. | marina activities, boating and fishing, restaurants, waterfront views |
| Flagler Beach Fishing Pier | A hotspot for anglers and beachgoers, with a lively atmosphere and various recreational activities. A great location for those wanting to be in the heart of beach culture. | fishing pier, beach access, local events, great sunset views |
Understanding Airbnb License Requirements & STR Laws in Flagler Beach (2026)
While Flagler Beach, Florida, United States currently shows low STR regulations, specific Airbnb license requirements might still exist or change. Always verify the latest short term rental regulations and Airbnb license requirements directly with local government authorities for Flagler Beach to ensure full compliance before hosting.
(Source: AirROI data, 2026, finding no licensed listings among those analyzed)
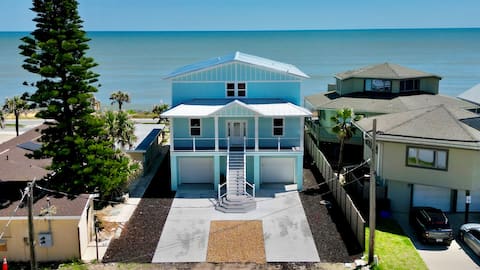
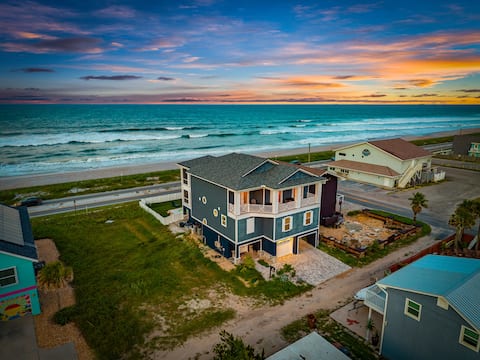
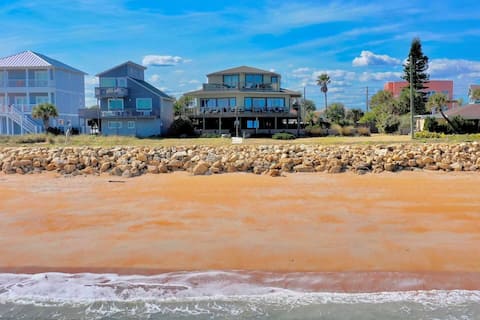
Top Performing Airbnb Properties in Flagler Beach (2026)
Benchmark your potential! Explore examples of top-performing Airbnb properties in Flagler Beachbased on Trailing Twelve Month (TTM) revenue. Analyze their characteristics, revenue, occupancy rate, and ADR to understand what drives success in this market.
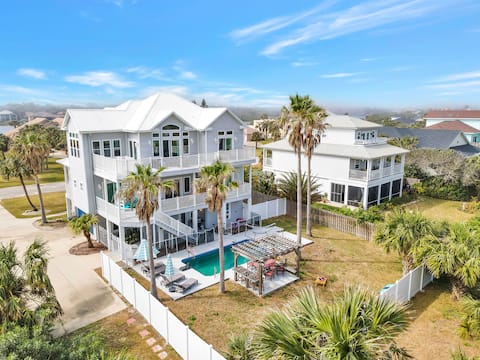
3-Story Beachfront Retreat | Heated Pool
Entire Place • 6 bedrooms
Beachfront retreat w views, games, hot tub & more!
Entire Place • 4 bedrooms
Beautiful Oceanfront home
Entire Place • 4 bedrooms
Chic Home: Ocean Views, Hot Tub & Game Room!
Entire Place • 4 bedrooms
Beachfront Paradise|Surfboards|Golf Cart for rent
Entire Place • 4 bedrooms

Coastal home w/ pool & boat slip
Entire Place • 4 bedrooms
Note: Performance varies based on location, size, amenities, seasonality, and management quality. Data reflects the past 12 months.
Top Performing Airbnb Hosts in Flagler Beach (2026)
Learn from the best! This table showcases top-performing Airbnb hosts in Flagler Beach based on the number of properties managed and estimated total revenue over the past year. Analyze their scale and performance metrics.
| Host Name | Properties | Grossing Revenue | Stay Reviews | Avg Rating |
|---|---|---|---|---|
| Rent & Relax Vacation Rentals | 13 | $677,560 | 109 | 4.90/5.0 |
| The Luxury Cohost | 4 | $560,046 | 89 | 4.84/5.0 |
| ITrip Vacations | 11 | $371,404 | 90 | 4.86/5.0 |
| Jeffrey | 2 | $343,825 | 114 | 4.96/5.0 |
| Landon + Evie | 3 | $299,655 | 135 | 4.99/5.0 |
| Melanie | 9 | $250,648 | 197 | 4.90/5.0 |
| Evolve | 6 | $226,454 | 95 | 4.74/5.0 |
| Ben | 2 | $195,846 | 39 | 4.98/5.0 |
| Tracy | 7 | $194,680 | 293 | 4.89/5.0 |
| Vacation Rentals Beach Propert | 6 | $184,541 | 21 | 4.58/5.0 |
Analyzing the strategies of top hosts, such as their property selection, pricing, and guest communication, can offer valuable lessons for optimizing your own Airbnb operations in Flagler Beach.
Dive Deeper: Advanced Flagler Beach STR Market Data (2026)
Ready to unlock more insights? AirROI provides access to advanced metrics and comprehensive Airbnb data for Flagler Beach. Explore detailed analytics beyond this report to refine your investment strategy, optimize pricing, and maximize your vacation rental profits.
Explore Advanced MetricsFlagler Beach Short-Term Rental Market Composition (2026): Property & Room Types
Room Type Distribution
Property Type Distribution
Market Composition Insights for Flagler Beach
- The Flagler Beach Airbnb market composition is heavily skewed towards Entire Home/Apt listings, which make up 96.4% of the 197 active rentals. This indicates strong guest preference for privacy and space.
- Looking at the property type distribution in Flagler Beach, House properties are the most common (48.2%), reflecting the local real estate landscape.
- Houses represent a significant 48.2% portion, catering likely to families or larger groups.
- Smaller segments like hotel/boutique, others, outdoor/unique (combined 7.1%) offer potential for unique stay experiences.
Flagler Beach Airbnb Room Capacity Analysis (2026): Bedroom Distribution
Distribution of Listings by Number of Bedrooms
Room Capacity Insights for Flagler Beach
- The dominant room capacity in Flagler Beach is 1 bedroom listings, making up 33.5% of the market. This suggests a strong demand for properties suitable for couples or solo travelers.
- Together, 1 bedroom and 2 bedrooms properties represent 67.0% of the active Airbnb listings in Flagler Beach, indicating a high concentration in these sizes.
- A significant 32.1% of listings offer 3+ bedrooms, catering to larger groups and families seeking more space in Flagler Beach.
Flagler Beach Vacation Rental Guest Capacity Trends (2026)
Distribution of Listings by Guest Capacity
Guest Capacity Insights for Flagler Beach
- The most common guest capacity trend in Flagler Beach vacation rentals is listings accommodating 4 guests (31.5%). This suggests the primary traveler segment is likely small families or groups.
- Properties designed for 4 guests and 8+ guests dominate the Flagler Beach STR market, accounting for 58.9% of listings.
- 49.7% of properties accommodate 6+ guests, serving the market segment for larger families or group travel in Flagler Beach.
- On average, properties in Flagler Beach are equipped to host 5.3 guests.
Flagler Beach Airbnb Booking Patterns (2026): Available vs. Booked Days
Available Days Distribution
Booked Days Distribution
Booking Pattern Insights for Flagler Beach
- The most common availability pattern in Flagler Beach falls within the 271-366 days range, representing 43.1% of listings. This suggests many properties have significant open periods on their calendars.
- Approximately 80.7% of listings show high availability (181+ days open annually), indicating potential for increased bookings or specific owner usage patterns.
- For booked days, the 91-180 days range is most frequent in Flagler Beach (37.1%), reflecting common guest stay durations or potential owner blocking patterns.
- A notable 20.8% of properties secure long booking periods (181+ days booked per year), highlighting successful long-term rental strategies or significant owner usage.
Flagler Beach Airbnb Minimum Stay Requirements Analysis
Distribution of Listings by Minimum Night Requirement
1 Night
10 listings
5.1% of total
2 Nights
36 listings
18.3% of total
3 Nights
32 listings
16.2% of total
4-6 Nights
21 listings
10.7% of total
7-29 Nights
17 listings
8.6% of total
30+ Nights
81 listings
41.1% of total
Key Insights
- The most prevalent minimum stay requirement in Flagler Beach is 30+ Nights, adopted by 41.1% of listings. This highlights the market's preference for longer commitments.
- A significant segment (41.1%) caters to monthly stays (30+ nights) in Flagler Beach, pointing to opportunities in the extended-stay market.
Recommendations
- Align with the market by considering a 30+ Nights minimum stay, as 41.1% of Flagler Beach hosts use this setting.
- If feasible, allowing 1-night stays, especially midweek or during low season, could capture last-minute bookings, as only 5.1% currently do.
- Explore offering discounts for stays of 30+ nights to attract the 41.1% of the market seeking extended stays.
- Adjust minimum nights based on seasonality – potentially shorter during low season and longer during peak demand periods in Flagler Beach.
Flagler Beach Airbnb Cancellation Policy Trends Analysis (2026)
Super Strict 60 Days
3 listings
1.5% of total
Super Strict 30 Days
4 listings
2% of total
Limited
16 listings
8.1% of total
Flexible
26 listings
13.2% of total
Moderate
36 listings
18.3% of total
Firm
75 listings
38.1% of total
Strict
37 listings
18.8% of total
Cancellation Policy Insights for Flagler Beach
- The prevailing Airbnb cancellation policy trend in Flagler Beach is Firm, used by 38.1% of listings.
- A majority (56.9%) of hosts in Flagler Beach utilize Firm or Strict policies, indicating a market where hosts prioritize booking security.
Recommendations for Hosts
- Consider adopting a Firm policy to align with the 38.1% market standard in Flagler Beach.
- Regularly review your cancellation policy against competitors and market demand shifts in Flagler Beach.
Flagler Beach STR Booking Lead Time Analysis (2026)
Average Booking Lead Time by Month
Booking Lead Time Insights for Flagler Beach
- The overall average booking lead time for vacation rentals in Flagler Beach is 64 days.
- Guests book furthest in advance for stays during February (average 107 days), likely coinciding with peak travel demand or local events.
- The shortest booking windows occur for stays in September (average 46 days), indicating more last-minute travel plans during this time.
- Seasonally, Winter (85 days avg.) sees the longest lead times, while Fall (56 days avg.) has the shortest, reflecting typical travel planning cycles.
Recommendations for Hosts
- Use the overall average lead time (64 days) as a baseline for your pricing and availability strategy in Flagler Beach.
- For February stays, consider implementing length-of-stay discounts or slightly higher rates for bookings made less than 107 days out to capitalize on advance planning.
- Target marketing efforts for the Winter season well in advance (at least 85 days) to capture early planners.
- Monitor your own booking lead times against these Flagler Beach averages to identify opportunities for dynamic pricing adjustments.
Popular & Essential Airbnb Amenities in Flagler Beach (2026)
Amenity Prevalence
Amenity Insights for Flagler Beach
- Essential amenities in Flagler Beach that guests expect include: Wifi, TV, Air conditioning, Smoke alarm, Fire extinguisher, Coffee maker. Lacking these (any) could significantly impact bookings.
- Popular amenities like Free parking on premises, Hot water, Heating are common but not universal. Offering these can provide a competitive edge.
Recommendations for Hosts
- Ensure your listing includes all essential amenities for Flagler Beach: Wifi, TV, Air conditioning, Smoke alarm, Fire extinguisher, Coffee maker.
- Prioritize adding missing essentials: Fire extinguisher, Coffee maker.
- Consider adding popular differentiators like Free parking on premises or Hot water to increase appeal.
- Highlight unique or less common amenities you offer (e.g., hot tub, dedicated workspace, EV charger) in your listing description and photos.
- Regularly check competitor amenities in Flagler Beach to stay competitive.
Flagler Beach Airbnb Guest Demographics & Profile Analysis (2026)
Guest Profile Summary for Flagler Beach
- The typical guest profile for Airbnb in Flagler Beach consists of primarily domestic travelers (97%), often arriving from nearby Jacksonville, typically belonging to the Post-2000s (Gen Z/Alpha) group (50%), primarily speaking English or Spanish.
- Domestic travelers account for 97.4% of guests.
- Key international markets include United States (97.4%) and Canada (0.8%).
- Top languages spoken are English (77.7%) followed by Spanish (12.4%).
- A significant demographic segment is the Post-2000s (Gen Z/Alpha) group, representing 50% of guests.
Recommendations for Hosts
- Target domestic marketing efforts towards travelers from Jacksonville and Gainesville.
- Tailor amenities and listing descriptions to appeal to the dominant Post-2000s (Gen Z/Alpha) demographic (e.g., highlight fast WiFi, smart home features, local guides).
- Highlight unique local experiences or amenities relevant to the primary guest profile.
- Consider seasonal promotions aligned with peak travel times for key origin markets.
Nearby Short-Term Rental Market Comparison
How does the Flagler Beach Airbnb market stack up against its neighbors? Compare key performance metrics like average monthly revenue, ADR, and occupancy rates in surrounding areas to understand the broader regional STR landscape.
| Market | Active Properties | Monthly Revenue | Daily Rate | Avg. Occupancy |
|---|---|---|---|---|
| St. Johns County | 12 | $6,964 | $592.43 | 47% |
| Reunion | 12 | $6,321 | $580.45 | 44% |
| Ponte Vedra Beach | 224 | $5,720 | $574.75 | 43% |
| Vilano Beach | 173 | $5,571 | $442.95 | 45% |
| Melbourne Beach | 275 | $5,384 | $488.83 | 43% |
| Thonotosassa | 17 | $4,309 | $347.75 | 50% |
| Jacksonville Beach | 763 | $4,123 | $328.32 | 49% |
| Campbell | 22 | $4,011 | $343.05 | 51% |
| Indian Harbour Beach | 131 | $3,895 | $289.71 | 50% |
| Cocoa Beach | 983 | $3,883 | $307.17 | 48% |