Fernandina Beach Airbnb Market Analysis 2026: Short Term Rental Data & Vacation Rental Statistics in Florida, United States
Is Airbnb profitable in Fernandina Beach in 2026? Explore comprehensive Airbnb analytics for Fernandina Beach, Florida, United States to uncover income potential. This 2026 STR market report for Fernandina Beach, based on AirROI data from February 2025 to January 2026, reveals key trends in the market of 969 active listings.
Whether you're considering an Airbnb investment in Fernandina Beach, optimizing your existing vacation rental, or exploring rental arbitrage opportunities, understanding the Fernandina Beach Airbnb data is crucial. Leveraging the low regulation environment is key to maximizing your short term rental income potential. Let's dive into the specifics.
Key Fernandina Beach Airbnb Performance Metrics Overview
Monthly Airbnb Revenue Variations & Income Potential in Fernandina Beach (2026)
Understanding the monthly revenue variations for Airbnb listings in Fernandina Beach is key to maximizing your short term rental income potential. Seasonality significantly impacts earnings. Our analysis, based on data from the past 12 months, shows that the peak revenue month for STRs in Fernandina Beach is typically July, while January often presents the lowest earnings, highlighting opportunities for strategic pricing adjustments during shoulder and low seasons. Explore the typical Airbnb income in Fernandina Beach across different performance tiers:
- Best-in-class properties (Top 10%) achieve $9,785+ monthly, often utilizing dynamic pricing and superior guest experiences.
- Strong performing properties (Top 25%) earn $6,521 or more, indicating effective management and desirable locations/amenities.
- Typical properties (Median) generate around $4,052 per month, representing the average market performance.
- Entry-level properties (Bottom 25%) see earnings around $2,110, often with potential for optimization.
Average Monthly Airbnb Earnings Trend in Fernandina Beach
Fernandina Beach Airbnb Occupancy Rate Trends (2026)
Maximize your bookings by understanding the Fernandina Beach STR occupancy trends. Seasonal demand shifts significantly influence how often properties are booked. Typically, Marchsees the highest demand (peak season occupancy), while January experiences the lowest (low season). Effective strategies, like adjusting minimum stays or offering promotions, can boost occupancy during slower periods. Here's how different property tiers perform in Fernandina Beach:
- Best-in-class properties (Top 10%) achieve 78%+ occupancy, indicating high desirability and potentially optimized availability.
- Strong performing properties (Top 25%) maintain 63% or higher occupancy, suggesting good market fit and guest satisfaction.
- Typical properties (Median) have an occupancy rate around 41%.
- Entry-level properties (Bottom 25%) average 21% occupancy, potentially facing higher vacancy.
Average Monthly Occupancy Rate Trend in Fernandina Beach
Average Daily Rate (ADR) Airbnb Trends in Fernandina Beach (2026)
Effective short term rental pricing strategy in Fernandina Beach involves understanding monthly ADR fluctuations. The Average Daily Rate (ADR) for Airbnb in Fernandina Beach typically peaks in June and dips lowest during February. Leveraging Airbnb dynamic pricing tools or strategies based on this seasonality can significantly boost revenue. Here's a look at the typical nightly rates achieved:
- Best-in-class properties (Top 10%) command rates of $695+ per night, often due to premium features or locations.
- Strong performing properties (Top 25%) achieve nightly rates of $482 or more.
- Typical properties (Median) charge around $340 per night.
- Entry-level properties (Bottom 25%) earn around $250 per night.
Average Daily Rate (ADR) Trend by Month in Fernandina Beach
Get Live Fernandina Beach Market Intelligence 👇

Explore Real-time Analytics
Airbnb Seasonality Analysis & Trends in Fernandina Beach (2026)
Peak Season (July, June, March)
- Revenue averages $6,905 per month
- Occupancy rates average 56.1%
- Daily rates average $443
Shoulder Season
- Revenue averages $4,798 per month
- Occupancy maintains around 42.9%
- Daily rates hold near $403
Low Season (January, November, December)
- Revenue drops to average $3,515 per month
- Occupancy decreases to average 29.1%
- Daily rates adjust to average $406
Seasonality Insights for Fernandina Beach
- The Airbnb seasonality in Fernandina Beach shows highly seasonal trends requiring careful strategy. While the sections above show seasonal averages, it's also insightful to look at the extremes:
- During the high season, the absolute peak month showcases Fernandina Beach's highest earning potential, with monthly revenues capable of climbing to $7,252, occupancy reaching a high of 58.4%, and ADRs peaking at $460.
- Conversely, the slowest single month of the year, typically falling within the low season, marks the market's lowest point. In this month, revenue might dip to $3,043, occupancy could drop to 26.1%, and ADRs may adjust down to $388.
- Understanding both the seasonal averages and these monthly peaks and troughs in revenue, occupancy, and ADR is crucial for maximizing your Airbnb profit potential in Fernandina Beach.
Seasonal Strategies for Maximizing Profit
- Peak Season: Maximize revenue through premium pricing and potentially longer minimum stays. Ensure high availability.
- Low Season: Offer competitive pricing, special promotions (e.g., extended stay discounts), and flexible cancellation policies. Target off-season travelers like remote workers or budget-conscious guests.
- Shoulder Seasons: Implement dynamic pricing that balances peak and low rates. Target weekend travelers or specific events. Offer slightly more flexible terms than peak season.
- Regularly analyze your own performance against these Fernandina Beach seasonality benchmarks and adjust your pricing and availability strategy accordingly.
Best Areas for Airbnb Investment in Fernandina Beach (2026)
Exploring the top neighborhoods for short-term rentals in Fernandina Beach? This section highlights key areas, outlining why they are attractive for hosts and guests, along with notable local attractions. Consider these locations based on your target guest profile and investment strategy.
| Neighborhood / Area | Why Host Here? (Target Guests & Appeal) | Key Attractions & Landmarks |
|---|---|---|
| Historic District | Charming area with preserved 19th-century architecture, close to shops, restaurants, and attractions. Ideal for guests wanting a local experience rich in history. | Fernandina Beach Historic District, Amelia Island Museum of History, Palmetto Walk Shopping Village, The Palace Saloon, Amelia Island Lighthouse |
| Amelia Island State Park | A beautiful natural area offering a wide range of outdoor activities including hiking, biking, and fishing. Perfect for guests who enjoy nature and outdoor adventures. | Amelia Island State Park, Tennis courts, Nature trails, Fishing spots, Wildlife viewing areas |
| Main Beach | The main beach area is popular with families and sun-seekers, offering soft sand, beach access, and family-friendly amenities. Great for those looking for a beach vacation. | Fernandina Beach Main Beach Park, Beach access, Picnic areas, Playgrounds, Water sports rentals |
| Fort Clinch State Park | A historic state park with a well-preserved Civil War era fort and beautiful beach areas. Attracts history buffs and nature lovers alike. | Fort Clinch State Park, Historic Fort Clinch, Nature trails, Fishing areas, Atlantic Ocean beach access |
| Overseas Highway | Famous for its stunning ocean views and proximity to various restaurants and shops. A prime route for tourists looking to explore the coastline. | Views of the Atlantic Ocean, Local seafood restaurants, Shell collecting areas, Scenic bike paths, Shopping centers |
| Amelia Island Plantation | A luxurious resort area with golf courses, spas, and pristine beaches. Ideal for guests looking for a high-end vacation experience. | Amelia Island Plantation, Golf courses, Luxury spas, Fine dining, Private beach access |
| Egans Creek Park | A natural preserve with walking trails and wildlife watching opportunities. Appeals to eco-tourists and families looking for outdoor activities. | Egans Creek Greenway, Nature trails, Wildlife observation areas, Picnic spots, Biking paths |
| Ybor City | Although slightly outside Fernandina Beach, it's known for its rich cultural heritage and nightlife. Attracts visitors interested in local culture and history. | Ybor City Historic District, Cultural festivals, Cigar shops, Nightlife and dining, Art galleries |
Understanding Airbnb License Requirements & STR Laws in Fernandina Beach (2026)
While Fernandina Beach, Florida, United States currently shows low STR regulations, specific Airbnb license requirements might still exist or change. Always verify the latest short term rental regulations and Airbnb license requirements directly with local government authorities for Fernandina Beach to ensure full compliance before hosting.
(Source: AirROI data, 2026, finding no licensed listings among those analyzed)
Top Performing Airbnb Properties in Fernandina Beach (2026)
Benchmark your potential! Explore examples of top-performing Airbnb properties in Fernandina Beachbased on Trailing Twelve Month (TTM) revenue. Analyze their characteristics, revenue, occupancy rate, and ADR to understand what drives success in this market.

Ebb Tide Cottage | Huge Oceanfront Deck | Hot Tub
Entire Place • 4 bedrooms
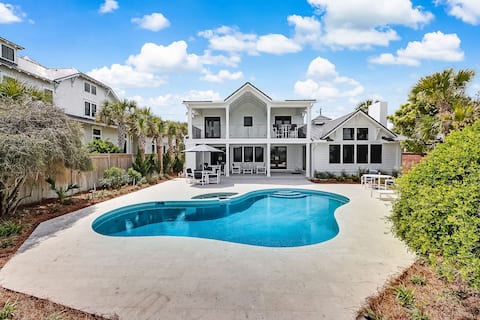
Amelia Island Private Home with Pool 4 BR
Entire Place • 4 bedrooms

Dog Friendly! Sleeps 21
Entire Place • 7 bedrooms
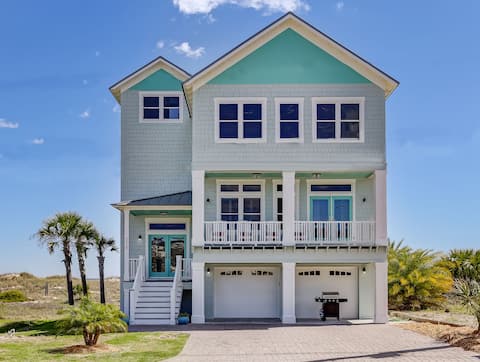
Mermaid Castle | Stunning Beachfront Home
Entire Place • 4 bedrooms
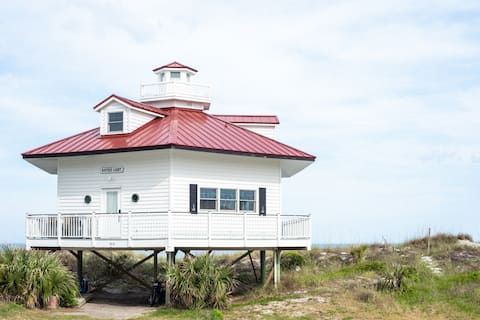
Private Beachfront Lighthouse Just Steps to Ocean
Entire Place • 3 bedrooms

161 S Fletcher
Entire Place • 4 bedrooms
Note: Performance varies based on location, size, amenities, seasonality, and management quality. Data reflects the past 12 months.
Top Performing Airbnb Hosts in Fernandina Beach (2026)
Learn from the best! This table showcases top-performing Airbnb hosts in Fernandina Beach based on the number of properties managed and estimated total revenue over the past year. Analyze their scale and performance metrics.
| Host Name | Properties | Grossing Revenue | Stay Reviews | Avg Rating |
|---|---|---|---|---|
| Stay Better Vacations | 99 | $4,106,839 | 2434 | 4.87/5.0 |
| Moore Amelia Island | 51 | $2,575,913 | 1018 | 4.85/5.0 |
| Fernandina Beach Realty Rental | 91 | $2,501,190 | 266 | 4.59/5.0 |
| Melissa | 40 | $2,315,202 | 393 | 4.83/5.0 |
| Barefoot Amelia | 21 | $1,968,781 | 1671 | 4.92/5.0 |
| Amelia Island Vacations | 53 | $1,809,598 | 1125 | 4.59/5.0 |
| Amelianaire Vacation Rentals | 21 | $1,284,851 | 521 | 4.76/5.0 |
| Destination Amelia | 41 | $1,278,241 | 304 | 4.84/5.0 |
| Evolve | 22 | $1,179,928 | 1046 | 4.84/5.0 |
| Jay | 82 | $1,113,479 | 1266 | 4.64/5.0 |
Analyzing the strategies of top hosts, such as their property selection, pricing, and guest communication, can offer valuable lessons for optimizing your own Airbnb operations in Fernandina Beach.
Dive Deeper: Advanced Fernandina Beach STR Market Data (2026)
Ready to unlock more insights? AirROI provides access to advanced metrics and comprehensive Airbnb data for Fernandina Beach. Explore detailed analytics beyond this report to refine your investment strategy, optimize pricing, and maximize your vacation rental profits.
Explore Advanced MetricsFernandina Beach Short-Term Rental Market Composition (2026): Property & Room Types
Room Type Distribution
Property Type Distribution
Market Composition Insights for Fernandina Beach
- The Fernandina Beach Airbnb market composition is heavily skewed towards Entire Home/Apt listings, which make up 97.9% of the 969 active rentals. This indicates strong guest preference for privacy and space.
- Looking at the property type distribution in Fernandina Beach, Apartment/Condo properties are the most common (59.6%), reflecting the local real estate landscape.
- Houses represent a significant 38.5% portion, catering likely to families or larger groups.
- Smaller segments like others, hotel/boutique, outdoor/unique (combined 1.8%) offer potential for unique stay experiences.
Fernandina Beach Airbnb Room Capacity Analysis (2026): Bedroom Distribution
Distribution of Listings by Number of Bedrooms
Room Capacity Insights for Fernandina Beach
- The dominant room capacity in Fernandina Beach is 2 bedrooms listings, making up 50.8% of the market. This suggests a strong demand for properties suitable for couples or solo travelers.
- Together, 2 bedrooms and 3 bedrooms properties represent 80.8% of the active Airbnb listings in Fernandina Beach, indicating a high concentration in these sizes.
- A significant 37.8% of listings offer 3+ bedrooms, catering to larger groups and families seeking more space in Fernandina Beach.
Fernandina Beach Vacation Rental Guest Capacity Trends (2026)
Distribution of Listings by Guest Capacity
Guest Capacity Insights for Fernandina Beach
- The most common guest capacity trend in Fernandina Beach vacation rentals is listings accommodating 6 guests (41.5%). This suggests the primary traveler segment is likely larger groups.
- Properties designed for 6 guests and 4 guests dominate the Fernandina Beach STR market, accounting for 66.8% of listings.
- 63.8% of properties accommodate 6+ guests, serving the market segment for larger families or group travel in Fernandina Beach.
- On average, properties in Fernandina Beach are equipped to host 5.6 guests.
Fernandina Beach Airbnb Booking Patterns (2026): Available vs. Booked Days
Available Days Distribution
Booked Days Distribution
Booking Pattern Insights for Fernandina Beach
- The most common availability pattern in Fernandina Beach falls within the 271-366 days range, representing 50.3% of listings. This suggests many properties have significant open periods on their calendars.
- Approximately 80.1% of listings show high availability (181+ days open annually), indicating potential for increased bookings or specific owner usage patterns.
- For booked days, the 91-180 days range is most frequent in Fernandina Beach (30.1%), reflecting common guest stay durations or potential owner blocking patterns.
- A notable 21.3% of properties secure long booking periods (181+ days booked per year), highlighting successful long-term rental strategies or significant owner usage.
Fernandina Beach Airbnb Minimum Stay Requirements Analysis
Distribution of Listings by Minimum Night Requirement
1 Night
40 listings
4.1% of total
2 Nights
243 listings
25.1% of total
3 Nights
178 listings
18.4% of total
4-6 Nights
40 listings
4.1% of total
7-29 Nights
24 listings
2.5% of total
30+ Nights
444 listings
45.8% of total
Key Insights
- The most prevalent minimum stay requirement in Fernandina Beach is 30+ Nights, adopted by 45.8% of listings. This highlights the market's preference for longer commitments.
- A significant segment (45.8%) caters to monthly stays (30+ nights) in Fernandina Beach, pointing to opportunities in the extended-stay market.
Recommendations
- Align with the market by considering a 30+ Nights minimum stay, as 45.8% of Fernandina Beach hosts use this setting.
- If feasible, allowing 1-night stays, especially midweek or during low season, could capture last-minute bookings, as only 4.1% currently do.
- Explore offering discounts for stays of 30+ nights to attract the 45.8% of the market seeking extended stays.
- Adjust minimum nights based on seasonality – potentially shorter during low season and longer during peak demand periods in Fernandina Beach.
Fernandina Beach Airbnb Cancellation Policy Trends Analysis (2026)
Super Strict 30 Days
273 listings
28.2% of total
Limited
18 listings
1.9% of total
Super Strict 60 Days
133 listings
13.8% of total
Flexible
36 listings
3.7% of total
Moderate
89 listings
9.2% of total
Firm
312 listings
32.3% of total
Strict
106 listings
11% of total
Cancellation Policy Insights for Fernandina Beach
- The prevailing Airbnb cancellation policy trend in Fernandina Beach is Firm, used by 32.3% of listings.
- There's a relatively balanced mix between guest-friendly (12.9%) and stricter (43.3%) policies, offering choices for different guest needs.
Recommendations for Hosts
- Consider adopting a Firm policy to align with the 32.3% market standard in Fernandina Beach.
- Using a Strict policy might deter some guests, as only 11% of listings use it. Evaluate if potential revenue protection outweighs possible lower booking rates.
- Regularly review your cancellation policy against competitors and market demand shifts in Fernandina Beach.
Fernandina Beach STR Booking Lead Time Analysis (2026)
Average Booking Lead Time by Month
Booking Lead Time Insights for Fernandina Beach
- The overall average booking lead time for vacation rentals in Fernandina Beach is 66 days.
- Guests book furthest in advance for stays during March (average 81 days), likely coinciding with peak travel demand or local events.
- The shortest booking windows occur for stays in December (average 57 days), indicating more last-minute travel plans during this time.
- Seasonally, Spring (75 days avg.) sees the longest lead times, while Summer (62 days avg.) has the shortest, reflecting typical travel planning cycles.
Recommendations for Hosts
- Use the overall average lead time (66 days) as a baseline for your pricing and availability strategy in Fernandina Beach.
- For March stays, consider implementing length-of-stay discounts or slightly higher rates for bookings made less than 81 days out to capitalize on advance planning.
- Target marketing efforts for the Spring season well in advance (at least 75 days) to capture early planners.
- Monitor your own booking lead times against these Fernandina Beach averages to identify opportunities for dynamic pricing adjustments.
Popular & Essential Airbnb Amenities in Fernandina Beach (2026)
Amenity Prevalence
Amenity Insights for Fernandina Beach
- Essential amenities in Fernandina Beach that guests expect include: Air conditioning, Wifi, Smoke alarm, Free parking on premises, TV, Coffee maker, Heating, Microwave, Refrigerator, Kitchen. Lacking these (any) could significantly impact bookings.
Recommendations for Hosts
- Ensure your listing includes all essential amenities for Fernandina Beach: Air conditioning, Wifi, Smoke alarm, Free parking on premises, TV, Coffee maker, Heating, Microwave, Refrigerator, Kitchen.
- Prioritize adding missing essentials: Air conditioning, Wifi, Smoke alarm, Free parking on premises, TV, Coffee maker, Heating, Microwave, Refrigerator, Kitchen.
- Highlight unique or less common amenities you offer (e.g., hot tub, dedicated workspace, EV charger) in your listing description and photos.
- Regularly check competitor amenities in Fernandina Beach to stay competitive.
Fernandina Beach Airbnb Guest Demographics & Profile Analysis (2026)
Guest Profile Summary for Fernandina Beach
- The typical guest profile for Airbnb in Fernandina Beach consists of primarily domestic travelers (98%), often arriving from nearby Atlanta, typically belonging to the Post-2000s (Gen Z/Alpha) group (50%), primarily speaking English or Spanish.
- Domestic travelers account for 98.0% of guests.
- Key international markets include United States (98%) and DC (0.5%).
- Top languages spoken are English (81.1%) followed by Spanish (10.4%).
- A significant demographic segment is the Post-2000s (Gen Z/Alpha) group, representing 50% of guests.
Recommendations for Hosts
- Target domestic marketing efforts towards travelers from Atlanta and Jacksonville.
- Tailor amenities and listing descriptions to appeal to the dominant Post-2000s (Gen Z/Alpha) demographic (e.g., highlight fast WiFi, smart home features, local guides).
- Highlight unique local experiences or amenities relevant to the primary guest profile.
- Consider seasonal promotions aligned with peak travel times for key origin markets.
Nearby Short-Term Rental Market Comparison
How does the Fernandina Beach Airbnb market stack up against its neighbors? Compare key performance metrics like average monthly revenue, ADR, and occupancy rates in surrounding areas to understand the broader regional STR landscape.
| Market | Active Properties | Monthly Revenue | Daily Rate | Avg. Occupancy |
|---|---|---|---|---|
| St. Johns County | 12 | $6,964 | $592.43 | 47% |
| Ponte Vedra Beach | 224 | $5,720 | $574.75 | 43% |
| Vilano Beach | 173 | $5,571 | $442.95 | 45% |
| St. Simons | 91 | $4,162 | $379.84 | 42% |
| Jacksonville Beach | 763 | $4,123 | $328.32 | 49% |
| Saint Augustine | 1,749 | $3,586 | $287.24 | 46% |
| Montgomery | 11 | $3,557 | $246.45 | 54% |
| Saint Simons | 902 | $3,532 | $375.60 | 38% |
| Isle of Hope | 32 | $3,502 | $271.42 | 46% |
| Hammock Beach | 197 | $3,498 | $441.99 | 39% |