Dr. Phillips Airbnb Market Analysis 2026: Short Term Rental Data & Vacation Rental Statistics in Florida, United States
Is Airbnb profitable in Dr. Phillips in 2026? Explore comprehensive Airbnb analytics for Dr. Phillips, Florida, United States to uncover income potential. This 2026 STR market report for Dr. Phillips, based on AirROI data from February 2025 to January 2026, reveals key trends in the niche market of 148 active listings.
Whether you're considering an Airbnb investment in Dr. Phillips, optimizing your existing vacation rental, or exploring rental arbitrage opportunities, understanding the Dr. Phillips Airbnb data is crucial. Leveraging the low regulation environment is key to maximizing your short term rental income potential. Let's dive into the specifics.
Key Dr. Phillips Airbnb Performance Metrics Overview
Monthly Airbnb Revenue Variations & Income Potential in Dr. Phillips (2026)
Understanding the monthly revenue variations for Airbnb listings in Dr. Phillips is key to maximizing your short term rental income potential. Seasonality significantly impacts earnings. Our analysis, based on data from the past 12 months, shows that the peak revenue month for STRs in Dr. Phillips is typically October, while May often presents the lowest earnings, highlighting opportunities for strategic pricing adjustments during shoulder and low seasons. Explore the typical Airbnb income in Dr. Phillips across different performance tiers:
- Best-in-class properties (Top 10%) achieve $4,686+ monthly, often utilizing dynamic pricing and superior guest experiences.
- Strong performing properties (Top 25%) earn $3,212 or more, indicating effective management and desirable locations/amenities.
- Typical properties (Median) generate around $2,123 per month, representing the average market performance.
- Entry-level properties (Bottom 25%) see earnings around $1,174, often with potential for optimization.
Average Monthly Airbnb Earnings Trend in Dr. Phillips
Dr. Phillips Airbnb Occupancy Rate Trends (2026)
Maximize your bookings by understanding the Dr. Phillips STR occupancy trends. Seasonal demand shifts significantly influence how often properties are booked. Typically, Februarysees the highest demand (peak season occupancy), while January experiences the lowest (low season). Effective strategies, like adjusting minimum stays or offering promotions, can boost occupancy during slower periods. Here's how different property tiers perform in Dr. Phillips:
- Best-in-class properties (Top 10%) achieve 89%+ occupancy, indicating high desirability and potentially optimized availability.
- Strong performing properties (Top 25%) maintain 78% or higher occupancy, suggesting good market fit and guest satisfaction.
- Typical properties (Median) have an occupancy rate around 59%.
- Entry-level properties (Bottom 25%) average 35% occupancy, potentially facing higher vacancy.
Average Monthly Occupancy Rate Trend in Dr. Phillips
Average Daily Rate (ADR) Airbnb Trends in Dr. Phillips (2026)
Effective short term rental pricing strategy in Dr. Phillips involves understanding monthly ADR fluctuations. The Average Daily Rate (ADR) for Airbnb in Dr. Phillips typically peaks in December and dips lowest during February. Leveraging Airbnb dynamic pricing tools or strategies based on this seasonality can significantly boost revenue. Here's a look at the typical nightly rates achieved:
- Best-in-class properties (Top 10%) command rates of $215+ per night, often due to premium features or locations.
- Strong performing properties (Top 25%) achieve nightly rates of $158 or more.
- Typical properties (Median) charge around $117 per night.
- Entry-level properties (Bottom 25%) earn around $96 per night.
Average Daily Rate (ADR) Trend by Month in Dr. Phillips
Get Live Dr. Phillips Market Intelligence 👇

Explore Real-time Analytics
Airbnb Seasonality Analysis & Trends in Dr. Phillips (2026)
Peak Season (October, March, December)
- Revenue averages $2,828 per month
- Occupancy rates average 60.4%
- Daily rates average $144
Shoulder Season
- Revenue averages $2,515 per month
- Occupancy maintains around 57.8%
- Daily rates hold near $139
Low Season (May, August, September)
- Revenue drops to average $2,148 per month
- Occupancy decreases to average 50.0%
- Daily rates adjust to average $136
Seasonality Insights for Dr. Phillips
- The Airbnb seasonality in Dr. Phillips shows relatively stable year-round demand. While the sections above show seasonal averages, it's also insightful to look at the extremes:
- During the high season, the absolute peak month showcases Dr. Phillips's highest earning potential, with monthly revenues capable of climbing to $2,861, occupancy reaching a high of 70.0%, and ADRs peaking at $156.
- Conversely, the slowest single month of the year, typically falling within the low season, marks the market's lowest point. In this month, revenue might dip to $2,120, occupancy could drop to 45.4%, and ADRs may adjust down to $131.
- Understanding both the seasonal averages and these monthly peaks and troughs in revenue, occupancy, and ADR is crucial for maximizing your Airbnb profit potential in Dr. Phillips.
Seasonal Strategies for Maximizing Profit
- Peak Season: Maximize revenue through premium pricing and potentially longer minimum stays. Ensure high availability.
- Low Season: Offer competitive pricing, special promotions (e.g., extended stay discounts), and flexible cancellation policies. Target off-season travelers like remote workers or budget-conscious guests.
- Shoulder Seasons: Implement dynamic pricing that balances peak and low rates. Target weekend travelers or specific events. Offer slightly more flexible terms than peak season.
- Regularly analyze your own performance against these Dr. Phillips seasonality benchmarks and adjust your pricing and availability strategy accordingly.
Best Areas for Airbnb Investment in Dr. Phillips (2026)
Exploring the top neighborhoods for short-term rentals in Dr. Phillips? This section highlights key areas, outlining why they are attractive for hosts and guests, along with notable local attractions. Consider these locations based on your target guest profile and investment strategy.
| Neighborhood / Area | Why Host Here? (Target Guests & Appeal) | Key Attractions & Landmarks |
|---|---|---|
| Dr. Phillips | A prestigious community known for its upscale residences and proximity to Universal Orlando Resort and other attractions. Ideal for visitors looking for luxury and convenience. | Universal Orlando Resort, The Orange County Convention Center, Lake Buena Vista, Restaurant Row, SeaWorld Orlando |
| Sand Lake | This area is famous for its many dining options and entertainment venues, making it a hit with tourists and business travelers alike. | Restaurant Row, Cocoa Beach, Lake Tibet, Retreat at Dr. Phillips, Orlando International Premium Outlets |
| Windermere | An affluent town close to Dr. Phillips, Windermere offers luxury rentals and an upscale atmosphere, attracting families and visitors looking for a quieter stay. | Lake Butler, Windermere Town Hall, Bacchus Bar and Grill, Windermere Country Club |
| Orlando International Drive | Renowned for its tourist attractions and vibrant nightlife, International Drive is a hotspot for those seeking theme parks and entertainment. | ICON Park, Madame Tussauds, The SEA LIFE Aquarium, Orlando Eye, Universal's Volcano Bay |
| Lake Nona | A modern neighborhood known for its innovative community and technology, it's becoming increasingly popular among travelers seeking contemporary accommodations. | Lake Nona Medical City, Boxi Park, Lake Nona Golf and Country Club, Nemours Children's Hospital |
| Maitland | Nestled just north of Dr. Phillips, Maitland features beautiful lakes and parks, making it attractive for visitors wanting a more suburban experience while still near Orlando. | Lake Maitland, Maitland Art Center, Enzian Theater, Yoga Studio |
| Kissimmee | Just south of Dr. Phillips, Kissimmee is close to all the Orlando attractions and offers various vacation rentals for families and group travelers. | Walt Disney World® Resort, Old Town, Kissimmee Lakefront Park, Island H2O Live! Water Park |
| Celebration | A charming, planned community near Walt Disney World, it's known for its quaint town vibe and is ideal for families visiting the theme parks. | Disney's Celebration Town Center, Celebration Golf Club, Lake Rianhard |
Understanding Airbnb License Requirements & STR Laws in Dr. Phillips (2026)
While Dr. Phillips, Florida, United States currently shows low STR regulations, specific Airbnb license requirements might still exist or change. Always verify the latest short term rental regulations and Airbnb license requirements directly with local government authorities for Dr. Phillips to ensure full compliance before hosting.
(Source: AirROI data, 2026, finding no licensed listings among those analyzed)
Top Performing Airbnb Properties in Dr. Phillips (2026)
Benchmark your potential! Explore examples of top-performing Airbnb properties in Dr. Phillipsbased on Trailing Twelve Month (TTM) revenue. Analyze their characteristics, revenue, occupancy rate, and ADR to understand what drives success in this market.

POOL Oasis Lakeview next to Universal/ EPIC/Disney
Entire Place • 6 bedrooms

Huge pool & Lakeview home | 5 Min Universal
Entire Place • 4 bedrooms
4BR/2BA Private POOL Home Close to Universal/Parks
Entire Place • 4 bedrooms
Paradise pool home /5 Min Universal /13 min Disney
Entire Place • 4 bedrooms
The Lake House - Next to Universal Studios - NEW ♥️
Entire Place • 3 bedrooms

1802 Cozy Condo 3 min Universal
Entire Place • 2 bedrooms
Note: Performance varies based on location, size, amenities, seasonality, and management quality. Data reflects the past 12 months.
Top Performing Airbnb Hosts in Dr. Phillips (2026)
Learn from the best! This table showcases top-performing Airbnb hosts in Dr. Phillips based on the number of properties managed and estimated total revenue over the past year. Analyze their scale and performance metrics.
| Host Name | Properties | Grossing Revenue | Stay Reviews | Avg Rating |
|---|---|---|---|---|
| Genesis | 4 | $373,206 | 543 | 4.84/5.0 |
| Gabriel | 7 | $302,944 | 571 | 4.79/5.0 |
| Michel | 15 | $206,085 | 1548 | 4.51/5.0 |
| Etienne & Gustavo | 4 | $124,839 | 417 | 4.75/5.0 |
| Liana | 3 | $111,637 | 1075 | 4.85/5.0 |
| Ivy | 1 | $102,488 | 103 | 4.94/5.0 |
| Jesus | 1 | $99,616 | 262 | 4.96/5.0 |
| Nicoleta | 2 | $97,608 | 931 | 4.87/5.0 |
| Giovanni | 2 | $91,753 | 92 | 4.75/5.0 |
| Aline Perin | 3 | $90,834 | 279 | 4.31/5.0 |
Analyzing the strategies of top hosts, such as their property selection, pricing, and guest communication, can offer valuable lessons for optimizing your own Airbnb operations in Dr. Phillips.
Dive Deeper: Advanced Dr. Phillips STR Market Data (2026)
Ready to unlock more insights? AirROI provides access to advanced metrics and comprehensive Airbnb data for Dr. Phillips. Explore detailed analytics beyond this report to refine your investment strategy, optimize pricing, and maximize your vacation rental profits.
Explore Advanced MetricsDr. Phillips Short-Term Rental Market Composition (2026): Property & Room Types
Room Type Distribution
Property Type Distribution
Market Composition Insights for Dr. Phillips
- The Dr. Phillips Airbnb market composition is heavily skewed towards Entire Home/Apt listings, which make up 89.2% of the 148 active rentals. This indicates strong guest preference for privacy and space.
- Looking at the property type distribution in Dr. Phillips, Apartment/Condo properties are the most common (75%), reflecting the local real estate landscape.
- Houses represent a significant 18.9% portion, catering likely to families or larger groups.
- The presence of 5.4% Hotel/Boutique listings indicates integration with traditional hospitality.
- Smaller segments like others (combined 0.7%) offer potential for unique stay experiences.
Dr. Phillips Airbnb Room Capacity Analysis (2026): Bedroom Distribution
Distribution of Listings by Number of Bedrooms
Room Capacity Insights for Dr. Phillips
- The dominant room capacity in Dr. Phillips is 1 bedroom listings, making up 41.2% of the market. This suggests a strong demand for properties suitable for couples or solo travelers.
- Together, 1 bedroom and 2 bedrooms properties represent 71.6% of the active Airbnb listings in Dr. Phillips, indicating a high concentration in these sizes.
- Listings with 3+ bedrooms (6.8%) represent a smaller niche, potentially indicating an underserved market for larger group accommodations in Dr. Phillips.
Dr. Phillips Vacation Rental Guest Capacity Trends (2026)
Distribution of Listings by Guest Capacity
Guest Capacity Insights for Dr. Phillips
- The most common guest capacity trend in Dr. Phillips vacation rentals is listings accommodating 4 guests (45.9%). This suggests the primary traveler segment is likely small families or groups.
- Properties designed for 4 guests and 6 guests dominate the Dr. Phillips STR market, accounting for 59.4% of listings.
- 21.7% of properties accommodate 6+ guests, serving the market segment for larger families or group travel in Dr. Phillips.
- On average, properties in Dr. Phillips are equipped to host 4.2 guests.
Dr. Phillips Airbnb Booking Patterns (2026): Available vs. Booked Days
Available Days Distribution
Booked Days Distribution
Booking Pattern Insights for Dr. Phillips
- The most common availability pattern in Dr. Phillips falls within the 91-180 days range, representing 31.1% of listings. This suggests many properties have significant open periods on their calendars.
- Approximately 50.6% of listings show high availability (181+ days open annually), indicating potential for increased bookings or specific owner usage patterns.
- For booked days, the 91-180 days range is most frequent in Dr. Phillips (31.1%), reflecting common guest stay durations or potential owner blocking patterns.
- A notable 50.0% of properties secure long booking periods (181+ days booked per year), highlighting successful long-term rental strategies or significant owner usage.
Dr. Phillips Airbnb Minimum Stay Requirements Analysis
Distribution of Listings by Minimum Night Requirement
1 Night
54 listings
36.5% of total
2 Nights
40 listings
27% of total
3 Nights
5 listings
3.4% of total
7-29 Nights
4 listings
2.7% of total
30+ Nights
45 listings
30.4% of total
Key Insights
- The most prevalent minimum stay requirement in Dr. Phillips is 1 Night, adopted by 36.5% of listings. This highlights the market's preference for shorter, flexible bookings.
- A strong majority (63.5%) of the Dr. Phillips Airbnb data shows acceptance of very short stays (1-2 nights), indicating a dynamic, high-turnover market.
- A significant segment (30.4%) caters to monthly stays (30+ nights) in Dr. Phillips, pointing to opportunities in the extended-stay market.
Recommendations
- Align with the market by considering a 1 Night minimum stay, as 36.5% of Dr. Phillips hosts use this setting.
- Explore offering discounts for stays of 30+ nights to attract the 30.4% of the market seeking extended stays.
- Adjust minimum nights based on seasonality – potentially shorter during low season and longer during peak demand periods in Dr. Phillips.
Dr. Phillips Airbnb Cancellation Policy Trends Analysis (2026)
Super Strict 60 Days
1 listings
0.7% of total
Limited
4 listings
2.7% of total
Flexible
18 listings
12.3% of total
Moderate
44 listings
30.1% of total
Firm
51 listings
34.9% of total
Strict
28 listings
19.2% of total
Cancellation Policy Insights for Dr. Phillips
- The prevailing Airbnb cancellation policy trend in Dr. Phillips is Firm, used by 34.9% of listings.
- A majority (54.1%) of hosts in Dr. Phillips utilize Firm or Strict policies, indicating a market where hosts prioritize booking security.
Recommendations for Hosts
- Consider adopting a Firm policy to align with the 34.9% market standard in Dr. Phillips.
- Regularly review your cancellation policy against competitors and market demand shifts in Dr. Phillips.
Dr. Phillips STR Booking Lead Time Analysis (2026)
Average Booking Lead Time by Month
Booking Lead Time Insights for Dr. Phillips
- The overall average booking lead time for vacation rentals in Dr. Phillips is 50 days.
- Guests book furthest in advance for stays during November (average 71 days), likely coinciding with peak travel demand or local events.
- The shortest booking windows occur for stays in March (average 39 days), indicating more last-minute travel plans during this time.
- Seasonally, Winter (57 days avg.) sees the longest lead times, while Spring (44 days avg.) has the shortest, reflecting typical travel planning cycles.
Recommendations for Hosts
- Use the overall average lead time (50 days) as a baseline for your pricing and availability strategy in Dr. Phillips.
- For November stays, consider implementing length-of-stay discounts or slightly higher rates for bookings made less than 71 days out to capitalize on advance planning.
- Target marketing efforts for the Winter season well in advance (at least 57 days) to capture early planners.
- Monitor your own booking lead times against these Dr. Phillips averages to identify opportunities for dynamic pricing adjustments.
Popular & Essential Airbnb Amenities in Dr. Phillips (2026)
Amenity Prevalence
Amenity Insights for Dr. Phillips
- Essential amenities in Dr. Phillips that guests expect include: Air conditioning, TV, Free parking on premises, Wifi. Lacking these (any) could significantly impact bookings.
- Popular amenities like Smoke alarm, Hot water, Heating are common but not universal. Offering these can provide a competitive edge.
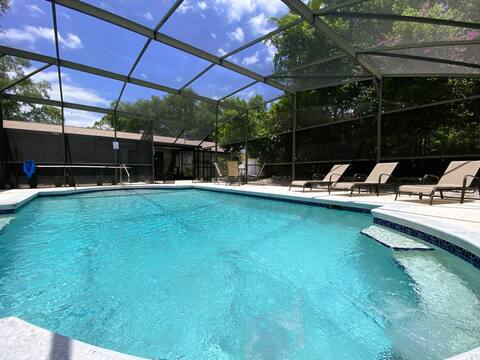
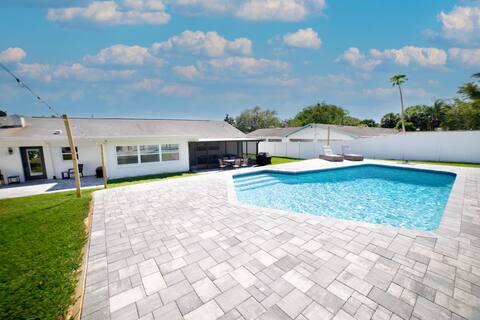
- A pool is a highly desired but not standard amenity, making it a key feature for attracting guests seeking leisure in Dr. Phillips.
Recommendations for Hosts
- Ensure your listing includes all essential amenities for Dr. Phillips: Air conditioning, TV, Free parking on premises, Wifi.
- Prioritize adding missing essentials: TV, Free parking on premises, Wifi.
- Consider adding popular differentiators like Smoke alarm or Hot water to increase appeal.
- Highlight unique or less common amenities you offer (e.g., hot tub, dedicated workspace, EV charger) in your listing description and photos.
- Regularly check competitor amenities in Dr. Phillips to stay competitive.
Dr. Phillips Airbnb Guest Demographics & Profile Analysis (2026)
Guest Profile Summary for Dr. Phillips
- The typical guest profile for Airbnb in Dr. Phillips consists of primarily domestic travelers (79%), often arriving from nearby Miami, typically belonging to the Post-2000s (Gen Z/Alpha) group (50%), primarily speaking English or Spanish.
- Domestic travelers account for 79.4% of guests.
- Key international markets include United States (79.4%) and Brazil (3.9%).
- Top languages spoken are English (61.2%) followed by Spanish (21.7%).
- A significant demographic segment is the Post-2000s (Gen Z/Alpha) group, representing 50% of guests.
Recommendations for Hosts
- Target domestic marketing efforts towards travelers from Miami and Orlando.
- Tailor amenities and listing descriptions to appeal to the dominant Post-2000s (Gen Z/Alpha) demographic (e.g., highlight fast WiFi, smart home features, local guides).
- Highlight unique local experiences or amenities relevant to the primary guest profile.
- Consider seasonal promotions aligned with peak travel times for key origin markets.
Nearby Short-Term Rental Market Comparison
How does the Dr. Phillips Airbnb market stack up against its neighbors? Compare key performance metrics like average monthly revenue, ADR, and occupancy rates in surrounding areas to understand the broader regional STR landscape.
| Market | Active Properties | Monthly Revenue | Daily Rate | Avg. Occupancy |
|---|---|---|---|---|
| Sailfish Point | 19 | $16,709 | $1587.63 | 48% |
| Anna Maria island | 587 | $7,996 | $823.96 | 41% |
| Anna Maria | 56 | $6,434 | $692.96 | 52% |
| Reunion | 12 | $6,321 | $580.45 | 44% |
| Vilano Beach | 173 | $5,571 | $442.95 | 45% |
| Indian Rocks Beach | 842 | $5,560 | $419.63 | 49% |
| Melbourne Beach | 275 | $5,384 | $488.83 | 43% |
| Siesta Key | 1,175 | $5,206 | $518.91 | 42% |
| Belleair Beach | 94 | $5,086 | $339.65 | 53% |
| Bradenton Beach | 122 | $4,977 | $507.12 | 42% |