Doctor Phillips Airbnb Market Analysis 2026: Short Term Rental Data & Vacation Rental Statistics in Florida, United States
Is Airbnb profitable in Doctor Phillips in 2026? Explore comprehensive Airbnb analytics for Doctor Phillips, Florida, United States to uncover income potential. This 2026 STR market report for Doctor Phillips, based on AirROI data from February 2025 to January 2026, reveals key trends in the niche market of 51 active listings.
Whether you're considering an Airbnb investment in Doctor Phillips, optimizing your existing vacation rental, or exploring rental arbitrage opportunities, understanding the Doctor Phillips Airbnb data is crucial. Leveraging the low regulation environment is key to maximizing your short term rental income potential. Let's dive into the specifics.
Key Doctor Phillips Airbnb Performance Metrics Overview
Monthly Airbnb Revenue Variations & Income Potential in Doctor Phillips (2026)
Understanding the monthly revenue variations for Airbnb listings in Doctor Phillips is key to maximizing your short term rental income potential. Seasonality significantly impacts earnings. Our analysis, based on data from the past 12 months, shows that the peak revenue month for STRs in Doctor Phillips is typically October, while September often presents the lowest earnings, highlighting opportunities for strategic pricing adjustments during shoulder and low seasons. Explore the typical Airbnb income in Doctor Phillips across different performance tiers:
- Best-in-class properties (Top 10%) achieve $9,643+ monthly, often utilizing dynamic pricing and superior guest experiences.
- Strong performing properties (Top 25%) earn $5,831 or more, indicating effective management and desirable locations/amenities.
- Typical properties (Median) generate around $2,704 per month, representing the average market performance.
- Entry-level properties (Bottom 25%) see earnings around $1,388, often with potential for optimization.
Average Monthly Airbnb Earnings Trend in Doctor Phillips
Doctor Phillips Airbnb Occupancy Rate Trends (2026)
Maximize your bookings by understanding the Doctor Phillips STR occupancy trends. Seasonal demand shifts significantly influence how often properties are booked. Typically, Marchsees the highest demand (peak season occupancy), while August experiences the lowest (low season). Effective strategies, like adjusting minimum stays or offering promotions, can boost occupancy during slower periods. Here's how different property tiers perform in Doctor Phillips:
- Best-in-class properties (Top 10%) achieve 88%+ occupancy, indicating high desirability and potentially optimized availability.
- Strong performing properties (Top 25%) maintain 76% or higher occupancy, suggesting good market fit and guest satisfaction.
- Typical properties (Median) have an occupancy rate around 61%.
- Entry-level properties (Bottom 25%) average 40% occupancy, potentially facing higher vacancy.
Average Monthly Occupancy Rate Trend in Doctor Phillips
Average Daily Rate (ADR) Airbnb Trends in Doctor Phillips (2026)
Effective short term rental pricing strategy in Doctor Phillips involves understanding monthly ADR fluctuations. The Average Daily Rate (ADR) for Airbnb in Doctor Phillips typically peaks in December and dips lowest during February. Leveraging Airbnb dynamic pricing tools or strategies based on this seasonality can significantly boost revenue. Here's a look at the typical nightly rates achieved:
- Best-in-class properties (Top 10%) command rates of $436+ per night, often due to premium features or locations.
- Strong performing properties (Top 25%) achieve nightly rates of $313 or more.
- Typical properties (Median) charge around $175 per night.
- Entry-level properties (Bottom 25%) earn around $113 per night.
Average Daily Rate (ADR) Trend by Month in Doctor Phillips
Get Live Doctor Phillips Market Intelligence 👇

Explore Real-time Analytics
Airbnb Seasonality Analysis & Trends in Doctor Phillips (2026)
Peak Season (October, March, June)
- Revenue averages $4,631 per month
- Occupancy rates average 65.7%
- Daily rates average $234
Shoulder Season
- Revenue averages $4,012 per month
- Occupancy maintains around 54.2%
- Daily rates hold near $240
Low Season (February, May, September)
- Revenue drops to average $3,418 per month
- Occupancy decreases to average 55.1%
- Daily rates adjust to average $224
Seasonality Insights for Doctor Phillips
- The Airbnb seasonality in Doctor Phillips shows moderate seasonality with distinct peak and low periods. While the sections above show seasonal averages, it's also insightful to look at the extremes:
- During the high season, the absolute peak month showcases Doctor Phillips's highest earning potential, with monthly revenues capable of climbing to $4,711, occupancy reaching a high of 70.1%, and ADRs peaking at $264.
- Conversely, the slowest single month of the year, typically falling within the low season, marks the market's lowest point. In this month, revenue might dip to $3,348, occupancy could drop to 49.9%, and ADRs may adjust down to $220.
- Understanding both the seasonal averages and these monthly peaks and troughs in revenue, occupancy, and ADR is crucial for maximizing your Airbnb profit potential in Doctor Phillips.
Seasonal Strategies for Maximizing Profit
- Peak Season: Maximize revenue through premium pricing and potentially longer minimum stays. Ensure high availability.
- Low Season: Offer competitive pricing, special promotions (e.g., extended stay discounts), and flexible cancellation policies. Target off-season travelers like remote workers or budget-conscious guests.
- Shoulder Seasons: Implement dynamic pricing that balances peak and low rates. Target weekend travelers or specific events. Offer slightly more flexible terms than peak season.
- Regularly analyze your own performance against these Doctor Phillips seasonality benchmarks and adjust your pricing and availability strategy accordingly.
Best Areas for Airbnb Investment in Doctor Phillips (2026)
Exploring the top neighborhoods for short-term rentals in Doctor Phillips? This section highlights key areas, outlining why they are attractive for hosts and guests, along with notable local attractions. Consider these locations based on your target guest profile and investment strategy.
| Neighborhood / Area | Why Host Here? (Target Guests & Appeal) | Key Attractions & Landmarks |
|---|---|---|
| Urbandale | Family-friendly neighborhood close to Orlando attractions. This area is popular among tourists visiting Disney and Universal Studios, offering a mix of residential comfort and easy access to entertainment. | Universal Studios Orlando, The Wizarding World of Harry Potter, Destino, The Mall at Millenia, Orlando International Premium Outlets |
| Dr. Phillips | A vibrant community known for its excellent dining options and proximity to theme parks. Ideal for families and vacationers looking for a comfortable stay near Orlando's attractions. | Theme Park attractions, Restaurant Row, Lake Tibet-Butler Preserve, Dr. Phillips Community Park, Pointe Orlando |
| Bay Hill | Upscale neighborhood famous for its luxurious homes and golf courses. Attracts affluent travelers and golf enthusiasts looking for a serene environment near major attractions. | Bay Hill Club and Lodge, Arnold Palmer's Bay Hill Club, Golf courses, Universal's Volcano Bay, Walt Disney World Resort |
| Lake Buena Vista | Home to Disney World and other major attractions, this area is perfect for tourists looking for convenience and proximity to world-class entertainment. | Walt Disney World Resort, Disney Springs, Epcot, Disney's Typhoon Lagoon Water Park, Disney's Hollywood Studios |
| Windermere | Scenic neighborhood known for its lakes and outdoor activities. Great for guests looking for a more laid-back atmosphere while still being close to Orlando attractions. | Lake Windermere, Reunion Resort Water Park, Windermere Town Square, Orange County National Golf Center, The Butler Chain of Lakes |
| Downtown Orlando | Urban area filled with nightlife, restaurants, and cultural attractions. Ideal for travelers looking for a vibrant city experience within close reach of theme parks. | Lake Eola Park, Dr. Phillips Center for the Performing Arts, Church Street District, Orlando Science Center, Amway Center |
| Pointe Orlando | A shopping and entertainment complex, offering a mix of dining, shopping, and entertainment options. Popular among tourists looking to unwind after a day at the parks. | Pointe Orlando shopping center, IMAX Theatre, The Capital Grille, Blue Martini, Dr. Phillips Center |
| Thornton Park | Trendy neighborhood known for its charming boutiques, cafes, and nightlife. Attracts younger crowds and those looking for a vibrant local experience. | Thornton Park District, Lake Eola, Gastronomy food scene, Art galleries, Event venues |
Understanding Airbnb License Requirements & STR Laws in Doctor Phillips (2026)
While Doctor Phillips, Florida, United States currently shows low STR regulations, specific Airbnb license requirements might still exist or change. Always verify the latest short term rental regulations and Airbnb license requirements directly with local government authorities for Doctor Phillips to ensure full compliance before hosting.
(Source: AirROI data, 2026, finding no licensed listings among those analyzed)
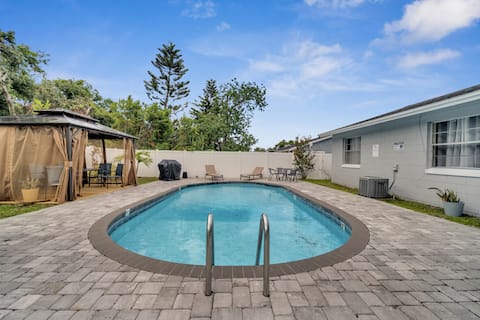
Top Performing Airbnb Properties in Doctor Phillips (2026)
Benchmark your potential! Explore examples of top-performing Airbnb properties in Doctor Phillipsbased on Trailing Twelve Month (TTM) revenue. Analyze their characteristics, revenue, occupancy rate, and ADR to understand what drives success in this market.
Mini golf course, 1 mile to Universal, Pool
Entire Place • 4 bedrooms
No Airbnb fee! Home Pvt Pool/ Spa/Game Room 244301
Entire Place • 5 bedrooms
Cheerful 5-bedroom POOL Home, Next to Universal
Entire Place • 5 bedrooms
Executive Home in Bay Hill Area
Entire Place • 5 bedrooms
5BR Home w/ Pool & Big Yard Near Universal Studios
Entire Place • 5 bedrooms

Mid-century Modern Villa w/ Pool Near Universal
Entire Place • 4 bedrooms
Note: Performance varies based on location, size, amenities, seasonality, and management quality. Data reflects the past 12 months.
Top Performing Airbnb Hosts in Doctor Phillips (2026)
Learn from the best! This table showcases top-performing Airbnb hosts in Doctor Phillips based on the number of properties managed and estimated total revenue over the past year. Analyze their scale and performance metrics.
| Host Name | Properties | Grossing Revenue | Stay Reviews | Avg Rating |
|---|---|---|---|---|
| Jesus | 3 | $292,515 | 410 | 4.95/5.0 |
| Ricardo | 2 | $223,463 | 226 | 4.88/5.0 |
| James | 1 | $141,046 | 102 | 4.88/5.0 |
| Diana | 2 | $125,649 | 132 | 4.68/5.0 |
| Genesis | 2 | $124,455 | 400 | 4.84/5.0 |
| Mike | 1 | $119,397 | 28 | 4.82/5.0 |
| Ray | 1 | $109,805 | 68 | 4.91/5.0 |
| Jeremy | 1 | $106,930 | 332 | 4.91/5.0 |
| Joaquim | 1 | $89,761 | 43 | 4.67/5.0 |
| Fredy | 1 | $66,309 | 287 | 4.84/5.0 |
Analyzing the strategies of top hosts, such as their property selection, pricing, and guest communication, can offer valuable lessons for optimizing your own Airbnb operations in Doctor Phillips.
Dive Deeper: Advanced Doctor Phillips STR Market Data (2026)
Ready to unlock more insights? AirROI provides access to advanced metrics and comprehensive Airbnb data for Doctor Phillips. Explore detailed analytics beyond this report to refine your investment strategy, optimize pricing, and maximize your vacation rental profits.
Explore Advanced MetricsDoctor Phillips Short-Term Rental Market Composition (2026): Property & Room Types
Room Type Distribution
Property Type Distribution
Market Composition Insights for Doctor Phillips
- The Doctor Phillips Airbnb market composition is heavily skewed towards Entire Home/Apt listings, which make up 70.6% of the 51 active rentals. This indicates strong guest preference for privacy and space.
- Looking at the property type distribution in Doctor Phillips, House properties are the most common (56.9%), reflecting the local real estate landscape.
- Houses represent a significant 56.9% portion, catering likely to families or larger groups.
- The presence of 19.6% Hotel/Boutique listings indicates integration with traditional hospitality.
- Smaller segments like outdoor/unique (combined 3.9%) offer potential for unique stay experiences.
Doctor Phillips Airbnb Room Capacity Analysis (2026): Bedroom Distribution
Distribution of Listings by Number of Bedrooms
Room Capacity Insights for Doctor Phillips
- The dominant room capacity in Doctor Phillips is 1 bedroom listings, making up 29.4% of the market. This suggests a strong demand for properties suitable for couples or solo travelers.
- Together, 1 bedroom and 2 bedrooms properties represent 45.1% of the active Airbnb listings in Doctor Phillips, indicating a high concentration in these sizes.
- A significant 41.2% of listings offer 3+ bedrooms, catering to larger groups and families seeking more space in Doctor Phillips.
Doctor Phillips Vacation Rental Guest Capacity Trends (2026)
Distribution of Listings by Guest Capacity
Guest Capacity Insights for Doctor Phillips
- The most common guest capacity trend in Doctor Phillips vacation rentals is listings accommodating 8+ guests (37.3%). This suggests the primary traveler segment is likely larger groups.
- Properties designed for 8+ guests and 2 guests dominate the Doctor Phillips STR market, accounting for 53.0% of listings.
- 47.1% of properties accommodate 6+ guests, serving the market segment for larger families or group travel in Doctor Phillips.
- On average, properties in Doctor Phillips are equipped to host 4.7 guests.
Doctor Phillips Airbnb Booking Patterns (2026): Available vs. Booked Days
Available Days Distribution
Booked Days Distribution
Booking Pattern Insights for Doctor Phillips
- The most common availability pattern in Doctor Phillips falls within the 91-180 days range, representing 43.1% of listings. This suggests many properties have significant open periods on their calendars.
- Approximately 41.1% of listings show high availability (181+ days open annually), indicating potential for increased bookings or specific owner usage patterns.
- For booked days, the 181-270 days range is most frequent in Doctor Phillips (43.1%), reflecting common guest stay durations or potential owner blocking patterns.
- A notable 60.7% of properties secure long booking periods (181+ days booked per year), highlighting successful long-term rental strategies or significant owner usage.
Doctor Phillips Airbnb Minimum Stay Requirements Analysis
Distribution of Listings by Minimum Night Requirement
1 Night
21 listings
41.2% of total
2 Nights
7 listings
13.7% of total
3 Nights
2 listings
3.9% of total
4-6 Nights
3 listings
5.9% of total
7-29 Nights
3 listings
5.9% of total
30+ Nights
15 listings
29.4% of total
Key Insights
- The most prevalent minimum stay requirement in Doctor Phillips is 1 Night, adopted by 41.2% of listings. This highlights the market's preference for shorter, flexible bookings.
- A significant segment (29.4%) caters to monthly stays (30+ nights) in Doctor Phillips, pointing to opportunities in the extended-stay market.
Recommendations
- Align with the market by considering a 1 Night minimum stay, as 41.2% of Doctor Phillips hosts use this setting.
- Explore offering discounts for stays of 30+ nights to attract the 29.4% of the market seeking extended stays.
- Adjust minimum nights based on seasonality – potentially shorter during low season and longer during peak demand periods in Doctor Phillips.
Doctor Phillips Airbnb Cancellation Policy Trends Analysis (2026)
Super Strict 60 Days
1 listings
2.1% of total
Flexible
6 listings
12.5% of total
Moderate
11 listings
22.9% of total
Firm
19 listings
39.6% of total
Strict
11 listings
22.9% of total
Cancellation Policy Insights for Doctor Phillips
- The prevailing Airbnb cancellation policy trend in Doctor Phillips is Firm, used by 39.6% of listings.
- A majority (62.5%) of hosts in Doctor Phillips utilize Firm or Strict policies, indicating a market where hosts prioritize booking security.
Recommendations for Hosts
- Consider adopting a Firm policy to align with the 39.6% market standard in Doctor Phillips.
- Regularly review your cancellation policy against competitors and market demand shifts in Doctor Phillips.
Doctor Phillips STR Booking Lead Time Analysis (2026)
Average Booking Lead Time by Month
Booking Lead Time Insights for Doctor Phillips
- The overall average booking lead time for vacation rentals in Doctor Phillips is 60 days.
- Guests book furthest in advance for stays during November (average 102 days), likely coinciding with peak travel demand or local events.
- The shortest booking windows occur for stays in February (average 47 days), indicating more last-minute travel plans during this time.
- Seasonally, Fall (75 days avg.) sees the longest lead times, while Spring (50 days avg.) has the shortest, reflecting typical travel planning cycles.
Recommendations for Hosts
- Use the overall average lead time (60 days) as a baseline for your pricing and availability strategy in Doctor Phillips.
- For November stays, consider implementing length-of-stay discounts or slightly higher rates for bookings made less than 102 days out to capitalize on advance planning.
- Target marketing efforts for the Fall season well in advance (at least 75 days) to capture early planners.
- Monitor your own booking lead times against these Doctor Phillips averages to identify opportunities for dynamic pricing adjustments.
Popular & Essential Airbnb Amenities in Doctor Phillips (2026)
Amenity Prevalence
Amenity Insights for Doctor Phillips
- Essential amenities in Doctor Phillips that guests expect include: Air conditioning, Wifi, Free parking on premises, TV. Lacking these (any) could significantly impact bookings.
- Popular amenities like Heating, Hot water, Smoke alarm are common but not universal. Offering these can provide a competitive edge.
Recommendations for Hosts
- Ensure your listing includes all essential amenities for Doctor Phillips: Air conditioning, Wifi, Free parking on premises, TV.
- Prioritize adding missing essentials: Free parking on premises, TV.
- Consider adding popular differentiators like Heating or Hot water to increase appeal.
- Highlight unique or less common amenities you offer (e.g., hot tub, dedicated workspace, EV charger) in your listing description and photos.
- Regularly check competitor amenities in Doctor Phillips to stay competitive.
Doctor Phillips Airbnb Guest Demographics & Profile Analysis (2026)
Guest Profile Summary for Doctor Phillips
- The typical guest profile for Airbnb in Doctor Phillips consists of primarily domestic travelers (87%), often arriving from nearby Jacksonville, typically belonging to the Post-2000s (Gen Z/Alpha) group (50%), primarily speaking English or Spanish.
- Domestic travelers account for 86.7% of guests.
- Key international markets include United States (86.7%) and United Kingdom (2.4%).
- Top languages spoken are English (65.1%) followed by Spanish (15.1%).
- A significant demographic segment is the Post-2000s (Gen Z/Alpha) group, representing 50% of guests.
Recommendations for Hosts
- Target domestic marketing efforts towards travelers from Jacksonville and Miami.
- Tailor amenities and listing descriptions to appeal to the dominant Post-2000s (Gen Z/Alpha) demographic (e.g., highlight fast WiFi, smart home features, local guides).
- Highlight unique local experiences or amenities relevant to the primary guest profile.
- Consider seasonal promotions aligned with peak travel times for key origin markets.
Nearby Short-Term Rental Market Comparison
How does the Doctor Phillips Airbnb market stack up against its neighbors? Compare key performance metrics like average monthly revenue, ADR, and occupancy rates in surrounding areas to understand the broader regional STR landscape.
| Market | Active Properties | Monthly Revenue | Daily Rate | Avg. Occupancy |
|---|---|---|---|---|
| Sailfish Point | 19 | $16,709 | $1587.63 | 48% |
| Anna Maria island | 587 | $7,996 | $823.96 | 41% |
| Anna Maria | 56 | $6,434 | $692.96 | 52% |
| Reunion | 12 | $6,321 | $580.45 | 44% |
| Vilano Beach | 173 | $5,571 | $442.95 | 45% |
| Indian Rocks Beach | 842 | $5,560 | $419.63 | 49% |
| Melbourne Beach | 275 | $5,384 | $488.83 | 43% |
| Siesta Key | 1,175 | $5,206 | $518.91 | 42% |
| Belleair Beach | 94 | $5,086 | $339.65 | 53% |
| Bradenton Beach | 122 | $4,977 | $507.12 | 42% |