Deerfield Beach Airbnb Market Analysis 2026: Short Term Rental Data & Vacation Rental Statistics in Florida, United States
Is Airbnb profitable in Deerfield Beach in 2026? Explore comprehensive Airbnb analytics for Deerfield Beach, Florida, United States to uncover income potential. This 2026 STR market report for Deerfield Beach, based on AirROI data from February 2025 to January 2026, reveals key trends in the market of 628 active listings.
Whether you're considering an Airbnb investment in Deerfield Beach, optimizing your existing vacation rental, or exploring rental arbitrage opportunities, understanding the Deerfield Beach Airbnb data is crucial. Leveraging the low regulation environment is key to maximizing your short term rental income potential. Let's dive into the specifics.
Key Deerfield Beach Airbnb Performance Metrics Overview
Monthly Airbnb Revenue Variations & Income Potential in Deerfield Beach (2026)
Understanding the monthly revenue variations for Airbnb listings in Deerfield Beach is key to maximizing your short term rental income potential. Seasonality significantly impacts earnings. Our analysis, based on data from the past 12 months, shows that the peak revenue month for STRs in Deerfield Beach is typically March, while September often presents the lowest earnings, highlighting opportunities for strategic pricing adjustments during shoulder and low seasons. Explore the typical Airbnb income in Deerfield Beach across different performance tiers:
- Best-in-class properties (Top 10%) achieve $9,739+ monthly, often utilizing dynamic pricing and superior guest experiences.
- Strong performing properties (Top 25%) earn $6,120 or more, indicating effective management and desirable locations/amenities.
- Typical properties (Median) generate around $3,148 per month, representing the average market performance.
- Entry-level properties (Bottom 25%) see earnings around $1,698, often with potential for optimization.
Average Monthly Airbnb Earnings Trend in Deerfield Beach
Deerfield Beach Airbnb Occupancy Rate Trends (2026)
Maximize your bookings by understanding the Deerfield Beach STR occupancy trends. Seasonal demand shifts significantly influence how often properties are booked. Typically, Februarysees the highest demand (peak season occupancy), while September experiences the lowest (low season). Effective strategies, like adjusting minimum stays or offering promotions, can boost occupancy during slower periods. Here's how different property tiers perform in Deerfield Beach:
- Best-in-class properties (Top 10%) achieve 86%+ occupancy, indicating high desirability and potentially optimized availability.
- Strong performing properties (Top 25%) maintain 72% or higher occupancy, suggesting good market fit and guest satisfaction.
- Typical properties (Median) have an occupancy rate around 49%.
- Entry-level properties (Bottom 25%) average 27% occupancy, potentially facing higher vacancy.
Average Monthly Occupancy Rate Trend in Deerfield Beach
Average Daily Rate (ADR) Airbnb Trends in Deerfield Beach (2026)
Effective short term rental pricing strategy in Deerfield Beach involves understanding monthly ADR fluctuations. The Average Daily Rate (ADR) for Airbnb in Deerfield Beach typically peaks in December and dips lowest during August. Leveraging Airbnb dynamic pricing tools or strategies based on this seasonality can significantly boost revenue. Here's a look at the typical nightly rates achieved:
- Best-in-class properties (Top 10%) command rates of $505+ per night, often due to premium features or locations.
- Strong performing properties (Top 25%) achieve nightly rates of $362 or more.
- Typical properties (Median) charge around $220 per night.
- Entry-level properties (Bottom 25%) earn around $142 per night.
Average Daily Rate (ADR) Trend by Month in Deerfield Beach
Get Live Deerfield Beach Market Intelligence 👇

Explore Real-time Analytics
Airbnb Seasonality Analysis & Trends in Deerfield Beach (2026)
Peak Season (March, February, December)
- Revenue averages $6,449 per month
- Occupancy rates average 61.2%
- Daily rates average $316
Shoulder Season
- Revenue averages $4,170 per month
- Occupancy maintains around 47.2%
- Daily rates hold near $275
Low Season (May, September, October)
- Revenue drops to average $3,262 per month
- Occupancy decreases to average 41.4%
- Daily rates adjust to average $258
Seasonality Insights for Deerfield Beach
- The Airbnb seasonality in Deerfield Beach shows highly seasonal trends requiring careful strategy. While the sections above show seasonal averages, it's also insightful to look at the extremes:
- During the high season, the absolute peak month showcases Deerfield Beach's highest earning potential, with monthly revenues capable of climbing to $7,135, occupancy reaching a high of 70.1%, and ADRs peaking at $341.
- Conversely, the slowest single month of the year, typically falling within the low season, marks the market's lowest point. In this month, revenue might dip to $2,879, occupancy could drop to 37.5%, and ADRs may adjust down to $244.
- Understanding both the seasonal averages and these monthly peaks and troughs in revenue, occupancy, and ADR is crucial for maximizing your Airbnb profit potential in Deerfield Beach.
Seasonal Strategies for Maximizing Profit
- Peak Season: Maximize revenue through premium pricing and potentially longer minimum stays. Ensure high availability.
- Low Season: Offer competitive pricing, special promotions (e.g., extended stay discounts), and flexible cancellation policies. Target off-season travelers like remote workers or budget-conscious guests.
- Shoulder Seasons: Implement dynamic pricing that balances peak and low rates. Target weekend travelers or specific events. Offer slightly more flexible terms than peak season.
- Regularly analyze your own performance against these Deerfield Beach seasonality benchmarks and adjust your pricing and availability strategy accordingly.
Best Areas for Airbnb Investment in Deerfield Beach (2026)
Exploring the top neighborhoods for short-term rentals in Deerfield Beach? This section highlights key areas, outlining why they are attractive for hosts and guests, along with notable local attractions. Consider these locations based on your target guest profile and investment strategy.
| Neighborhood / Area | Why Host Here? (Target Guests & Appeal) | Key Attractions & Landmarks |
|---|---|---|
| Deerfield Beach Boardwalk | A scenic area known for its beautiful beachfront and recreational activities. It's a popular spot for families and tourists, offering direct access to the beach and nearby restaurants. | Deerfield Beach International Fishing Pier, Cove Shopping Center, Quiet Waters Park, Barker Park, Deerfield Island Park |
| Hillsboro Beach | A tranquil and upscale neighborhood located just north of Deerfield Beach. Known for its luxury homes and private beach access, it's ideal for those seeking a quieter retreat. | Hillsboro Beach, Hillsboro Inlet Lighthouse, Nature Preserve, Boca Raton Beaches, The Ocean Club |
| South Deerfield Beach | A residential area that is popular among families and long-term visitors. Close to shopping and dining, and just a short distance to the beach, it attracts those looking for a local experience. | Deerfield Beach Arboretum, Shopping on Federal Highway, Local Dining, Parks and Playgrounds, Nearby Golf Courses |
| The Cove | A waterfront neighborhood known for its charming homes and proximity to the marina. Attractive for vacationers interested in boating and water activities. | The Cove Shopping Center, Waterfront Restaurants, Deerfield Beach Marina, Beach Access, Diving and Snorkeling Sites |
| Oceanway | A beachside neighborhood with a mix of residential homes and vacation rentals. Offers easy access to the beach and a laid-back vibe, making it attractive for families. | Deerfield Beach, Picnic Areas, Playgrounds, Beachfront Restaurants, Biking Trails |
| Mizner Park (nearby in Boca Raton) | Although technically in Boca Raton, it's very close to Deerfield Beach and offers high-end shopping and dining, making it desirable for visitors to the broader area. | Mizner Park Cinemas, Mizner Park Amphitheater, High-End Retail Stores, Restaurants, Cultural Events |
| Boca Raton Resort Area (nearby) | Another nearby area known for luxury resorts and golf courses that attracts affluent visitors. It's a short drive from Deerfield Beach, appealing to those wanting resort amenities. | Boca Raton Resort & Club, Golf Courses, Luxury Spas, Shopping at Town Center Boca Raton, Fine Dining Options |
| Pine Tree Park | A community-oriented neighborhood that features parks and recreational spaces. It’s appealing to those who want a neighborhood feel while being close to the beach. | Pine Tree Park, Community Events, Nearby Schools, Access to Beach, Parks and Recreation Facilities |
Understanding Airbnb License Requirements & STR Laws in Deerfield Beach (2026)
While Deerfield Beach, Florida, United States currently shows low STR regulations, specific Airbnb license requirements might still exist or change. Always verify the latest short term rental regulations and Airbnb license requirements directly with local government authorities for Deerfield Beach to ensure full compliance before hosting.
(Source: AirROI data, 2026, based on 0% licensed listings)
Top Performing Airbnb Properties in Deerfield Beach (2026)
Benchmark your potential! Explore examples of top-performing Airbnb properties in Deerfield Beachbased on Trailing Twelve Month (TTM) revenue. Analyze their characteristics, revenue, occupancy rate, and ADR to understand what drives success in this market.

1402 Large Home Main Waterway | by Brampton Park
Entire Place • 4 bedrooms
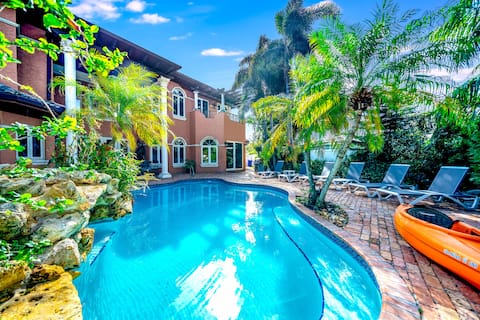
Waterfront Mansion! Heated Pool+Hot Tub! Kayak!
Entire Place • 6 bedrooms
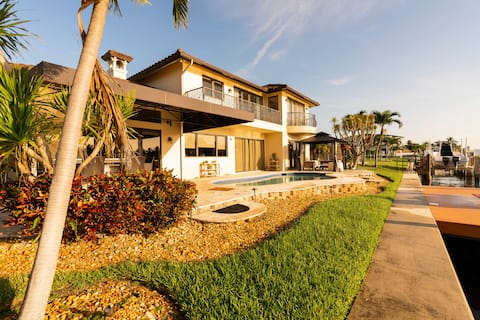
5 Bedroom Luxe Villa on Deep Water Intracoastal
Entire Place • 5 bedrooms

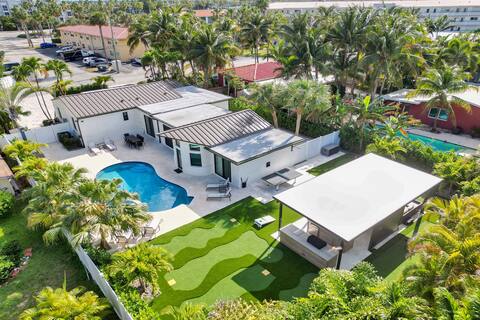
6BR Waterfront Villa Pool | Jacuzzi Close To Beach
Entire Place • 6 bedrooms

7BR New Pool w/Jacuzzi Gameroom Close to Beach
Entire Place • 7 bedrooms
Pool, Hot Tub, Mini Golf & MORE! DFB Bungalows
Entire Place • 6 bedrooms
Note: Performance varies based on location, size, amenities, seasonality, and management quality. Data reflects the past 12 months.
Top Performing Airbnb Hosts in Deerfield Beach (2026)
Learn from the best! This table showcases top-performing Airbnb hosts in Deerfield Beach based on the number of properties managed and estimated total revenue over the past year. Analyze their scale and performance metrics.
| Host Name | Properties | Grossing Revenue | Stay Reviews | Avg Rating |
|---|---|---|---|---|
| Deen | 11 | $1,410,467 | 213 | 4.67/5.0 |
| Brampton Park | 11 | $1,248,728 | 315 | 4.94/5.0 |
| Deen. | 11 | $1,185,231 | 520 | 4.72/5.0 |
| Todd | 7 | $505,272 | 401 | 4.83/5.0 |
| Roberto | 30 | $442,099 | 524 | 4.85/5.0 |
| Marilyn | 11 | $404,979 | 2592 | 4.83/5.0 |
| Lance | 3 | $374,144 | 68 | 4.94/5.0 |
| Robyn | 6 | $325,066 | 1618 | 4.99/5.0 |
| Danielle | 18 | $285,070 | 364 | 4.87/5.0 |
| IRenta | 6 | $284,261 | 197 | 4.78/5.0 |
Analyzing the strategies of top hosts, such as their property selection, pricing, and guest communication, can offer valuable lessons for optimizing your own Airbnb operations in Deerfield Beach.
Dive Deeper: Advanced Deerfield Beach STR Market Data (2026)
Ready to unlock more insights? AirROI provides access to advanced metrics and comprehensive Airbnb data for Deerfield Beach. Explore detailed analytics beyond this report to refine your investment strategy, optimize pricing, and maximize your vacation rental profits.
Explore Advanced MetricsDeerfield Beach Short-Term Rental Market Composition (2026): Property & Room Types
Room Type Distribution
Property Type Distribution
Market Composition Insights for Deerfield Beach
- The Deerfield Beach Airbnb market composition is heavily skewed towards Entire Home/Apt listings, which make up 89.8% of the 628 active rentals. This indicates strong guest preference for privacy and space.
- Looking at the property type distribution in Deerfield Beach, House properties are the most common (49%), reflecting the local real estate landscape.
- Houses represent a significant 49% portion, catering likely to families or larger groups.
- Smaller segments like hotel/boutique, others, outdoor/unique, unique stays (combined 6.6%) offer potential for unique stay experiences.
Deerfield Beach Airbnb Room Capacity Analysis (2026): Bedroom Distribution
Distribution of Listings by Number of Bedrooms
Room Capacity Insights for Deerfield Beach
- The dominant room capacity in Deerfield Beach is 1 bedroom listings, making up 37.4% of the market. This suggests a strong demand for properties suitable for couples or solo travelers.
- Together, 1 bedroom and 3 bedrooms properties represent 58.7% of the active Airbnb listings in Deerfield Beach, indicating a high concentration in these sizes.
- A significant 35.9% of listings offer 3+ bedrooms, catering to larger groups and families seeking more space in Deerfield Beach.
Deerfield Beach Vacation Rental Guest Capacity Trends (2026)
Distribution of Listings by Guest Capacity
Guest Capacity Insights for Deerfield Beach
- The most common guest capacity trend in Deerfield Beach vacation rentals is listings accommodating 8+ guests (24.7%). This suggests the primary traveler segment is likely larger groups.
- Properties designed for 8+ guests and 4 guests dominate the Deerfield Beach STR market, accounting for 47.0% of listings.
- 43.8% of properties accommodate 6+ guests, serving the market segment for larger families or group travel in Deerfield Beach.
- On average, properties in Deerfield Beach are equipped to host 4.9 guests.
Deerfield Beach Airbnb Booking Patterns (2026): Available vs. Booked Days
Available Days Distribution
Booked Days Distribution
Booking Pattern Insights for Deerfield Beach
- The most common availability pattern in Deerfield Beach falls within the 271-366 days range, representing 38.7% of listings. This suggests many properties have significant open periods on their calendars.
- Approximately 72.6% of listings show high availability (181+ days open annually), indicating potential for increased bookings or specific owner usage patterns.
- For booked days, the 91-180 days range is most frequent in Deerfield Beach (34.7%), reflecting common guest stay durations or potential owner blocking patterns.
- A notable 28.5% of properties secure long booking periods (181+ days booked per year), highlighting successful long-term rental strategies or significant owner usage.
Deerfield Beach Airbnb Minimum Stay Requirements Analysis
Distribution of Listings by Minimum Night Requirement
1 Night
104 listings
16.6% of total
2 Nights
148 listings
23.6% of total
3 Nights
70 listings
11.1% of total
4-6 Nights
64 listings
10.2% of total
7-29 Nights
36 listings
5.7% of total
30+ Nights
206 listings
32.8% of total
Key Insights
- The most prevalent minimum stay requirement in Deerfield Beach is 30+ Nights, adopted by 32.8% of listings. This highlights the market's preference for longer commitments.
- A significant segment (32.8%) caters to monthly stays (30+ nights) in Deerfield Beach, pointing to opportunities in the extended-stay market.
Recommendations
- Align with the market by considering a 30+ Nights minimum stay, as 32.8% of Deerfield Beach hosts use this setting.
- If feasible, allowing 1-night stays, especially midweek or during low season, could capture last-minute bookings, as only 16.6% currently do.
- Explore offering discounts for stays of 30+ nights to attract the 32.8% of the market seeking extended stays.
- Adjust minimum nights based on seasonality – potentially shorter during low season and longer during peak demand periods in Deerfield Beach.
Deerfield Beach Airbnb Cancellation Policy Trends Analysis (2026)
Super Strict 30 Days
15 listings
2.4% of total
Super Strict 60 Days
23 listings
3.7% of total
Limited
10 listings
1.6% of total
Flexible
88 listings
14% of total
Moderate
154 listings
24.6% of total
Firm
226 listings
36% of total
Strict
111 listings
17.7% of total
Cancellation Policy Insights for Deerfield Beach
- The prevailing Airbnb cancellation policy trend in Deerfield Beach is Firm, used by 36% of listings.
- A majority (53.7%) of hosts in Deerfield Beach utilize Firm or Strict policies, indicating a market where hosts prioritize booking security.
Recommendations for Hosts
- Consider adopting a Firm policy to align with the 36% market standard in Deerfield Beach.
- Regularly review your cancellation policy against competitors and market demand shifts in Deerfield Beach.
Deerfield Beach STR Booking Lead Time Analysis (2026)
Average Booking Lead Time by Month
Booking Lead Time Insights for Deerfield Beach
- The overall average booking lead time for vacation rentals in Deerfield Beach is 49 days.
- Guests book furthest in advance for stays during February (average 88 days), likely coinciding with peak travel demand or local events.
- The shortest booking windows occur for stays in September (average 28 days), indicating more last-minute travel plans during this time.
- Seasonally, Winter (73 days avg.) sees the longest lead times, while Summer (31 days avg.) has the shortest, reflecting typical travel planning cycles.
Recommendations for Hosts
- Use the overall average lead time (49 days) as a baseline for your pricing and availability strategy in Deerfield Beach.
- For February stays, consider implementing length-of-stay discounts or slightly higher rates for bookings made less than 88 days out to capitalize on advance planning.
- Target marketing efforts for the Winter season well in advance (at least 73 days) to capture early planners.
- Monitor your own booking lead times against these Deerfield Beach averages to identify opportunities for dynamic pricing adjustments.
Popular & Essential Airbnb Amenities in Deerfield Beach (2026)
Amenity Prevalence
Amenity Insights for Deerfield Beach
- Essential amenities in Deerfield Beach that guests expect include: Air conditioning, Wifi, TV, Free parking on premises, Smoke alarm. Lacking these (any) could significantly impact bookings.
- Popular amenities like Kitchen, Coffee maker, Microwave are common but not universal. Offering these can provide a competitive edge.
Recommendations for Hosts
- Ensure your listing includes all essential amenities for Deerfield Beach: Air conditioning, Wifi, TV, Free parking on premises, Smoke alarm.
- Prioritize adding missing essentials: Wifi, TV, Free parking on premises, Smoke alarm.
- Consider adding popular differentiators like Kitchen or Coffee maker to increase appeal.
- Highlight unique or less common amenities you offer (e.g., hot tub, dedicated workspace, EV charger) in your listing description and photos.
- Regularly check competitor amenities in Deerfield Beach to stay competitive.
Deerfield Beach Airbnb Guest Demographics & Profile Analysis (2026)
Guest Profile Summary for Deerfield Beach
- The typical guest profile for Airbnb in Deerfield Beach consists of primarily domestic travelers (88%), often arriving from nearby New York, typically belonging to the Post-2000s (Gen Z/Alpha) group (50%), primarily speaking English or Spanish.
- Domestic travelers account for 88.1% of guests.
- Key international markets include United States (88.1%) and Canada (3.6%).
- Top languages spoken are English (62%) followed by Spanish (17.9%).
- A significant demographic segment is the Post-2000s (Gen Z/Alpha) group, representing 50% of guests.
Recommendations for Hosts
- Target domestic marketing efforts towards travelers from New York and Boca Raton.
- Tailor amenities and listing descriptions to appeal to the dominant Post-2000s (Gen Z/Alpha) demographic (e.g., highlight fast WiFi, smart home features, local guides).
- Highlight unique local experiences or amenities relevant to the primary guest profile.
- Consider seasonal promotions aligned with peak travel times for key origin markets.
Nearby Short-Term Rental Market Comparison
How does the Deerfield Beach Airbnb market stack up against its neighbors? Compare key performance metrics like average monthly revenue, ADR, and occupancy rates in surrounding areas to understand the broader regional STR landscape.
| Market | Active Properties | Monthly Revenue | Daily Rate | Avg. Occupancy |
|---|---|---|---|---|
| Sailfish Point | 19 | $16,709 | $1587.63 | 48% |
| Bal Harbour Village | 37 | $8,846 | $850.63 | 34% |
| Lake Clarke Shores | 26 | $6,710 | $516.52 | 46% |
| Lighthouse Point | 75 | $6,205 | $472.94 | 51% |
| Pinecrest | 11 | $6,117 | $861.24 | 43% |
| North Bay Village | 120 | $6,032 | $561.12 | 44% |
| Tequesta | 43 | $4,920 | $376.96 | 50% |
| Juno Beach | 39 | $4,807 | $377.00 | 47% |
| Parkland | 17 | $4,637 | $369.21 | 47% |
| Ocean Ridge | 14 | $4,588 | $602.78 | 48% |