Deep Creek Airbnb Market Analysis 2026: Short Term Rental Data & Vacation Rental Statistics in Florida, United States
Is Airbnb profitable in Deep Creek in 2026? Explore comprehensive Airbnb analytics for Deep Creek, Florida, United States to uncover income potential. This 2026 STR market report for Deep Creek, based on AirROI data from February 2025 to January 2026, reveals key trends in the niche market of 19 active listings.
Whether you're considering an Airbnb investment in Deep Creek, optimizing your existing vacation rental, or exploring rental arbitrage opportunities, understanding the Deep Creek Airbnb data is crucial. Leveraging the low regulation environment is key to maximizing your short term rental income potential. Let's dive into the specifics.
Key Deep Creek Airbnb Performance Metrics Overview
Monthly Airbnb Revenue Variations & Income Potential in Deep Creek (2026)
Understanding the monthly revenue variations for Airbnb listings in Deep Creek is key to maximizing your short term rental income potential. Seasonality significantly impacts earnings. Our analysis, based on data from the past 12 months, shows that the peak revenue month for STRs in Deep Creek is typically March, while September often presents the lowest earnings, highlighting opportunities for strategic pricing adjustments during shoulder and low seasons. Explore the typical Airbnb income in Deep Creek across different performance tiers:
- Best-in-class properties (Top 10%) achieve $4,846+ monthly, often utilizing dynamic pricing and superior guest experiences.
- Strong performing properties (Top 25%) earn $3,391 or more, indicating effective management and desirable locations/amenities.
- Typical properties (Median) generate around $2,122 per month, representing the average market performance.
- Entry-level properties (Bottom 25%) see earnings around $1,198, often with potential for optimization.
Average Monthly Airbnb Earnings Trend in Deep Creek
Deep Creek Airbnb Occupancy Rate Trends (2026)
Maximize your bookings by understanding the Deep Creek STR occupancy trends. Seasonal demand shifts significantly influence how often properties are booked. Typically, Marchsees the highest demand (peak season occupancy), while September experiences the lowest (low season). Effective strategies, like adjusting minimum stays or offering promotions, can boost occupancy during slower periods. Here's how different property tiers perform in Deep Creek:
- Best-in-class properties (Top 10%) achieve 78%+ occupancy, indicating high desirability and potentially optimized availability.
- Strong performing properties (Top 25%) maintain 54% or higher occupancy, suggesting good market fit and guest satisfaction.
- Typical properties (Median) have an occupancy rate around 36%.
- Entry-level properties (Bottom 25%) average 25% occupancy, potentially facing higher vacancy.
Average Monthly Occupancy Rate Trend in Deep Creek
Average Daily Rate (ADR) Airbnb Trends in Deep Creek (2026)
Effective short term rental pricing strategy in Deep Creek involves understanding monthly ADR fluctuations. The Average Daily Rate (ADR) for Airbnb in Deep Creek typically peaks in January and dips lowest during May. Leveraging Airbnb dynamic pricing tools or strategies based on this seasonality can significantly boost revenue. Here's a look at the typical nightly rates achieved:
- Best-in-class properties (Top 10%) command rates of $278+ per night, often due to premium features or locations.
- Strong performing properties (Top 25%) achieve nightly rates of $238 or more.
- Typical properties (Median) charge around $186 per night.
- Entry-level properties (Bottom 25%) earn around $107 per night.
Average Daily Rate (ADR) Trend by Month in Deep Creek
Get Live Deep Creek Market Intelligence 👇

Explore Real-time Analytics
Airbnb Seasonality Analysis & Trends in Deep Creek (2026)
Peak Season (March, February, April)
- Revenue averages $3,579 per month
- Occupancy rates average 58.3%
- Daily rates average $182
Shoulder Season
- Revenue averages $2,389 per month
- Occupancy maintains around 40.3%
- Daily rates hold near $192
Low Season (May, September, November)
- Revenue drops to average $1,618 per month
- Occupancy decreases to average 27.8%
- Daily rates adjust to average $183
Seasonality Insights for Deep Creek
- The Airbnb seasonality in Deep Creek shows highly seasonal trends requiring careful strategy. While the sections above show seasonal averages, it's also insightful to look at the extremes:
- During the high season, the absolute peak month showcases Deep Creek's highest earning potential, with monthly revenues capable of climbing to $4,107, occupancy reaching a high of 68.1%, and ADRs peaking at $230.
- Conversely, the slowest single month of the year, typically falling within the low season, marks the market's lowest point. In this month, revenue might dip to $1,171, occupancy could drop to 20.5%, and ADRs may adjust down to $165.
- Understanding both the seasonal averages and these monthly peaks and troughs in revenue, occupancy, and ADR is crucial for maximizing your Airbnb profit potential in Deep Creek.
Seasonal Strategies for Maximizing Profit
- Peak Season: Maximize revenue through premium pricing and potentially longer minimum stays. Ensure high availability.
- Low Season: Offer competitive pricing, special promotions (e.g., extended stay discounts), and flexible cancellation policies. Target off-season travelers like remote workers or budget-conscious guests.
- Shoulder Seasons: Implement dynamic pricing that balances peak and low rates. Target weekend travelers or specific events. Offer slightly more flexible terms than peak season.
- Regularly analyze your own performance against these Deep Creek seasonality benchmarks and adjust your pricing and availability strategy accordingly.
Best Areas for Airbnb Investment in Deep Creek (2026)
Exploring the top neighborhoods for short-term rentals in Deep Creek? This section highlights key areas, outlining why they are attractive for hosts and guests, along with notable local attractions. Consider these locations based on your target guest profile and investment strategy.
| Neighborhood / Area | Why Host Here? (Target Guests & Appeal) | Key Attractions & Landmarks |
|---|---|---|
| Deep Creek Preserve | A beautiful natural area offering outdoor activities like hiking and birdwatching. Perfect for nature lovers and families seeking a peaceful retreat. | Deep Creek Preserve, Shell Creek, Punta Gorda Nature Park, Peace River |
| Punta Gorda | Charming waterfront town with a rich history and vibrant arts scene. Ideal for tourists interested in leisure and local culture. | Punta Gorda Historic District, Fishermen's Village, Punta Gorda Waterfront, Peace River Botanical & Sculpture Gardens |
| Charlotte Harbor | Known for its stunning waterfront views and fishing opportunities. Attracts travelers interested in boating and water activities. | Charlotte Harbor State Park, Punta Gorda Boat Rentals, Fishing Tours, Harbor Walk |
| Port Charlotte | A suburban area with diverse dining and shopping options, appealing to families and couples looking for a relaxing getaway. | Port Charlotte Town Center, Sunseeker Resort, Charlotte Sports Park, Cultural Center of Charlotte County |
| Babcock Ranch | Innovative eco-friendly community known for sustainability and nature-related activities. A unique destination for green tourism enthusiasts. | Babcock Ranch Eco Tours, Nature Trails, Fisherman's Village, Lake Babcock |
| Reunion Park | Family-friendly area with parks and recreational activities, perfect for travelers wanting a convenient and fun environment. | Reunion Park, Multiple Recreational Parks, Family Activities, Community Events |
| Kingsway Golf Club Area | Ideal for golf enthusiasts looking to combine leisure and sports during their stay, with easy access to golf courses and local amenities. | Kingsway Golf Club, Golf Courses, Local Restaurants, Nature Trails |
| Cabbage Key | A stunning island getaway known for its natural beauty and laid-back atmosphere. Great for tourists looking for a unique escape. | Cabbage Key Inn, Water Activities, Sunset Views, Shelling Spots |
Understanding Airbnb License Requirements & STR Laws in Deep Creek (2026)
While Deep Creek, Florida, United States currently shows low STR regulations, specific Airbnb license requirements might still exist or change. Always verify the latest short term rental regulations and Airbnb license requirements directly with local government authorities for Deep Creek to ensure full compliance before hosting.
(Source: AirROI data, 2026, finding no licensed listings among those analyzed)
Top Performing Airbnb Properties in Deep Creek (2026)
Benchmark your potential! Explore examples of top-performing Airbnb properties in Deep Creekbased on Trailing Twelve Month (TTM) revenue. Analyze their characteristics, revenue, occupancy rate, and ADR to understand what drives success in this market.
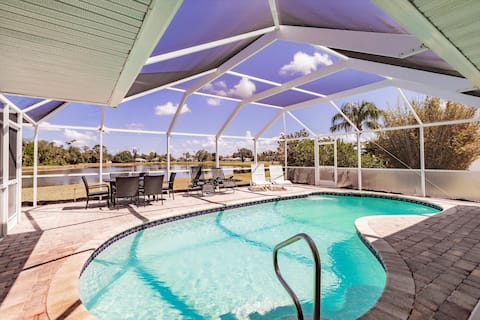
The Sunset Lake House/heated pool house
Entire Place • 4 bedrooms
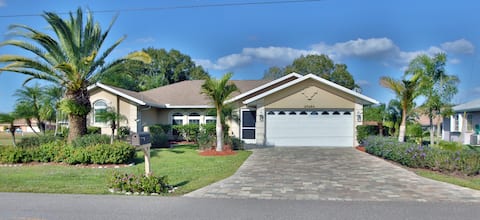
Seasonal vacation rental with Heated pool
Entire Place • 3 bedrooms
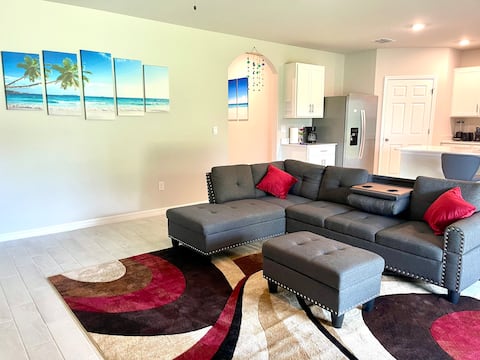
Florida Paradise House - 2
Entire Place • 4 bedrooms
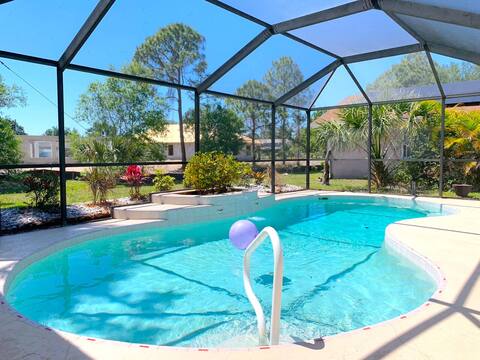
Heated Saltwater Pool • Pet-Friendly 3BR Home
Entire Place • 3 bedrooms

Deep Creek 3 Bedroom Private Pool and Spa Home
Entire Place • 3 bedrooms
Punta Gorda Home away from home * 3/2*Pool*Pets ok
Entire Place • 3 bedrooms
Note: Performance varies based on location, size, amenities, seasonality, and management quality. Data reflects the past 12 months.
Top Performing Airbnb Hosts in Deep Creek (2026)
Learn from the best! This table showcases top-performing Airbnb hosts in Deep Creek based on the number of properties managed and estimated total revenue over the past year. Analyze their scale and performance metrics.
| Host Name | Properties | Grossing Revenue | Stay Reviews | Avg Rating |
|---|---|---|---|---|
| Tom | 1 | $57,475 | 74 | 4.97/5.0 |
| Bob | 1 | $43,048 | 187 | 4.95/5.0 |
| Hm Shah | 1 | $26,911 | 58 | 4.88/5.0 |
| Global Vacation Rentals | 2 | $24,961 | 8 | 4.26/5.0 |
| DAwn | 1 | $24,815 | 26 | 4.85/5.0 |
| Nicole | 1 | $22,389 | 6 | 5.00/5.0 |
| Jessica | 1 | $22,384 | 3 | 5.00/5.0 |
| Debbie | 2 | $13,968 | 16 | 5.00/5.0 |
| Inna | 1 | $10,431 | 9 | 4.89/5.0 |
| Larry | 2 | $10,268 | 141 | 4.97/5.0 |
Analyzing the strategies of top hosts, such as their property selection, pricing, and guest communication, can offer valuable lessons for optimizing your own Airbnb operations in Deep Creek.
Dive Deeper: Advanced Deep Creek STR Market Data (2026)
Ready to unlock more insights? AirROI provides access to advanced metrics and comprehensive Airbnb data for Deep Creek. Explore detailed analytics beyond this report to refine your investment strategy, optimize pricing, and maximize your vacation rental profits.
Explore Advanced MetricsDeep Creek Short-Term Rental Market Composition (2026): Property & Room Types
Room Type Distribution
Property Type Distribution
Market Composition Insights for Deep Creek
- The Deep Creek Airbnb market composition is heavily skewed towards Entire Home/Apt listings, which make up 89.5% of the 19 active rentals. This indicates strong guest preference for privacy and space.
- Looking at the property type distribution in Deep Creek, House properties are the most common (94.7%), reflecting the local real estate landscape.
- Houses represent a significant 94.7% portion, catering likely to families or larger groups.
Deep Creek Airbnb Room Capacity Analysis (2026): Bedroom Distribution
Distribution of Listings by Number of Bedrooms
Room Capacity Insights for Deep Creek
- The dominant room capacity in Deep Creek is 3 bedrooms listings, making up 42.1% of the market. This suggests a strong demand for properties suitable for families or small groups.
- Together, 3 bedrooms and 2 bedrooms properties represent 73.7% of the active Airbnb listings in Deep Creek, indicating a high concentration in these sizes.
- A significant 63.2% of listings offer 3+ bedrooms, catering to larger groups and families seeking more space in Deep Creek.
Deep Creek Vacation Rental Guest Capacity Trends (2026)
Distribution of Listings by Guest Capacity
Guest Capacity Insights for Deep Creek
- The most common guest capacity trend in Deep Creek vacation rentals is listings accommodating 6 guests (52.6%). This suggests the primary traveler segment is likely larger groups.
- Properties designed for 6 guests and 4 guests dominate the Deep Creek STR market, accounting for 68.4% of listings.
- 73.6% of properties accommodate 6+ guests, serving the market segment for larger families or group travel in Deep Creek.
- On average, properties in Deep Creek are equipped to host 5.4 guests.
Deep Creek Airbnb Booking Patterns (2026): Available vs. Booked Days
Available Days Distribution
Booked Days Distribution
Booking Pattern Insights for Deep Creek
- The most common availability pattern in Deep Creek falls within the 271-366 days range, representing 68.4% of listings. This suggests many properties have significant open periods on their calendars.
- Approximately 89.5% of listings show high availability (181+ days open annually), indicating potential for increased bookings or specific owner usage patterns.
- For booked days, the 31-90 days range is most frequent in Deep Creek (36.8%), reflecting common guest stay durations or potential owner blocking patterns.
- A notable 10.5% of properties secure long booking periods (181+ days booked per year), highlighting successful long-term rental strategies or significant owner usage.
Deep Creek Airbnb Minimum Stay Requirements Analysis
Distribution of Listings by Minimum Night Requirement
1 Night
1 listings
5.3% of total
2 Nights
2 listings
10.5% of total
3 Nights
1 listings
5.3% of total
4-6 Nights
2 listings
10.5% of total
7-29 Nights
7 listings
36.8% of total
30+ Nights
6 listings
31.6% of total
Key Insights
- The most prevalent minimum stay requirement in Deep Creek is 7-29 Nights, adopted by 36.8% of listings. This highlights the market's preference for shorter, flexible bookings.
- Very short stays (1-2 nights) are less common (15.8%), suggesting hosts prefer slightly longer bookings to optimize turnover.
- A significant segment (31.6%) caters to monthly stays (30+ nights) in Deep Creek, pointing to opportunities in the extended-stay market.
Recommendations
- Align with the market by considering a 7-29 Nights minimum stay, as 36.8% of Deep Creek hosts use this setting.
- If feasible, allowing 1-night stays, especially midweek or during low season, could capture last-minute bookings, as only 5.3% currently do.
- Explore offering discounts for stays of 30+ nights to attract the 31.6% of the market seeking extended stays.
- Adjust minimum nights based on seasonality – potentially shorter during low season and longer during peak demand periods in Deep Creek.
Deep Creek Airbnb Cancellation Policy Trends Analysis (2026)
Flexible
3 listings
15.8% of total
Moderate
3 listings
15.8% of total
Firm
10 listings
52.6% of total
Strict
3 listings
15.8% of total
Cancellation Policy Insights for Deep Creek
- The prevailing Airbnb cancellation policy trend in Deep Creek is Firm, used by 52.6% of listings.
- A majority (68.4%) of hosts in Deep Creek utilize Firm or Strict policies, indicating a market where hosts prioritize booking security.
Recommendations for Hosts
- Consider adopting a Firm policy to align with the 52.6% market standard in Deep Creek.
- Regularly review your cancellation policy against competitors and market demand shifts in Deep Creek.
Deep Creek STR Booking Lead Time Analysis (2026)
Average Booking Lead Time by Month
Booking Lead Time Insights for Deep Creek
- The overall average booking lead time for vacation rentals in Deep Creek is 74 days.
- Guests book furthest in advance for stays during December (average 123 days), likely coinciding with peak travel demand or local events.
- The shortest booking windows occur for stays in September (average 14 days), indicating more last-minute travel plans during this time.
- Seasonally, Winter (114 days avg.) sees the longest lead times, while Fall (43 days avg.) has the shortest, reflecting typical travel planning cycles.
Recommendations for Hosts
- Use the overall average lead time (74 days) as a baseline for your pricing and availability strategy in Deep Creek.
- For December stays, consider implementing length-of-stay discounts or slightly higher rates for bookings made less than 123 days out to capitalize on advance planning.
- During September, focus on last-minute booking availability and promotions, as guests book with very short notice (14 days avg.).
- Target marketing efforts for the Winter season well in advance (at least 114 days) to capture early planners.
- Monitor your own booking lead times against these Deep Creek averages to identify opportunities for dynamic pricing adjustments.
Popular & Essential Airbnb Amenities in Deep Creek (2026)
Amenity Prevalence
Amenity Insights for Deep Creek
- Essential amenities in Deep Creek that guests expect include: Washer, Wifi, TV, Free parking on premises, Air conditioning, Coffee maker, Refrigerator. Lacking these (any) could significantly impact bookings.
- Popular amenities like Smoke alarm, Heating, Hangers are common but not universal. Offering these can provide a competitive edge.
Recommendations for Hosts
- Ensure your listing includes all essential amenities for Deep Creek: Washer, Wifi, TV, Free parking on premises, Air conditioning, Coffee maker, Refrigerator.
- Consider adding popular differentiators like Smoke alarm or Heating to increase appeal.
- Highlight unique or less common amenities you offer (e.g., hot tub, dedicated workspace, EV charger) in your listing description and photos.
- Regularly check competitor amenities in Deep Creek to stay competitive.
Deep Creek Airbnb Guest Demographics & Profile Analysis (2026)
Guest Profile Summary for Deep Creek
- The typical guest profile for Airbnb in Deep Creek consists of primarily domestic travelers (96%), often arriving from nearby Punta Gorda, typically belonging to the Post-2000s (Gen Z/Alpha) group (50%), primarily speaking English or Spanish.
- Domestic travelers account for 96.0% of guests.
- Key international markets include United States (96%) and China (2%).
- Top languages spoken are English (83.3%) followed by Spanish (8.3%).
- A significant demographic segment is the Post-2000s (Gen Z/Alpha) group, representing 50% of guests.
Recommendations for Hosts
- Target domestic marketing efforts towards travelers from Punta Gorda and Fort Lauderdale.
- Tailor amenities and listing descriptions to appeal to the dominant Post-2000s (Gen Z/Alpha) demographic (e.g., highlight fast WiFi, smart home features, local guides).
- Highlight unique local experiences or amenities relevant to the primary guest profile.
- Consider seasonal promotions aligned with peak travel times for key origin markets.
Nearby Short-Term Rental Market Comparison
How does the Deep Creek Airbnb market stack up against its neighbors? Compare key performance metrics like average monthly revenue, ADR, and occupancy rates in surrounding areas to understand the broader regional STR landscape.
| Market | Active Properties | Monthly Revenue | Daily Rate | Avg. Occupancy |
|---|---|---|---|---|
| Anna Maria island | 587 | $7,996 | $823.96 | 41% |
| Anna Maria | 56 | $6,434 | $692.96 | 52% |
| Reunion | 12 | $6,321 | $580.45 | 44% |
| Boca Grande | 31 | $6,128 | $787.07 | 37% |
| Indian Rocks Beach | 842 | $5,560 | $419.63 | 49% |
| Captiva | 291 | $5,443 | $667.40 | 36% |
| Siesta Key | 1,175 | $5,206 | $518.91 | 42% |
| Belleair Beach | 94 | $5,086 | $339.65 | 53% |
| Bradenton Beach | 122 | $4,977 | $507.12 | 42% |
| Thonotosassa | 17 | $4,309 | $347.75 | 50% |