Cudjoe Key Airbnb Market Analysis 2026: Short Term Rental Data & Vacation Rental Statistics in Florida, United States
Is Airbnb profitable in Cudjoe Key in 2026? Explore comprehensive Airbnb analytics for Cudjoe Key, Florida, United States to uncover income potential. This 2026 STR market report for Cudjoe Key, based on AirROI data from February 2025 to January 2026, reveals key trends in the niche market of 159 active listings.
Whether you're considering an Airbnb investment in Cudjoe Key, optimizing your existing vacation rental, or exploring rental arbitrage opportunities, understanding the Cudjoe Key Airbnb data is crucial. Leveraging the low regulation environment is key to maximizing your short term rental income potential. Let's dive into the specifics.
Key Cudjoe Key Airbnb Performance Metrics Overview
Monthly Airbnb Revenue Variations & Income Potential in Cudjoe Key (2026)
Understanding the monthly revenue variations for Airbnb listings in Cudjoe Key is key to maximizing your short term rental income potential. Seasonality significantly impacts earnings. Our analysis, based on data from the past 12 months, shows that the peak revenue month for STRs in Cudjoe Key is typically March, while September often presents the lowest earnings, highlighting opportunities for strategic pricing adjustments during shoulder and low seasons. Explore the typical Airbnb income in Cudjoe Key across different performance tiers:
- Best-in-class properties (Top 10%) achieve $11,335+ monthly, often utilizing dynamic pricing and superior guest experiences.
- Strong performing properties (Top 25%) earn $7,884 or more, indicating effective management and desirable locations/amenities.
- Typical properties (Median) generate around $4,933 per month, representing the average market performance.
- Entry-level properties (Bottom 25%) see earnings around $2,832, often with potential for optimization.
Average Monthly Airbnb Earnings Trend in Cudjoe Key
Cudjoe Key Airbnb Occupancy Rate Trends (2026)
Maximize your bookings by understanding the Cudjoe Key STR occupancy trends. Seasonal demand shifts significantly influence how often properties are booked. Typically, Marchsees the highest demand (peak season occupancy), while September experiences the lowest (low season). Effective strategies, like adjusting minimum stays or offering promotions, can boost occupancy during slower periods. Here's how different property tiers perform in Cudjoe Key:
- Best-in-class properties (Top 10%) achieve 82%+ occupancy, indicating high desirability and potentially optimized availability.
- Strong performing properties (Top 25%) maintain 66% or higher occupancy, suggesting good market fit and guest satisfaction.
- Typical properties (Median) have an occupancy rate around 48%.
- Entry-level properties (Bottom 25%) average 30% occupancy, potentially facing higher vacancy.
Average Monthly Occupancy Rate Trend in Cudjoe Key
Average Daily Rate (ADR) Airbnb Trends in Cudjoe Key (2026)
Effective short term rental pricing strategy in Cudjoe Key involves understanding monthly ADR fluctuations. The Average Daily Rate (ADR) for Airbnb in Cudjoe Key typically peaks in January and dips lowest during September. Leveraging Airbnb dynamic pricing tools or strategies based on this seasonality can significantly boost revenue. Here's a look at the typical nightly rates achieved:
- Best-in-class properties (Top 10%) command rates of $543+ per night, often due to premium features or locations.
- Strong performing properties (Top 25%) achieve nightly rates of $422 or more.
- Typical properties (Median) charge around $329 per night.
- Entry-level properties (Bottom 25%) earn around $262 per night.
Average Daily Rate (ADR) Trend by Month in Cudjoe Key
Get Live Cudjoe Key Market Intelligence 👇

Explore Real-time Analytics
Airbnb Seasonality Analysis & Trends in Cudjoe Key (2026)
Peak Season (March, February, January)
- Revenue averages $8,072 per month
- Occupancy rates average 65.2%
- Daily rates average $374
Shoulder Season
- Revenue averages $5,749 per month
- Occupancy maintains around 47.6%
- Daily rates hold near $359
Low Season (August, September, October)
- Revenue drops to average $3,820 per month
- Occupancy decreases to average 31.2%
- Daily rates adjust to average $352
Seasonality Insights for Cudjoe Key
- The Airbnb seasonality in Cudjoe Key shows highly seasonal trends requiring careful strategy. While the sections above show seasonal averages, it's also insightful to look at the extremes:
- During the high season, the absolute peak month showcases Cudjoe Key's highest earning potential, with monthly revenues capable of climbing to $9,086, occupancy reaching a high of 74.7%, and ADRs peaking at $402.
- Conversely, the slowest single month of the year, typically falling within the low season, marks the market's lowest point. In this month, revenue might dip to $3,158, occupancy could drop to 26.6%, and ADRs may adjust down to $339.
- Understanding both the seasonal averages and these monthly peaks and troughs in revenue, occupancy, and ADR is crucial for maximizing your Airbnb profit potential in Cudjoe Key.
Seasonal Strategies for Maximizing Profit
- Peak Season: Maximize revenue through premium pricing and potentially longer minimum stays. Ensure high availability.
- Low Season: Offer competitive pricing, special promotions (e.g., extended stay discounts), and flexible cancellation policies. Target off-season travelers like remote workers or budget-conscious guests.
- Shoulder Seasons: Implement dynamic pricing that balances peak and low rates. Target weekend travelers or specific events. Offer slightly more flexible terms than peak season.
- Regularly analyze your own performance against these Cudjoe Key seasonality benchmarks and adjust your pricing and availability strategy accordingly.
Best Areas for Airbnb Investment in Cudjoe Key (2026)
Exploring the top neighborhoods for short-term rentals in Cudjoe Key? This section highlights key areas, outlining why they are attractive for hosts and guests, along with notable local attractions. Consider these locations based on your target guest profile and investment strategy.
| Neighborhood / Area | Why Host Here? (Target Guests & Appeal) | Key Attractions & Landmarks |
|---|---|---|
| Cudjoe Key | A serene and picturesque island community in the Florida Keys, ideal for relaxation and water-based activities. Known for its beautiful waterfront properties and lush greenery, making it a top choice for vacation rentals. | Bahaia Honda State Park, Cudjoe Key Fishing, Looe Key National Marine Sanctuary, Snorkeling and Diving Spots, Restaurants with waterfront views |
| Sugarloaf Key | Just a short drive from Cudjoe Key, Sugarloaf Key offers a laid-back atmosphere with access to beautiful beaches and nature trails. Popular with those looking for a quiet getaway with family-friendly activities. | Sugarloaf Key Bat Tower, Sugarloaf Beach, Kayaking and Paddleboarding, Nature Trails, Fishing Spots |
| Big Pine Key | Known for its natural beauty and wildlife, Big Pine Key is home to the National Key Deer Refuge. Offers unique outdoor activities and a chance to see the endangered Key deer, appealing to nature lovers and ecotourists. | National Key Deer Refuge, Blue Hole, Bahia Honda State Park, Key West Kayak Tours, Fishing and Eco-Tours |
| Key West | A world-renowned destination famous for its vibrant culture, historic sites, and nightlife. As the southernmost point in the continental U.S., it attracts a large number of tourists year-round, making it a prime area for Airbnb investments. | Duval Street, Ernest Hemingway Home and Museum, Mallory Square, Key West Butterfly and Nature Conservatory, Fort Zachary Taylor Historic State Park |
| Little Torch Key | Offers a mix of tranquility and adventure with its beautiful resorts and outdoor activities. Popular for family vacations and couples looking for a romantic escape with access to water sports. | Newfound Harbor Marine Sanctuary, Little Torch Key Beach, Dolphin Encounters, Fishing and Snorkeling, Scenic Boat Rides |
| Marathon | A family-friendly destination with plenty of amenities, restaurants, and activities. It's positioned in the middle of the Florida Keys, allowing for easy travel to other locations, and is ideal for multi-family vacation rentals. | Seven Mile Bridge, The Turtle Hospital, Sombrero Beach, Crane Point Museum and Nature Center, Marathon Reflections |
| Duck Key | A beautiful resort area offering a variety of water activities such as fishing, boating, and paddleboarding. Attracts both adventure seekers and those looking for a relaxed resort experience. | Duck Key Marina, Watersports Rentals, Resort Amenities, Fishing Charters, Scenic Views |
| Key Largo | Known for its diving spots and proximity to the Everglades. A top destination for water sports enthusiasts, including scuba diving and snorkeling, appealing to a wide range of tourists. | John Pennekamp Coral Reef State Park, Diving and Snorkeling Tours, Key Largo Undersea Park, Everglades National Park, Restaurants and Bars |
Understanding Airbnb License Requirements & STR Laws in Cudjoe Key (2026)
While Cudjoe Key, Florida, United States currently shows low STR regulations, specific Airbnb license requirements might still exist or change. Always verify the latest short term rental regulations and Airbnb license requirements directly with local government authorities for Cudjoe Key to ensure full compliance before hosting.
(Source: AirROI data, 2026, finding no licensed listings among those analyzed)
Top Performing Airbnb Properties in Cudjoe Key (2026)
Benchmark your potential! Explore examples of top-performing Airbnb properties in Cudjoe Keybased on Trailing Twelve Month (TTM) revenue. Analyze their characteristics, revenue, occupancy rate, and ADR to understand what drives success in this market.
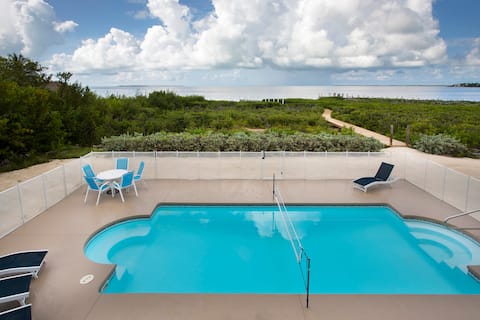
Palm Breezes! Room for Everyone on the Ocean.
Entire Place • 5 bedrooms
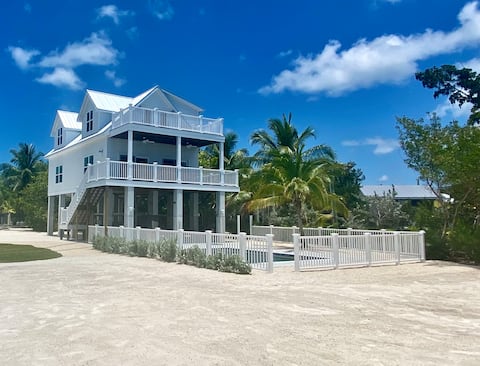
Latitudes-Ocean Front Pool
Entire Place • 6 bedrooms
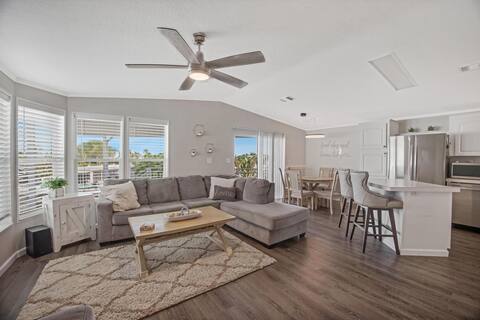
Waterfront Sanctuary in the Keys!
Entire Place • 2 bedrooms

*Emerald Seas*-Florida Keys Ocean Front Paradise!
Entire Place • 2 bedrooms
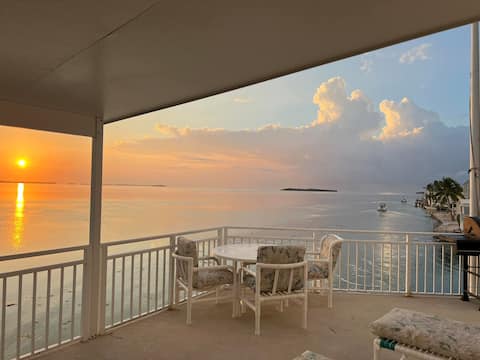
Rise And Shine On The Water
Entire Place • 2 bedrooms

King MSTR, SS Quartz Kitchen, Bikes Kayaks, VIEWS!
Entire Place • 2 bedrooms
Note: Performance varies based on location, size, amenities, seasonality, and management quality. Data reflects the past 12 months.
Top Performing Airbnb Hosts in Cudjoe Key (2026)
Learn from the best! This table showcases top-performing Airbnb hosts in Cudjoe Key based on the number of properties managed and estimated total revenue over the past year. Analyze their scale and performance metrics.
| Host Name | Properties | Grossing Revenue | Stay Reviews | Avg Rating |
|---|---|---|---|---|
| Bluescape | 30 | $1,166,561 | 182 | 4.86/5.0 |
| Amy T | 5 | $558,096 | 63 | 4.69/5.0 |
| Mitch Mitchell | 4 | $489,101 | 141 | 4.89/5.0 |
| Last Key | 4 | $392,087 | 154 | 4.91/5.0 |
| Waterfront Keys | 12 | $376,347 | 78 | 4.52/5.0 |
| John | 3 | $290,903 | 73 | 4.95/5.0 |
| Manuel | 3 | $278,196 | 332 | 4.83/5.0 |
| Janet & Jerry | 2 | $226,972 | 609 | 4.78/5.0 |
| John | 1 | $205,273 | 102 | 4.81/5.0 |
| Christopher | 1 | $165,738 | 131 | 4.88/5.0 |
Analyzing the strategies of top hosts, such as their property selection, pricing, and guest communication, can offer valuable lessons for optimizing your own Airbnb operations in Cudjoe Key.
Dive Deeper: Advanced Cudjoe Key STR Market Data (2026)
Ready to unlock more insights? AirROI provides access to advanced metrics and comprehensive Airbnb data for Cudjoe Key. Explore detailed analytics beyond this report to refine your investment strategy, optimize pricing, and maximize your vacation rental profits.
Explore Advanced MetricsCudjoe Key Short-Term Rental Market Composition (2026): Property & Room Types
Room Type Distribution
Property Type Distribution
Market Composition Insights for Cudjoe Key
- The Cudjoe Key Airbnb market composition is heavily skewed towards Entire Home/Apt listings, which make up 100% of the 159 active rentals. This indicates strong guest preference for privacy and space.
- Looking at the property type distribution in Cudjoe Key, House properties are the most common (93.1%), reflecting the local real estate landscape.
- Houses represent a significant 93.1% portion, catering likely to families or larger groups.
- Smaller segments like others, hotel/boutique, unique stays (combined 1.8%) offer potential for unique stay experiences.
Cudjoe Key Airbnb Room Capacity Analysis (2026): Bedroom Distribution
Distribution of Listings by Number of Bedrooms
Room Capacity Insights for Cudjoe Key
- The dominant room capacity in Cudjoe Key is 2 bedrooms listings, making up 68.6% of the market. This suggests a strong demand for properties suitable for couples or solo travelers.
- Together, 2 bedrooms and 1 bedroom properties represent 81.2% of the active Airbnb listings in Cudjoe Key, indicating a high concentration in these sizes.
Cudjoe Key Vacation Rental Guest Capacity Trends (2026)
Distribution of Listings by Guest Capacity
Guest Capacity Insights for Cudjoe Key
- The most common guest capacity trend in Cudjoe Key vacation rentals is listings accommodating 6 guests (55.3%). This suggests the primary traveler segment is likely larger groups.
- Properties designed for 6 guests and 4 guests dominate the Cudjoe Key STR market, accounting for 82.3% of listings.
- 67.3% of properties accommodate 6+ guests, serving the market segment for larger families or group travel in Cudjoe Key.
- On average, properties in Cudjoe Key are equipped to host 5.6 guests.
Cudjoe Key Airbnb Booking Patterns (2026): Available vs. Booked Days
Available Days Distribution
Booked Days Distribution
Booking Pattern Insights for Cudjoe Key
- The most common availability pattern in Cudjoe Key falls within the 271-366 days range, representing 37.7% of listings. This suggests many properties have significant open periods on their calendars.
- Approximately 74.8% of listings show high availability (181+ days open annually), indicating potential for increased bookings or specific owner usage patterns.
- For booked days, the 91-180 days range is most frequent in Cudjoe Key (39%), reflecting common guest stay durations or potential owner blocking patterns.
- A notable 27.1% of properties secure long booking periods (181+ days booked per year), highlighting successful long-term rental strategies or significant owner usage.
Cudjoe Key Airbnb Minimum Stay Requirements Analysis
Distribution of Listings by Minimum Night Requirement
1 Night
11 listings
6.9% of total
2 Nights
14 listings
8.8% of total
3 Nights
19 listings
11.9% of total
4-6 Nights
15 listings
9.4% of total
7-29 Nights
18 listings
11.3% of total
30+ Nights
82 listings
51.6% of total
Key Insights
- The most prevalent minimum stay requirement in Cudjoe Key is 30+ Nights, adopted by 51.6% of listings. This highlights the market's preference for longer commitments.
- Very short stays (1-2 nights) are less common (15.7%), suggesting hosts prefer slightly longer bookings to optimize turnover.
- A significant segment (51.6%) caters to monthly stays (30+ nights) in Cudjoe Key, pointing to opportunities in the extended-stay market.
Recommendations
- Align with the market by considering a 30+ Nights minimum stay, as 51.6% of Cudjoe Key hosts use this setting.
- If feasible, allowing 1-night stays, especially midweek or during low season, could capture last-minute bookings, as only 6.9% currently do.
- Explore offering discounts for stays of 30+ nights to attract the 51.6% of the market seeking extended stays.
- Adjust minimum nights based on seasonality – potentially shorter during low season and longer during peak demand periods in Cudjoe Key.
Cudjoe Key Airbnb Cancellation Policy Trends Analysis (2026)
Super Strict 30 Days
5 listings
3.2% of total
Limited
2 listings
1.3% of total
Super Strict 60 Days
36 listings
22.9% of total
Flexible
5 listings
3.2% of total
Moderate
16 listings
10.2% of total
Firm
75 listings
47.8% of total
Strict
18 listings
11.5% of total
Cancellation Policy Insights for Cudjoe Key
- The prevailing Airbnb cancellation policy trend in Cudjoe Key is Firm, used by 47.8% of listings.
- A majority (59.3%) of hosts in Cudjoe Key utilize Firm or Strict policies, indicating a market where hosts prioritize booking security.
Recommendations for Hosts
- Consider adopting a Firm policy to align with the 47.8% market standard in Cudjoe Key.
- Using a Strict policy might deter some guests, as only 11.5% of listings use it. Evaluate if potential revenue protection outweighs possible lower booking rates.
- Regularly review your cancellation policy against competitors and market demand shifts in Cudjoe Key.
Cudjoe Key STR Booking Lead Time Analysis (2026)
Average Booking Lead Time by Month
Booking Lead Time Insights for Cudjoe Key
- The overall average booking lead time for vacation rentals in Cudjoe Key is 86 days.
- Guests book furthest in advance for stays during February (average 109 days), likely coinciding with peak travel demand or local events.
- The shortest booking windows occur for stays in September (average 49 days), indicating more last-minute travel plans during this time.
- Seasonally, Winter (103 days avg.) sees the longest lead times, while Fall (59 days avg.) has the shortest, reflecting typical travel planning cycles.
Recommendations for Hosts
- Use the overall average lead time (86 days) as a baseline for your pricing and availability strategy in Cudjoe Key.
- For February stays, consider implementing length-of-stay discounts or slightly higher rates for bookings made less than 109 days out to capitalize on advance planning.
- Target marketing efforts for the Winter season well in advance (at least 103 days) to capture early planners.
- Monitor your own booking lead times against these Cudjoe Key averages to identify opportunities for dynamic pricing adjustments.
Popular & Essential Airbnb Amenities in Cudjoe Key (2026)
Amenity Prevalence
Amenity Insights for Cudjoe Key
- Essential amenities in Cudjoe Key that guests expect include: Wifi, Air conditioning. Lacking these (any) could significantly impact bookings.
- Popular amenities like TV, Washer, Kitchen are common but not universal. Offering these can provide a competitive edge.
- A pool is a highly desired but not standard amenity, making it a key feature for attracting guests seeking leisure in Cudjoe Key.
Recommendations for Hosts
- Ensure your listing includes all essential amenities for Cudjoe Key: Wifi, Air conditioning.
- Prioritize adding missing essentials: Wifi, Air conditioning.
- Consider adding popular differentiators like TV or Washer to increase appeal.
- Highlight unique or less common amenities you offer (e.g., hot tub, dedicated workspace, EV charger) in your listing description and photos.
- Regularly check competitor amenities in Cudjoe Key to stay competitive.
Cudjoe Key Airbnb Guest Demographics & Profile Analysis (2026)
Guest Profile Summary for Cudjoe Key
- The typical guest profile for Airbnb in Cudjoe Key consists of primarily domestic travelers (95%), often arriving from nearby Miami, typically belonging to the Post-2000s (Gen Z/Alpha) group (50%), primarily speaking English or Spanish.
- Domestic travelers account for 94.7% of guests.
- Key international markets include United States (94.7%) and France (0.8%).
- Top languages spoken are English (70.5%) followed by Spanish (14.2%).
- A significant demographic segment is the Post-2000s (Gen Z/Alpha) group, representing 50% of guests.
Recommendations for Hosts
- Target domestic marketing efforts towards travelers from Miami and Jacksonville.
- Tailor amenities and listing descriptions to appeal to the dominant Post-2000s (Gen Z/Alpha) demographic (e.g., highlight fast WiFi, smart home features, local guides).
- Highlight unique local experiences or amenities relevant to the primary guest profile.
- Consider seasonal promotions aligned with peak travel times for key origin markets.
Nearby Short-Term Rental Market Comparison
How does the Cudjoe Key Airbnb market stack up against its neighbors? Compare key performance metrics like average monthly revenue, ADR, and occupancy rates in surrounding areas to understand the broader regional STR landscape.
| Market | Active Properties | Monthly Revenue | Daily Rate | Avg. Occupancy |
|---|---|---|---|---|
| Stock Island | 107 | $9,731 | $733.54 | 47% |
| Bal Harbour Village | 37 | $8,846 | $850.63 | 34% |
| Key West | 1,137 | $7,525 | $630.09 | 47% |
| Pinecrest | 11 | $6,117 | $861.24 | 43% |
| North Bay Village | 120 | $6,032 | $561.12 | 44% |
| Duck Key | 60 | $5,308 | $504.94 | 43% |
| Little Torch Key | 20 | $5,131 | $701.83 | 29% |
| Marathon | 987 | $4,795 | $489.03 | 42% |
| Key Biscayne | 104 | $4,470 | $448.61 | 49% |
| Miami Shores | 90 | $4,360 | $453.13 | 47% |