Crystal River Airbnb Market Analysis 2026: Short Term Rental Data & Vacation Rental Statistics in Florida, United States
Is Airbnb profitable in Crystal River in 2026? Explore comprehensive Airbnb analytics for Crystal River, Florida, United States to uncover income potential. This 2026 STR market report for Crystal River, based on AirROI data from February 2025 to January 2026, reveals key trends in the market of 261 active listings.
Whether you're considering an Airbnb investment in Crystal River, optimizing your existing vacation rental, or exploring rental arbitrage opportunities, understanding the Crystal River Airbnb data is crucial. Leveraging the low regulation environment is key to maximizing your short term rental income potential. Let's dive into the specifics.
Key Crystal River Airbnb Performance Metrics Overview
Monthly Airbnb Revenue Variations & Income Potential in Crystal River (2026)
Understanding the monthly revenue variations for Airbnb listings in Crystal River is key to maximizing your short term rental income potential. Seasonality significantly impacts earnings. Our analysis, based on data from the past 12 months, shows that the peak revenue month for STRs in Crystal River is typically July, while September often presents the lowest earnings, highlighting opportunities for strategic pricing adjustments during shoulder and low seasons. Explore the typical Airbnb income in Crystal River across different performance tiers:
- Best-in-class properties (Top 10%) achieve $6,625+ monthly, often utilizing dynamic pricing and superior guest experiences.
- Strong performing properties (Top 25%) earn $4,569 or more, indicating effective management and desirable locations/amenities.
- Typical properties (Median) generate around $2,821 per month, representing the average market performance.
- Entry-level properties (Bottom 25%) see earnings around $1,596, often with potential for optimization.
Average Monthly Airbnb Earnings Trend in Crystal River
Crystal River Airbnb Occupancy Rate Trends (2026)
Maximize your bookings by understanding the Crystal River STR occupancy trends. Seasonal demand shifts significantly influence how often properties are booked. Typically, Marchsees the highest demand (peak season occupancy), while September experiences the lowest (low season). Effective strategies, like adjusting minimum stays or offering promotions, can boost occupancy during slower periods. Here's how different property tiers perform in Crystal River:
- Best-in-class properties (Top 10%) achieve 77%+ occupancy, indicating high desirability and potentially optimized availability.
- Strong performing properties (Top 25%) maintain 64% or higher occupancy, suggesting good market fit and guest satisfaction.
- Typical properties (Median) have an occupancy rate around 45%.
- Entry-level properties (Bottom 25%) average 26% occupancy, potentially facing higher vacancy.
Average Monthly Occupancy Rate Trend in Crystal River
Average Daily Rate (ADR) Airbnb Trends in Crystal River (2026)
Effective short term rental pricing strategy in Crystal River involves understanding monthly ADR fluctuations. The Average Daily Rate (ADR) for Airbnb in Crystal River typically peaks in December and dips lowest during April. Leveraging Airbnb dynamic pricing tools or strategies based on this seasonality can significantly boost revenue. Here's a look at the typical nightly rates achieved:
- Best-in-class properties (Top 10%) command rates of $398+ per night, often due to premium features or locations.
- Strong performing properties (Top 25%) achieve nightly rates of $290 or more.
- Typical properties (Median) charge around $202 per night.
- Entry-level properties (Bottom 25%) earn around $150 per night.
Average Daily Rate (ADR) Trend by Month in Crystal River
Get Live Crystal River Market Intelligence 👇

Explore Real-time Analytics
Airbnb Seasonality Analysis & Trends in Crystal River (2026)
Peak Season (July, March, February)
- Revenue averages $4,775 per month
- Occupancy rates average 63.5%
- Daily rates average $235
Shoulder Season
- Revenue averages $3,161 per month
- Occupancy maintains around 41.9%
- Daily rates hold near $236
Low Season (September, October, November)
- Revenue drops to average $2,463 per month
- Occupancy decreases to average 33.9%
- Daily rates adjust to average $238
Seasonality Insights for Crystal River
- The Airbnb seasonality in Crystal River shows highly seasonal trends requiring careful strategy. While the sections above show seasonal averages, it's also insightful to look at the extremes:
- During the high season, the absolute peak month showcases Crystal River's highest earning potential, with monthly revenues capable of climbing to $5,049, occupancy reaching a high of 67.7%, and ADRs peaking at $246.
- Conversely, the slowest single month of the year, typically falling within the low season, marks the market's lowest point. In this month, revenue might dip to $2,336, occupancy could drop to 31.4%, and ADRs may adjust down to $223.
- Understanding both the seasonal averages and these monthly peaks and troughs in revenue, occupancy, and ADR is crucial for maximizing your Airbnb profit potential in Crystal River.
Seasonal Strategies for Maximizing Profit
- Peak Season: Maximize revenue through premium pricing and potentially longer minimum stays. Ensure high availability.
- Low Season: Offer competitive pricing, special promotions (e.g., extended stay discounts), and flexible cancellation policies. Target off-season travelers like remote workers or budget-conscious guests.
- Shoulder Seasons: Implement dynamic pricing that balances peak and low rates. Target weekend travelers or specific events. Offer slightly more flexible terms than peak season.
- Regularly analyze your own performance against these Crystal River seasonality benchmarks and adjust your pricing and availability strategy accordingly.
Best Areas for Airbnb Investment in Crystal River (2026)
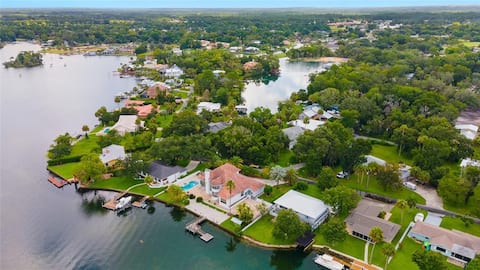
Exploring the top neighborhoods for short-term rentals in Crystal River? This section highlights key areas, outlining why they are attractive for hosts and guests, along with notable local attractions. Consider these locations based on your target guest profile and investment strategy.
| Neighborhood / Area | Why Host Here? (Target Guests & Appeal) | Key Attractions & Landmarks |
|---|---|---|
| Crystal River Historic District | Charming area with historic buildings, local shops, and restaurants. Attracts visitors interested in local history and culture, perfect for families and couples. | Crystal River Archaeological State Park, Historic downtown Crystal River, Local art galleries, Dining at local seafood restaurants, Riverwalk Park |
| Hunter Springs Park | Popular spot for swimming and kayaking, offering scenic views and recreational activities. Ideal for nature lovers and outdoor enthusiasts. | Hunter Springs Park, Kayaking and paddleboarding, Manatee encounters, Fishing and picnicking spots, Scenic walking trails |
| Chassahowitzka National Wildlife Refuge | Abundant wildlife and natural beauty, great for eco-tourism. Perfect for those who love camping, bird watching, and kayaking in serene surroundings. | Bird watching, Kayak tours, Nature trails, Wildlife observation, Scenic river views |
| Crystal River Preserve State Park | Offers diverse ecosystems and outdoor activities. A great place for visitors looking to explore Florida's natural beauty and wildlife. | Hiking trails, Wildlife viewing, Fishing, Biking, Boat tours |
| Three Sisters Springs | Famous for its clear springs and manatee viewing. A must-visit for tourists and families wanting to experience Florida's wildlife up close. | Manatee watching, Swimming in crystal-clear waters, Nature trails, Photography opportunities, Guided tours |
| Fort Island Gulf Beach | Beautiful beach destination for sunbathing and relaxation, providing a peaceful alternative to crowded tourist areas. | Beach access, Fishing pier, Picnic areas, Nature trails, Spectacular sunsets |
| Salt River Bay | Less traveled area offering tranquility and natural beauty. Ideal for anyone seeking a quiet getaway while still close to attractions. | Kayak and canoe launches, Wildlife habitats, Fishing spots, Picnic areas, Scenic surroundings |
| Citrus County Art Center | Cultural hub of the area featuring local art and workshops. Attracts visitors interested in arts and crafts. | Art exhibitions, Workshops, Cultural events, Artist showcases, Local crafts and goods |
Understanding Airbnb License Requirements & STR Laws in Crystal River (2026)
While Crystal River, Florida, United States currently shows low STR regulations, specific Airbnb license requirements might still exist or change. Always verify the latest short term rental regulations and Airbnb license requirements directly with local government authorities for Crystal River to ensure full compliance before hosting.
(Source: AirROI data, 2026, finding no licensed listings among those analyzed)
Top Performing Airbnb Properties in Crystal River (2026)
Benchmark your potential! Explore examples of top-performing Airbnb properties in Crystal Riverbased on Trailing Twelve Month (TTM) revenue. Analyze their characteristics, revenue, occupancy rate, and ADR to understand what drives success in this market.

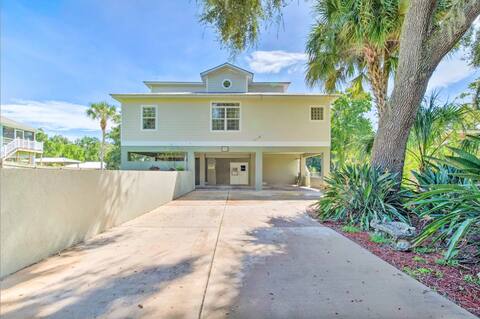
Crystal River Waterfront w/Dock, Pool & Manatees!
Entire Place • 4 bedrooms

Island home on Kings Bay - manatees at the dock!
Entire Place • 4 bedrooms

Expansive Crystal River waterfront estate
Entire Place • 7 bedrooms
Crystal River Manatee Palace Waterfront HeatedPool
Entire Place • 4 bedrooms
Canal-Front Home on 73ft Dock!
Entire Place • 4 bedrooms

Canal Home|Pool|Dock|Firepit|Dog OK|Sleeps9|Patio
Entire Place • 3 bedrooms
Note: Performance varies based on location, size, amenities, seasonality, and management quality. Data reflects the past 12 months.
Top Performing Airbnb Hosts in Crystal River (2026)
Learn from the best! This table showcases top-performing Airbnb hosts in Crystal River based on the number of properties managed and estimated total revenue over the past year. Analyze their scale and performance metrics.
| Host Name | Properties | Grossing Revenue | Stay Reviews | Avg Rating |
|---|---|---|---|---|
| Evolve | 22 | $703,620 | 945 | 4.83/5.0 |
| Brit | 5 | $266,840 | 31 | 5.00/5.0 |
| Vicki | 5 | $258,720 | 333 | 5.00/5.0 |
| Robyn | 4 | $194,252 | 160 | 4.95/5.0 |
| Jason & Sarah | 1 | $154,332 | 86 | 4.95/5.0 |
| Mimi | 3 | $142,046 | 121 | 4.97/5.0 |
| Michael | 1 | $140,044 | 35 | 4.77/5.0 |
| Jennifer | 2 | $134,110 | 235 | 4.96/5.0 |
| Johnnie | 2 | $126,216 | 272 | 4.95/5.0 |
| Charity | 2 | $122,513 | 107 | 4.97/5.0 |
Analyzing the strategies of top hosts, such as their property selection, pricing, and guest communication, can offer valuable lessons for optimizing your own Airbnb operations in Crystal River.
Dive Deeper: Advanced Crystal River STR Market Data (2026)
Ready to unlock more insights? AirROI provides access to advanced metrics and comprehensive Airbnb data for Crystal River. Explore detailed analytics beyond this report to refine your investment strategy, optimize pricing, and maximize your vacation rental profits.
Explore Advanced MetricsCrystal River Short-Term Rental Market Composition (2026): Property & Room Types
Room Type Distribution
Property Type Distribution
Market Composition Insights for Crystal River
- The Crystal River Airbnb market composition is heavily skewed towards Entire Home/Apt listings, which make up 98.5% of the 261 active rentals. This indicates strong guest preference for privacy and space.
- Looking at the property type distribution in Crystal River, House properties are the most common (84.3%), reflecting the local real estate landscape.
- Houses represent a significant 84.3% portion, catering likely to families or larger groups.
- Smaller segments like outdoor/unique, others, hotel/boutique, unique stays (combined 5.4%) offer potential for unique stay experiences.
Crystal River Airbnb Room Capacity Analysis (2026): Bedroom Distribution
Distribution of Listings by Number of Bedrooms
Room Capacity Insights for Crystal River
- The dominant room capacity in Crystal River is 3 bedrooms listings, making up 40.6% of the market. This suggests a strong demand for properties suitable for families or small groups.
- Together, 3 bedrooms and 2 bedrooms properties represent 67.8% of the active Airbnb listings in Crystal River, indicating a high concentration in these sizes.
- A significant 53.2% of listings offer 3+ bedrooms, catering to larger groups and families seeking more space in Crystal River.
Crystal River Vacation Rental Guest Capacity Trends (2026)
Distribution of Listings by Guest Capacity
Guest Capacity Insights for Crystal River
- The most common guest capacity trend in Crystal River vacation rentals is listings accommodating 8+ guests (34.5%). This suggests the primary traveler segment is likely larger groups.
- Properties designed for 8+ guests and 6 guests dominate the Crystal River STR market, accounting for 62.9% of listings.
- 67.1% of properties accommodate 6+ guests, serving the market segment for larger families or group travel in Crystal River.
- On average, properties in Crystal River are equipped to host 6.0 guests.
Crystal River Airbnb Booking Patterns (2026): Available vs. Booked Days
Available Days Distribution
Booked Days Distribution
Booking Pattern Insights for Crystal River
- The most common availability pattern in Crystal River falls within the 181-270 days range, representing 44.1% of listings. This suggests many properties have significant open periods on their calendars.
- Approximately 78.2% of listings show high availability (181+ days open annually), indicating potential for increased bookings or specific owner usage patterns.
- For booked days, the 91-180 days range is most frequent in Crystal River (45.2%), reflecting common guest stay durations or potential owner blocking patterns.
- A notable 23.0% of properties secure long booking periods (181+ days booked per year), highlighting successful long-term rental strategies or significant owner usage.
Crystal River Airbnb Minimum Stay Requirements Analysis
Distribution of Listings by Minimum Night Requirement
1 Night
41 listings
15.7% of total
2 Nights
75 listings
28.7% of total
3 Nights
40 listings
15.3% of total
4-6 Nights
11 listings
4.2% of total
7-29 Nights
4 listings
1.5% of total
30+ Nights
90 listings
34.5% of total
Key Insights
- The most prevalent minimum stay requirement in Crystal River is 30+ Nights, adopted by 34.5% of listings. This highlights the market's preference for longer commitments.
- A significant segment (34.5%) caters to monthly stays (30+ nights) in Crystal River, pointing to opportunities in the extended-stay market.
Recommendations
- Align with the market by considering a 30+ Nights minimum stay, as 34.5% of Crystal River hosts use this setting.
- If feasible, allowing 1-night stays, especially midweek or during low season, could capture last-minute bookings, as only 15.7% currently do.
- Explore offering discounts for stays of 30+ nights to attract the 34.5% of the market seeking extended stays.
- Adjust minimum nights based on seasonality – potentially shorter during low season and longer during peak demand periods in Crystal River.
Crystal River Airbnb Cancellation Policy Trends Analysis (2026)
Super Strict 30 Days
3 listings
1.1% of total
Limited
5 listings
1.9% of total
Super Strict 60 Days
1 listings
0.4% of total
Flexible
46 listings
17.6% of total
Moderate
79 listings
30.3% of total
Firm
91 listings
34.9% of total
Strict
36 listings
13.8% of total
Cancellation Policy Insights for Crystal River
- The prevailing Airbnb cancellation policy trend in Crystal River is Firm, used by 34.9% of listings.
- There's a relatively balanced mix between guest-friendly (47.9%) and stricter (48.7%) policies, offering choices for different guest needs.
Recommendations for Hosts
- Consider adopting a Firm policy to align with the 34.9% market standard in Crystal River.
- Using a Strict policy might deter some guests, as only 13.8% of listings use it. Evaluate if potential revenue protection outweighs possible lower booking rates.
- Regularly review your cancellation policy against competitors and market demand shifts in Crystal River.
Crystal River STR Booking Lead Time Analysis (2026)
Average Booking Lead Time by Month
Booking Lead Time Insights for Crystal River
- The overall average booking lead time for vacation rentals in Crystal River is 56 days.
- Guests book furthest in advance for stays during February (average 88 days), likely coinciding with peak travel demand or local events.
- The shortest booking windows occur for stays in September (average 34 days), indicating more last-minute travel plans during this time.
- Seasonally, Winter (67 days avg.) sees the longest lead times, while Fall (45 days avg.) has the shortest, reflecting typical travel planning cycles.
Recommendations for Hosts
- Use the overall average lead time (56 days) as a baseline for your pricing and availability strategy in Crystal River.
- For February stays, consider implementing length-of-stay discounts or slightly higher rates for bookings made less than 88 days out to capitalize on advance planning.
- Target marketing efforts for the Winter season well in advance (at least 67 days) to capture early planners.
- Monitor your own booking lead times against these Crystal River averages to identify opportunities for dynamic pricing adjustments.
Popular & Essential Airbnb Amenities in Crystal River (2026)
Amenity Prevalence
Amenity Insights for Crystal River
- Essential amenities in Crystal River that guests expect include: Air conditioning, TV, Smoke alarm, Wifi, Free parking on premises, Kitchen. Lacking these (any) could significantly impact bookings.
- Popular amenities like Heating, Hot water, Fire extinguisher are common but not universal. Offering these can provide a competitive edge.
Recommendations for Hosts
- Ensure your listing includes all essential amenities for Crystal River: Air conditioning, TV, Smoke alarm, Wifi, Free parking on premises, Kitchen.
- Prioritize adding missing essentials: Air conditioning, TV, Smoke alarm, Wifi, Free parking on premises, Kitchen.
- Consider adding popular differentiators like Heating or Hot water to increase appeal.
- Highlight unique or less common amenities you offer (e.g., hot tub, dedicated workspace, EV charger) in your listing description and photos.
- Regularly check competitor amenities in Crystal River to stay competitive.
Crystal River Airbnb Guest Demographics & Profile Analysis (2026)
Guest Profile Summary for Crystal River
- The typical guest profile for Airbnb in Crystal River consists of primarily domestic travelers (94%), often arriving from nearby Tampa, typically belonging to the Post-2000s (Gen Z/Alpha) group (50%), primarily speaking English or Spanish.
- Domestic travelers account for 94.0% of guests.
- Key international markets include United States (94%) and United Kingdom (1.3%).
- Top languages spoken are English (68.8%) followed by Spanish (10.4%).
- A significant demographic segment is the Post-2000s (Gen Z/Alpha) group, representing 50% of guests.
Recommendations for Hosts
- Target domestic marketing efforts towards travelers from Tampa and Orlando.
- Tailor amenities and listing descriptions to appeal to the dominant Post-2000s (Gen Z/Alpha) demographic (e.g., highlight fast WiFi, smart home features, local guides).
- Highlight unique local experiences or amenities relevant to the primary guest profile.
- Consider seasonal promotions aligned with peak travel times for key origin markets.
Nearby Short-Term Rental Market Comparison
How does the Crystal River Airbnb market stack up against its neighbors? Compare key performance metrics like average monthly revenue, ADR, and occupancy rates in surrounding areas to understand the broader regional STR landscape.
| Market | Active Properties | Monthly Revenue | Daily Rate | Avg. Occupancy |
|---|---|---|---|---|
| Anna Maria island | 587 | $7,996 | $823.96 | 41% |
| Anna Maria | 56 | $6,434 | $692.96 | 52% |
| Reunion | 12 | $6,321 | $580.45 | 44% |
| Vilano Beach | 173 | $5,571 | $442.95 | 45% |
| Indian Rocks Beach | 842 | $5,560 | $419.63 | 49% |
| Siesta Key | 1,175 | $5,206 | $518.91 | 42% |
| Belleair Beach | 94 | $5,086 | $339.65 | 53% |
| Bradenton Beach | 122 | $4,977 | $507.12 | 42% |
| Thonotosassa | 17 | $4,309 | $347.75 | 50% |
| Seminole | 519 | $4,223 | $316.69 | 52% |