Cooper City Airbnb Market Analysis 2026: Short Term Rental Data & Vacation Rental Statistics in Florida, United States
Is Airbnb profitable in Cooper City in 2026? Explore comprehensive Airbnb analytics for Cooper City, Florida, United States to uncover income potential. This 2026 STR market report for Cooper City, based on AirROI data from February 2025 to January 2026, reveals key trends in the niche market of 31 active listings.
Whether you're considering an Airbnb investment in Cooper City, optimizing your existing vacation rental, or exploring rental arbitrage opportunities, understanding the Cooper City Airbnb data is crucial. Leveraging the low regulation environment is key to maximizing your short term rental income potential. Let's dive into the specifics.
Key Cooper City Airbnb Performance Metrics Overview
Monthly Airbnb Revenue Variations & Income Potential in Cooper City (2026)
Understanding the monthly revenue variations for Airbnb listings in Cooper City is key to maximizing your short term rental income potential. Seasonality significantly impacts earnings. Our analysis, based on data from the past 12 months, shows that the peak revenue month for STRs in Cooper City is typically March, while May often presents the lowest earnings, highlighting opportunities for strategic pricing adjustments during shoulder and low seasons. Explore the typical Airbnb income in Cooper City across different performance tiers:
- Best-in-class properties (Top 10%) achieve $10,206+ monthly, often utilizing dynamic pricing and superior guest experiences.
- Strong performing properties (Top 25%) earn $4,124 or more, indicating effective management and desirable locations/amenities.
- Typical properties (Median) generate around $1,686 per month, representing the average market performance.
- Entry-level properties (Bottom 25%) see earnings around $915, often with potential for optimization.
Average Monthly Airbnb Earnings Trend in Cooper City
Cooper City Airbnb Occupancy Rate Trends (2026)
Maximize your bookings by understanding the Cooper City STR occupancy trends. Seasonal demand shifts significantly influence how often properties are booked. Typically, Marchsees the highest demand (peak season occupancy), while May experiences the lowest (low season). Effective strategies, like adjusting minimum stays or offering promotions, can boost occupancy during slower periods. Here's how different property tiers perform in Cooper City:
- Best-in-class properties (Top 10%) achieve 80%+ occupancy, indicating high desirability and potentially optimized availability.
- Strong performing properties (Top 25%) maintain 66% or higher occupancy, suggesting good market fit and guest satisfaction.
- Typical properties (Median) have an occupancy rate around 45%.
- Entry-level properties (Bottom 25%) average 22% occupancy, potentially facing higher vacancy.
Average Monthly Occupancy Rate Trend in Cooper City
Average Daily Rate (ADR) Airbnb Trends in Cooper City (2026)
Effective short term rental pricing strategy in Cooper City involves understanding monthly ADR fluctuations. The Average Daily Rate (ADR) for Airbnb in Cooper City typically peaks in September and dips lowest during April. Leveraging Airbnb dynamic pricing tools or strategies based on this seasonality can significantly boost revenue. Here's a look at the typical nightly rates achieved:
- Best-in-class properties (Top 10%) command rates of $524+ per night, often due to premium features or locations.
- Strong performing properties (Top 25%) achieve nightly rates of $289 or more.
- Typical properties (Median) charge around $146 per night.
- Entry-level properties (Bottom 25%) earn around $96 per night.
Average Daily Rate (ADR) Trend by Month in Cooper City
Get Live Cooper City Market Intelligence 👇

Explore Real-time Analytics
Airbnb Seasonality Analysis & Trends in Cooper City (2026)
Peak Season (March, February, December)
- Revenue averages $5,091 per month
- Occupancy rates average 54.9%
- Daily rates average $301
Shoulder Season
- Revenue averages $3,477 per month
- Occupancy maintains around 44.6%
- Daily rates hold near $295
Low Season (May, June, September)
- Revenue drops to average $2,263 per month
- Occupancy decreases to average 39.4%
- Daily rates adjust to average $298
Seasonality Insights for Cooper City
- The Airbnb seasonality in Cooper City shows highly seasonal trends requiring careful strategy. While the sections above show seasonal averages, it's also insightful to look at the extremes:
- During the high season, the absolute peak month showcases Cooper City's highest earning potential, with monthly revenues capable of climbing to $5,533, occupancy reaching a high of 61.6%, and ADRs peaking at $336.
- Conversely, the slowest single month of the year, typically falling within the low season, marks the market's lowest point. In this month, revenue might dip to $2,043, occupancy could drop to 29.3%, and ADRs may adjust down to $271.
- Understanding both the seasonal averages and these monthly peaks and troughs in revenue, occupancy, and ADR is crucial for maximizing your Airbnb profit potential in Cooper City.
Seasonal Strategies for Maximizing Profit
- Peak Season: Maximize revenue through premium pricing and potentially longer minimum stays. Ensure high availability.
- Low Season: Offer competitive pricing, special promotions (e.g., extended stay discounts), and flexible cancellation policies. Target off-season travelers like remote workers or budget-conscious guests.
- Shoulder Seasons: Implement dynamic pricing that balances peak and low rates. Target weekend travelers or specific events. Offer slightly more flexible terms than peak season.
- Regularly analyze your own performance against these Cooper City seasonality benchmarks and adjust your pricing and availability strategy accordingly.
Best Areas for Airbnb Investment in Cooper City (2026)
Exploring the top neighborhoods for short-term rentals in Cooper City? This section highlights key areas, outlining why they are attractive for hosts and guests, along with notable local attractions. Consider these locations based on your target guest profile and investment strategy.
| Neighborhood / Area | Why Host Here? (Target Guests & Appeal) | Key Attractions & Landmarks |
|---|---|---|
| Cooper City Center | The heart of Cooper City with shopping, dining, and proximity to parks. A family-friendly area that's great for families visiting relatives or working in the nearby industries. | Cooper City Sports Complex, C.B. Smith Park, Flamingo West Park |
| Flamingo Gardens | Home to the famous botanical garden and wildlife sanctuary. A tranquil area appealing to nature lovers and tourists seeking a peaceful retreat. | Flamingo Gardens, Wildlife Sanctuary |
| Cooper City High School Area | A suburban neighborhood with good schools and family amenities. Attracts visiting families and teachers. | Parks, Local eateries, Community events |
| Pine Island Park | Features sports fields and picnic areas, popular with local families and visitors. Great for those looking to enjoy outdoor activities. | Pine Island Park, Nature trails |
| Emerald Estates | A gated community that offers security and luxury living. Ideal for upscale travelers looking for a more residential experience. | Shops, Restaurants, Community amenities |
| Cooper City Golf Club | A golf-centric community that attracts golf enthusiasts and visitors looking to relax and enjoy the sport. | Cooper City Golf Club |
| Davie Road | Close proximity to major highways and neighboring cities, making it convenient for travelers. Offers a mix of urban amenities and suburban comfort. | Shops, Restaurants, Cafes |
| Parkland Area | Nearby Parkland offers a quieter suburban vibe with great parks and nature. Appeals to families and those seeking a peaceful stay close to Cooper City. | Parks, Nature trails |
Understanding Airbnb License Requirements & STR Laws in Cooper City (2026)
While Cooper City, Florida, United States currently shows low STR regulations, specific Airbnb license requirements might still exist or change. Always verify the latest short term rental regulations and Airbnb license requirements directly with local government authorities for Cooper City to ensure full compliance before hosting.
(Source: AirROI data, 2026, finding no licensed listings among those analyzed)
Top Performing Airbnb Properties in Cooper City (2026)
Benchmark your potential! Explore examples of top-performing Airbnb properties in Cooper Citybased on Trailing Twelve Month (TTM) revenue. Analyze their characteristics, revenue, occupancy rate, and ADR to understand what drives success in this market.
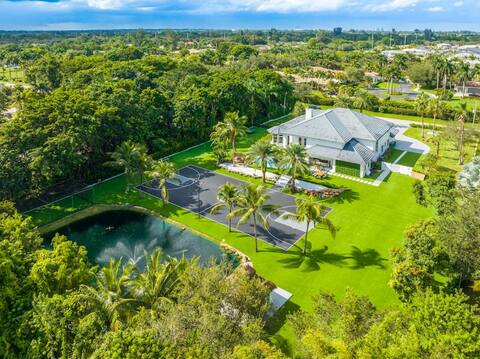
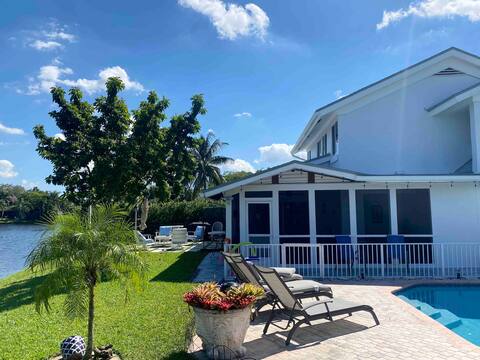
7 Bedroom Villa with Basketball Court / Lake, MORE
Entire Place • 7 bedrooms
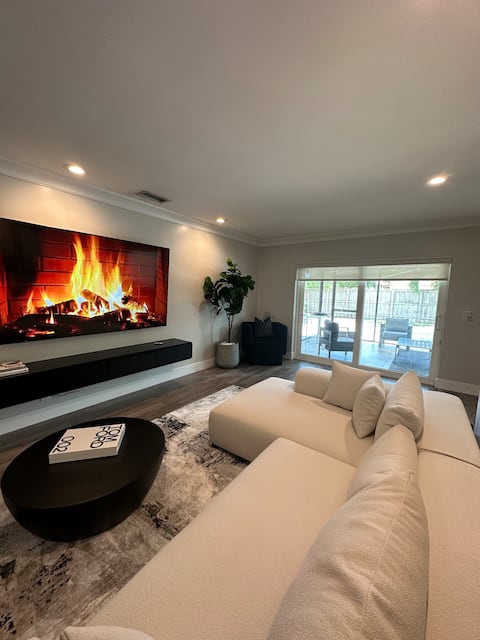
Pool Heat | Firepit+BBQ | 75”TV | Foosball | 581mbp
Entire Place • 4 bedrooms
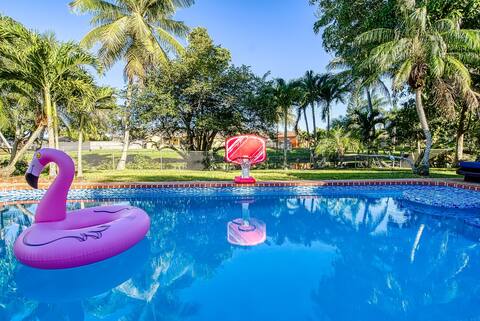
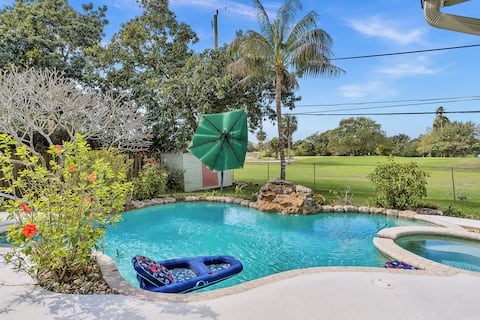
Tropical Oasis with Heated Salt Water Pool & Bar!
Entire Place • 4 bedrooms
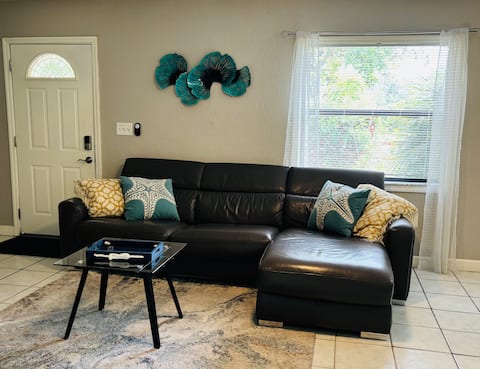
Sunshine Acre 2B/2B Home. King Suite & Big Yard
Entire Place • 2 bedrooms
LakeFront - Home Near Casino w private pool
Entire Place • 3 bedrooms
New urban 3 bedroom 2.5 bath
Entire Place • 3 bedrooms
Note: Performance varies based on location, size, amenities, seasonality, and management quality. Data reflects the past 12 months.
Top Performing Airbnb Hosts in Cooper City (2026)
Learn from the best! This table showcases top-performing Airbnb hosts in Cooper City based on the number of properties managed and estimated total revenue over the past year. Analyze their scale and performance metrics.
| Host Name | Properties | Grossing Revenue | Stay Reviews | Avg Rating |
|---|---|---|---|---|
| Andre | 1 | $159,182 | 28 | 4.89/5.0 |
| Sam | 1 | $137,129 | 94 | 4.95/5.0 |
| Daniel | 1 | $123,652 | 119 | 4.91/5.0 |
| Perry | 1 | $81,825 | 239 | 4.89/5.0 |
| Beatriz | 1 | $73,976 | 153 | 4.90/5.0 |
| Alex | 3 | $55,613 | 91 | 4.72/5.0 |
| Jw Management | 1 | $42,052 | 38 | 4.71/5.0 |
| Brian | 1 | $22,942 | 122 | 4.94/5.0 |
| Vacation In Luxury | 1 | $22,079 | 14 | 4.43/5.0 |
| Ralph | 1 | $17,413 | 293 | 4.86/5.0 |
Analyzing the strategies of top hosts, such as their property selection, pricing, and guest communication, can offer valuable lessons for optimizing your own Airbnb operations in Cooper City.
Dive Deeper: Advanced Cooper City STR Market Data (2026)
Ready to unlock more insights? AirROI provides access to advanced metrics and comprehensive Airbnb data for Cooper City. Explore detailed analytics beyond this report to refine your investment strategy, optimize pricing, and maximize your vacation rental profits.
Explore Advanced MetricsCooper City Short-Term Rental Market Composition (2026): Property & Room Types
Room Type Distribution
Property Type Distribution
Market Composition Insights for Cooper City
- The Cooper City Airbnb market composition is heavily skewed towards Entire Home/Apt listings, which make up 58.1% of the 31 active rentals. This indicates strong guest preference for privacy and space.
- However, a notable 41.9% share for Private Rooms suggests opportunities for budget-conscious travelers or hosts renting out spare rooms.
- Looking at the property type distribution in Cooper City, House properties are the most common (64.5%), reflecting the local real estate landscape.
- Houses represent a significant 64.5% portion, catering likely to families or larger groups.
Cooper City Airbnb Room Capacity Analysis (2026): Bedroom Distribution
Distribution of Listings by Number of Bedrooms
Room Capacity Insights for Cooper City
- The dominant room capacity in Cooper City is 1 bedroom listings, making up 19.4% of the market. This suggests a strong demand for properties suitable for couples or solo travelers.
- Together, 1 bedroom and 2 bedrooms properties represent 35.5% of the active Airbnb listings in Cooper City, indicating a high concentration in these sizes.
Cooper City Vacation Rental Guest Capacity Trends (2026)
Distribution of Listings by Guest Capacity
Guest Capacity Insights for Cooper City
- The most common guest capacity trend in Cooper City vacation rentals is listings accommodating 2 guests (16.1%). This suggests the primary traveler segment is likely couples or solo travelers.
- Properties designed for 2 guests and 8+ guests dominate the Cooper City STR market, accounting for 29.0% of listings.
- 25.8% of properties accommodate 6+ guests, serving the market segment for larger families or group travel in Cooper City.
- On average, properties in Cooper City are equipped to host 2.8 guests.
Cooper City Airbnb Booking Patterns (2026): Available vs. Booked Days
Available Days Distribution
Booked Days Distribution
Booking Pattern Insights for Cooper City
- The most common availability pattern in Cooper City falls within the 271-366 days range, representing 51.6% of listings. This suggests many properties have significant open periods on their calendars.
- Approximately 77.4% of listings show high availability (181+ days open annually), indicating potential for increased bookings or specific owner usage patterns.
- For booked days, the 91-180 days range is most frequent in Cooper City (25.8%), reflecting common guest stay durations or potential owner blocking patterns.
- A notable 22.6% of properties secure long booking periods (181+ days booked per year), highlighting successful long-term rental strategies or significant owner usage.
Cooper City Airbnb Minimum Stay Requirements Analysis
Distribution of Listings by Minimum Night Requirement
1 Night
15 listings
48.4% of total
2 Nights
3 listings
9.7% of total
4-6 Nights
1 listings
3.2% of total
30+ Nights
12 listings
38.7% of total
Key Insights
- The most prevalent minimum stay requirement in Cooper City is 1 Night, adopted by 48.4% of listings. This highlights the market's preference for shorter, flexible bookings.
- A significant segment (38.7%) caters to monthly stays (30+ nights) in Cooper City, pointing to opportunities in the extended-stay market.
Recommendations
- Align with the market by considering a 1 Night minimum stay, as 48.4% of Cooper City hosts use this setting.
- Explore offering discounts for stays of 30+ nights to attract the 38.7% of the market seeking extended stays.
- Adjust minimum nights based on seasonality – potentially shorter during low season and longer during peak demand periods in Cooper City.
Cooper City Airbnb Cancellation Policy Trends Analysis (2026)
Super Strict 30 Days
3 listings
9.7% of total
Flexible
7 listings
22.6% of total
Moderate
3 listings
9.7% of total
Firm
6 listings
19.4% of total
Strict
12 listings
38.7% of total
Cancellation Policy Insights for Cooper City
- The prevailing Airbnb cancellation policy trend in Cooper City is Strict, used by 38.7% of listings.
- A majority (58.1%) of hosts in Cooper City utilize Firm or Strict policies, indicating a market where hosts prioritize booking security.
Recommendations for Hosts
- Consider adopting a Strict policy to align with the 38.7% market standard in Cooper City.
- With 38.7% using Strict terms, this is a viable option in Cooper City, particularly for high-value properties or during peak demand periods.
- Regularly review your cancellation policy against competitors and market demand shifts in Cooper City.
Cooper City STR Booking Lead Time Analysis (2026)
Average Booking Lead Time by Month
Booking Lead Time Insights for Cooper City
- The overall average booking lead time for vacation rentals in Cooper City is 24 days.
- Guests book furthest in advance for stays during January (average 49 days), likely coinciding with peak travel demand or local events.
- The shortest booking windows occur for stays in August (average 16 days), indicating more last-minute travel plans during this time.
- Seasonally, Winter (40 days avg.) sees the longest lead times, while Summer (18 days avg.) has the shortest, reflecting typical travel planning cycles.
Recommendations for Hosts
- Use the overall average lead time (24 days) as a baseline for your pricing and availability strategy in Cooper City.
- For January stays, consider implementing length-of-stay discounts or slightly higher rates for bookings made less than 49 days out to capitalize on advance planning.
- Target marketing efforts for the Winter season well in advance (at least 40 days) to capture early planners.
- Monitor your own booking lead times against these Cooper City averages to identify opportunities for dynamic pricing adjustments.
Popular & Essential Airbnb Amenities in Cooper City (2026)
Amenity Prevalence
Amenity Insights for Cooper City
- Essential amenities in Cooper City that guests expect include: Wifi, Smoke alarm, Air conditioning. Lacking these (any) could significantly impact bookings.
- Popular amenities like TV, Hangers, Bed linens are common but not universal. Offering these can provide a competitive edge.
Recommendations for Hosts
- Ensure your listing includes all essential amenities for Cooper City: Wifi, Smoke alarm, Air conditioning.
- Prioritize adding missing essentials: Smoke alarm, Air conditioning.
- Consider adding popular differentiators like TV or Hangers to increase appeal.
- Highlight unique or less common amenities you offer (e.g., hot tub, dedicated workspace, EV charger) in your listing description and photos.
- Regularly check competitor amenities in Cooper City to stay competitive.
Cooper City Airbnb Guest Demographics & Profile Analysis (2026)
Guest Profile Summary for Cooper City
- The typical guest profile for Airbnb in Cooper City consists of primarily domestic travelers (84%), often arriving from nearby Naples, typically belonging to the Post-2000s (Gen Z/Alpha) group (50%), primarily speaking English or Spanish.
- Domestic travelers account for 83.8% of guests.
- Key international markets include United States (83.8%) and Canada (3%).
- Top languages spoken are English (63.7%) followed by Spanish (21.9%).
- A significant demographic segment is the Post-2000s (Gen Z/Alpha) group, representing 50% of guests.
Recommendations for Hosts
- Target domestic marketing efforts towards travelers from Naples and Fort Lauderdale.
- Tailor amenities and listing descriptions to appeal to the dominant Post-2000s (Gen Z/Alpha) demographic (e.g., highlight fast WiFi, smart home features, local guides).
- Highlight unique local experiences or amenities relevant to the primary guest profile.
- Consider seasonal promotions aligned with peak travel times for key origin markets.
Nearby Short-Term Rental Market Comparison
How does the Cooper City Airbnb market stack up against its neighbors? Compare key performance metrics like average monthly revenue, ADR, and occupancy rates in surrounding areas to understand the broader regional STR landscape.
| Market | Active Properties | Monthly Revenue | Daily Rate | Avg. Occupancy |
|---|---|---|---|---|
| Sailfish Point | 19 | $16,709 | $1587.63 | 48% |
| Bal Harbour Village | 37 | $8,846 | $850.63 | 34% |
| Lake Clarke Shores | 26 | $6,710 | $516.52 | 46% |
| Lighthouse Point | 75 | $6,205 | $472.94 | 51% |
| Pinecrest | 11 | $6,117 | $861.24 | 43% |
| North Bay Village | 120 | $6,032 | $561.12 | 44% |
| Tequesta | 43 | $4,920 | $376.96 | 50% |
| Juno Beach | 39 | $4,807 | $377.00 | 47% |
| Parkland | 17 | $4,637 | $369.21 | 47% |
| Ocean Ridge | 14 | $4,588 | $602.78 | 48% |