Christmas Airbnb Market Analysis 2025: Short Term Rental Data & Vacation Rental Statistics in Florida, United States
Is Airbnb profitable in Christmas in 2025? Explore comprehensive Airbnb analytics for Christmas, Florida, United States to uncover income potential. This 2025 STR market report for Christmas, based on AirROI data from November 2024 to October 2025, reveals key trends in the niche market of 20 active listings.
Whether you're considering an Airbnb investment in Christmas, optimizing your existing vacation rental, or exploring rental arbitrage opportunities, understanding the Christmas Airbnb data is crucial. Understanding the local regulations is key to maximizing your short term rental income potential. Let's dive into the specifics.
Key Christmas Airbnb Performance Metrics Overview
Monthly Airbnb Revenue Variations & Income Potential in Christmas (2025)
Understanding the monthly revenue variations for Airbnb listings in Christmas is key to maximizing your short term rental income potential. Seasonality significantly impacts earnings. Our analysis, based on data from the past 12 months, shows that the peak revenue month for STRs in Christmas is typically August, while November often presents the lowest earnings, highlighting opportunities for strategic pricing adjustments during shoulder and low seasons. Explore the typical Airbnb income in Christmas across different performance tiers:
- Best-in-class properties (Top 10%) achieve $2,591+ monthly, often utilizing dynamic pricing and superior guest experiences.
- Strong performing properties (Top 25%) earn $1,724 or more, indicating effective management and desirable locations/amenities.
- Typical properties (Median) generate around $945 per month, representing the average market performance.
- Entry-level properties (Bottom 25%) see earnings around $575, often with potential for optimization.
Average Monthly Airbnb Earnings Trend in Christmas
Christmas Airbnb Occupancy Rate Trends (2025)
Maximize your bookings by understanding the Christmas STR occupancy trends. Seasonal demand shifts significantly influence how often properties are booked. Typically, Julysees the highest demand (peak season occupancy), while October experiences the lowest (low season). Effective strategies, like adjusting minimum stays or offering promotions, can boost occupancy during slower periods. Here's how different property tiers perform in Christmas:
- Best-in-class properties (Top 10%) achieve 69%+ occupancy, indicating high desirability and potentially optimized availability.
- Strong performing properties (Top 25%) maintain 47% or higher occupancy, suggesting good market fit and guest satisfaction.
- Typical properties (Median) have an occupancy rate around 32%.
- Entry-level properties (Bottom 25%) average 15% occupancy, potentially facing higher vacancy.
Average Monthly Occupancy Rate Trend in Christmas
Average Daily Rate (ADR) Airbnb Trends in Christmas (2025)
Effective short term rental pricing strategy in Christmas involves understanding monthly ADR fluctuations. The Average Daily Rate (ADR) for Airbnb in Christmas typically peaks in January and dips lowest during May. Leveraging Airbnb dynamic pricing tools or strategies based on this seasonality can significantly boost revenue. Here's a look at the typical nightly rates achieved:
- Best-in-class properties (Top 10%) command rates of $121+ per night, often due to premium features or locations.
- Strong performing properties (Top 25%) achieve nightly rates of $106 or more.
- Typical properties (Median) charge around $70 per night.
- Entry-level properties (Bottom 25%) earn around $44 per night.
Average Daily Rate (ADR) Trend by Month in Christmas
Get Live Christmas Market Intelligence 👇

Explore Real-time Analytics
Airbnb Seasonality Analysis & Trends in Christmas (2025)
Peak Season (August, July, June)
- Revenue averages $2,204 per month
- Occupancy rates average 65.0%
- Daily rates average $75
Shoulder Season
- Revenue averages $1,097 per month
- Occupancy maintains around 28.7%
- Daily rates hold near $77
Low Season (September, November, December)
- Revenue drops to average $589 per month
- Occupancy decreases to average 21.6%
- Daily rates adjust to average $74
Seasonality Insights for Christmas
- The Airbnb seasonality in Christmas shows highly seasonal trends requiring careful strategy. While the sections above show seasonal averages, it's also insightful to look at the extremes:
- During the high season, the absolute peak month showcases Christmas's highest earning potential, with monthly revenues capable of climbing to $2,281, occupancy reaching a high of 67.1%, and ADRs peaking at $93.
- Conversely, the slowest single month of the year, typically falling within the low season, marks the market's lowest point. In this month, revenue might dip to $476, occupancy could drop to 15.1%, and ADRs may adjust down to $70.
- Understanding both the seasonal averages and these monthly peaks and troughs in revenue, occupancy, and ADR is crucial for maximizing your Airbnb profit potential in Christmas.
Seasonal Strategies for Maximizing Profit
- Peak Season: Maximize revenue through premium pricing and potentially longer minimum stays. Ensure high availability.
- Low Season: Offer competitive pricing, special promotions (e.g., extended stay discounts), and flexible cancellation policies. Target off-season travelers like remote workers or budget-conscious guests.
- Shoulder Seasons: Implement dynamic pricing that balances peak and low rates. Target weekend travelers or specific events. Offer slightly more flexible terms than peak season.
- Regularly analyze your own performance against these Christmas seasonality benchmarks and adjust your pricing and availability strategy accordingly.
Best Areas for Airbnb Investment in Christmas (2025)
Exploring the top neighborhoods for short-term rentals in Christmas? This section highlights key areas, outlining why they are attractive for hosts and guests, along with notable local attractions. Consider these locations based on your target guest profile and investment strategy.
| Neighborhood / Area | Why Host Here? (Target Guests & Appeal) | Key Attractions & Landmarks |
|---|---|---|
| Lake Nona | A fast-growing area known for its innovative health and wellness community. Lake Nona is attractive to families and business travelers due to its modern developments and proximity to Orlando. | Lake Nona Medical City, Nona Adventure Park, Lake Nona Golf & Country Club, Boxi Park, Lake Nona Town Center |
| Kissimmee | Just a short drive from Disney World and other theme parks, Kissimmee is a popular vacation spot for families and tourists looking for affordable accommodations. | Walt Disney World, Old Town Kissimmee, Gators landings, Lake Tohopekaliga, Kissimmee Lakefront Park |
| Orlando International Airport Area | Convenient for travelers flying in and out of Orlando, this area is ideal for short-term rentals catering to airport guests and tourists heading to theme parks. | Orlando International Airport, Airport Lakes Park, Lake Nona, The Florida Mall, SeaWorld |
| Harmony | A charming planned community with a picturesque setting, Harmony offers a small-town feel while being close to major attractions, making it popular for family getaways. | Harmony Town Square, Harmony Golf Preserve, Lakeside Park, Lake Tohopekaliga, hiking trails |
| Cocoa Beach | Famous for its beautiful beaches and as a gateway to the Kennedy Space Center, Cocoa Beach attracts surfers, beach lovers, and space enthusiasts alike. | Cocoa Beach Pier, Ron Jon Surf Shop, Lori Wilson Park, Cocoa Beach, The Dinosaur Store |
| Titusville | Located near the Kennedy Space Center, Titusville is perfect for space-related tourism and also offers beautiful views of the Indian River. | Kennedy Space Center Visitor Complex, Space View Park, US Space Walk of Fame, Canova Beach Park, Titusville Playhouse |
| New Smyrna Beach | Known for its beautiful beaches and thriving arts community, New Smyrna Beach draws visitors looking for a relaxing beach getaway with local charm. | New Smyrna Beach, Smyrna Dunes Park, Canal Street Historic District, Flagler Avenue, Mary S. Harrell Black Heritage Museum |
| Daytona Beach | Famous for its beaches and motorsport events, Daytona Beach is ideal for tourists looking for a fun beach vacation along with exciting events year-round. | Daytona International Speedway, Boardwalk and Pier, Daytona Beach Boardwalk, Ponce de Leon Inlet Lighthouse, LPGA International |
Understanding Airbnb License Requirements & STR Laws in Christmas (2025)
With 15% of listings showing registration in 2025, understanding potential Airbnb license requirements is crucial in Christmas. Always verify the latest short term rental regulations and Airbnb license requirements directly with local government authorities for Christmas to ensure full compliance before hosting.
(Source: AirROI data, 2025, based on 15% licensed listings)
Top Performing Airbnb Properties in Christmas (2025)
Benchmark your potential! Explore examples of top-performing Airbnb properties in Christmasbased on Trailing Twelve Month (TTM) revenue. Analyze their characteristics, revenue, occupancy rate, and ADR to understand what drives success in this market.
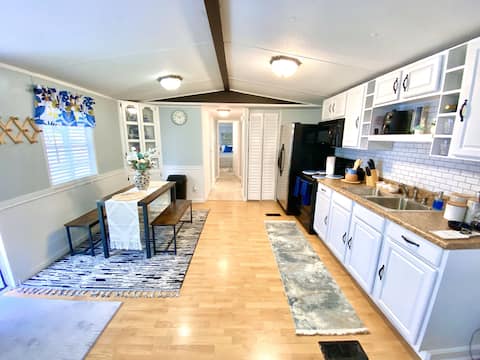
Cozy Cabin in Orlando
Entire Place • 2 bedrooms
Cozy Cottage in Orlando - Snowbird Paradise
Entire Place • 2 bedrooms

Clear Landing /Cabin in the Forest
Entire Place • 2 bedrooms
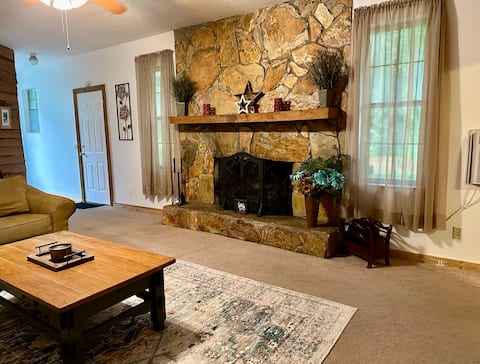
The little getaway
Entire Place • 3 bedrooms
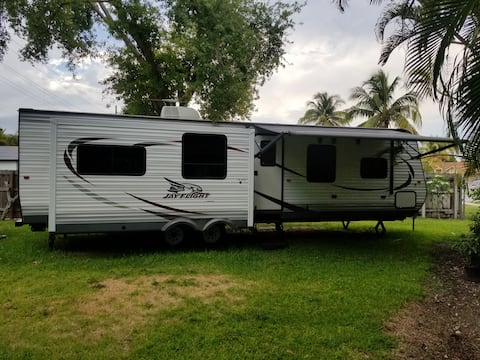
Comfortable RV apartment in Orlando, Florida
Entire Place • 1 bedroom

Art Beach Barn
Entire Place • 1 bedroom
Note: Performance varies based on location, size, amenities, seasonality, and management quality. Data reflects the past 12 months.
Top Performing Airbnb Hosts in Christmas (2025)
Learn from the best! This table showcases top-performing Airbnb hosts in Christmas based on the number of properties managed and estimated total revenue over the past year. Analyze their scale and performance metrics.
| Host Name | Properties | Grossing Revenue | Stay Reviews | Avg Rating |
|---|---|---|---|---|
| Aida | 2 | $54,811 | 94 | 4.94/5.0 |
| Kathleen | 1 | $23,399 | 165 | 4.76/5.0 |
| Annie | 1 | $20,748 | 2 | Not Rated |
| Kathryn | 13 | $19,626 | 196 | 4.87/5.0 |
| Judith | 1 | $4,873 | 27 | 4.74/5.0 |
| Math Powerland | 1 | $3,668 | 12 | 4.50/5.0 |
| Host #544303746 | 1 | $735 | 1 | Not Rated |
Analyzing the strategies of top hosts, such as their property selection, pricing, and guest communication, can offer valuable lessons for optimizing your own Airbnb operations in Christmas.
Dive Deeper: Advanced Christmas STR Market Data (2025)
Ready to unlock more insights? AirROI provides access to advanced metrics and comprehensive Airbnb data for Christmas. Explore detailed analytics beyond this report to refine your investment strategy, optimize pricing, and maximize your vacation rental profits.
Explore Advanced MetricsChristmas Short-Term Rental Market Composition (2025): Property & Room Types
Room Type Distribution
Property Type Distribution
Market Composition Insights for Christmas
- The Christmas Airbnb market composition is heavily skewed towards Entire Home/Apt listings, which make up 95% of the 20 active rentals. This indicates strong guest preference for privacy and space.
- Looking at the property type distribution in Christmas, Outdoor/Unique properties are the most common (75%), reflecting the local real estate landscape.
- The presence of 10% Hotel/Boutique listings indicates integration with traditional hospitality.
Christmas Airbnb Room Capacity Analysis (2025): Bedroom Distribution
Distribution of Listings by Number of Bedrooms
Room Capacity Insights for Christmas
- The dominant room capacity in Christmas is 1 bedroom listings, making up 65% of the market. This suggests a strong demand for properties suitable for couples or solo travelers.
- Together, 1 bedroom and 2 bedrooms properties represent 90.0% of the active Airbnb listings in Christmas, indicating a high concentration in these sizes.
- With over half the market (65%) consisting of studios or 1-bedroom units, Christmas is particularly well-suited for individuals or couples.
- Listings with 3+ bedrooms (5.0%) represent a smaller niche, potentially indicating an underserved market for larger group accommodations in Christmas.
Christmas Vacation Rental Guest Capacity Trends (2025)
Distribution of Listings by Guest Capacity
Guest Capacity Insights for Christmas
- The most common guest capacity trend in Christmas vacation rentals is listings accommodating 4 guests (30%). This suggests the primary traveler segment is likely small families or groups.
- Properties designed for 4 guests and 5 guests dominate the Christmas STR market, accounting for 50.0% of listings.
- 20.0% of properties accommodate 6+ guests, serving the market segment for larger families or group travel in Christmas.
- On average, properties in Christmas are equipped to host 4.3 guests.
Christmas Airbnb Booking Patterns (2025): Available vs. Booked Days
Available Days Distribution
Booked Days Distribution
Booking Pattern Insights for Christmas
- The most common availability pattern in Christmas falls within the 271-366 days range, representing 80% of listings. This suggests many properties have significant open periods on their calendars.
- Approximately 85.0% of listings show high availability (181+ days open annually), indicating potential for increased bookings or specific owner usage patterns.
- For booked days, the 1-30 days range is most frequent in Christmas (60%), reflecting common guest stay durations or potential owner blocking patterns.
- A notable 20.0% of properties secure long booking periods (181+ days booked per year), highlighting successful long-term rental strategies or significant owner usage.
Christmas Airbnb Minimum Stay Requirements Analysis
Distribution of Listings by Minimum Night Requirement
1 Night
15 listings
75% of total
2 Nights
3 listings
15% of total
7-29 Nights
1 listings
5% of total
30+ Nights
1 listings
5% of total
Key Insights
- The most prevalent minimum stay requirement in Christmas is 1 Night, adopted by 75% of listings. This highlights the market's preference for shorter, flexible bookings.
- A strong majority (90.0%) of the Christmas Airbnb data shows acceptance of very short stays (1-2 nights), indicating a dynamic, high-turnover market.
Recommendations
- Align with the market by considering a 1 Night minimum stay, as 75% of Christmas hosts use this setting.
- Adjust minimum nights based on seasonality – potentially shorter during low season and longer during peak demand periods in Christmas.
Christmas Airbnb Cancellation Policy Trends Analysis (2025)
Flexible
3 listings
16.7% of total
Moderate
1 listings
5.6% of total
Firm
2 listings
11.1% of total
Strict
12 listings
66.7% of total
Cancellation Policy Insights for Christmas
- The prevailing Airbnb cancellation policy trend in Christmas is Strict, used by 66.7% of listings.
- A majority (77.8%) of hosts in Christmas utilize Firm or Strict policies, indicating a market where hosts prioritize booking security.
Recommendations for Hosts
- Consider adopting a Strict policy to align with the 66.7% market standard in Christmas.
- With 66.7% using Strict terms, this is a viable option in Christmas, particularly for high-value properties or during peak demand periods.
- Regularly review your cancellation policy against competitors and market demand shifts in Christmas.
Christmas STR Booking Lead Time Analysis (2025)
Average Booking Lead Time by Month
Booking Lead Time Insights for Christmas
- The overall average booking lead time for vacation rentals in Christmas is 33 days.
- Guests book furthest in advance for stays during April (average 142 days), likely coinciding with peak travel demand or local events.
- The shortest booking windows occur for stays in September (average 6 days), indicating more last-minute travel plans during this time.
- Seasonally, Spring (68 days avg.) sees the longest lead times, while Winter (14 days avg.) has the shortest, reflecting typical travel planning cycles.
Recommendations for Hosts
- Use the overall average lead time (33 days) as a baseline for your pricing and availability strategy in Christmas.
- For April stays, consider implementing length-of-stay discounts or slightly higher rates for bookings made less than 142 days out to capitalize on advance planning.
- During September, focus on last-minute booking availability and promotions, as guests book with very short notice (6 days avg.).
- Target marketing efforts for the Spring season well in advance (at least 68 days) to capture early planners.
- Monitor your own booking lead times against these Christmas averages to identify opportunities for dynamic pricing adjustments.
Popular & Essential Airbnb Amenities in Christmas (2025)
Amenity Prevalence
Amenity Insights for Christmas
- Essential amenities in Christmas that guests expect include: Free parking on premises, Kitchen, Dishes and silverware, Dedicated workspace, Barbecue utensils. Lacking these (any) could significantly impact bookings.
- Popular amenities like Backyard, Coffee maker, Fire pit are common but not universal. Offering these can provide a competitive edge.
Recommendations for Hosts
- Ensure your listing includes all essential amenities for Christmas: Free parking on premises, Kitchen, Dishes and silverware, Dedicated workspace, Barbecue utensils.
- Prioritize adding missing essentials: Dishes and silverware, Dedicated workspace, Barbecue utensils.
- Consider adding popular differentiators like Backyard or Coffee maker to increase appeal.
- Highlight unique or less common amenities you offer (e.g., hot tub, dedicated workspace, EV charger) in your listing description and photos.
- Regularly check competitor amenities in Christmas to stay competitive.
Christmas Airbnb Guest Demographics & Profile Analysis (2025)
Guest Profile Summary for Christmas
- The typical guest profile for Airbnb in Christmas consists of primarily domestic travelers (88%), often arriving from nearby Palm Bay, typically belonging to the Post-2000s (Gen Z/Alpha) group (50%), primarily speaking English or Spanish.
- Domestic travelers account for 87.8% of guests.
- Key international markets include United States (87.8%) and Germany (2%).
- Top languages spoken are English (60.5%) followed by Spanish (18.4%).
- A significant demographic segment is the Post-2000s (Gen Z/Alpha) group, representing 50% of guests.
Recommendations for Hosts
- Target domestic marketing efforts towards travelers from Palm Bay and West Palm Beach.
- Tailor amenities and listing descriptions to appeal to the dominant Post-2000s (Gen Z/Alpha) demographic (e.g., highlight fast WiFi, smart home features, local guides).
- Highlight unique local experiences or amenities relevant to the primary guest profile.
- Consider seasonal promotions aligned with peak travel times for key origin markets.
Nearby Short-Term Rental Market Comparison
How does the Christmas Airbnb market stack up against its neighbors? Compare key performance metrics like average monthly revenue, ADR, and occupancy rates in surrounding areas to understand the broader regional STR landscape.
| Market | Active Properties | Monthly Revenue | Daily Rate | Avg. Occupancy |
|---|---|---|---|---|
| Sailfish Point | 22 | $17,895 | $1840.25 | 50% |
| Anna Maria island | 587 | $7,433 | $824.81 | 40% |
| St. Augustine Beach | 10 | $6,713 | $427.27 | 48% |
| Reunion | 12 | $6,493 | $583.05 | 42% |
| Vilano Beach | 174 | $5,928 | $452.40 | 46% |
| Melbourne Beach | 243 | $5,873 | $491.07 | 45% |
| Indian Rocks Beach | 799 | $5,613 | $430.15 | 49% |
| Bradenton Beach | 65 | $5,585 | $520.88 | 45% |
| Siesta Key | 1,109 | $5,281 | $514.53 | 43% |
| Belleair Beach | 97 | $4,908 | $341.97 | 53% |