Charlotte Park Airbnb Market Analysis 2025: Short Term Rental Data & Vacation Rental Statistics in Florida, United States
Is Airbnb profitable in Charlotte Park in 2025? Explore comprehensive Airbnb analytics for Charlotte Park, Florida, United States to uncover income potential. This 2025 STR market report for Charlotte Park, based on AirROI data from September 2024 to August 2025, reveals key trends in the niche market of 19 active listings.
Whether you're considering an Airbnb investment in Charlotte Park, optimizing your existing vacation rental, or exploring rental arbitrage opportunities, understanding the Charlotte Park Airbnb data is crucial. Leveraging the low regulation environment is key to maximizing your short term rental income potential. Let's dive into the specifics.
Key Charlotte Park Airbnb Performance Metrics Overview
Monthly Airbnb Revenue Variations & Income Potential in Charlotte Park (2025)
Understanding the monthly revenue variations for Airbnb listings in Charlotte Park is key to maximizing your short term rental income potential. Seasonality significantly impacts earnings. Our analysis, based on data from the past 12 months, shows that the peak revenue month for STRs in Charlotte Park is typically February, while June often presents the lowest earnings, highlighting opportunities for strategic pricing adjustments during shoulder and low seasons. Explore the typical Airbnb income in Charlotte Park across different performance tiers:
- Best-in-class properties (Top 10%) achieve $6,362+ monthly, often utilizing dynamic pricing and superior guest experiences.
- Strong performing properties (Top 25%) earn $4,057 or more, indicating effective management and desirable locations/amenities.
- Typical properties (Median) generate around $2,280 per month, representing the average market performance.
- Entry-level properties (Bottom 25%) see earnings around $1,380, often with potential for optimization.
Average Monthly Airbnb Earnings Trend in Charlotte Park
Charlotte Park Airbnb Occupancy Rate Trends (2025)
Maximize your bookings by understanding the Charlotte Park STR occupancy trends. Seasonal demand shifts significantly influence how often properties are booked. Typically, Februarysees the highest demand (peak season occupancy), while June experiences the lowest (low season). Effective strategies, like adjusting minimum stays or offering promotions, can boost occupancy during slower periods. Here's how different property tiers perform in Charlotte Park:
- Best-in-class properties (Top 10%) achieve 80%+ occupancy, indicating high desirability and potentially optimized availability.
- Strong performing properties (Top 25%) maintain 62% or higher occupancy, suggesting good market fit and guest satisfaction.
- Typical properties (Median) have an occupancy rate around 41%.
- Entry-level properties (Bottom 25%) average 26% occupancy, potentially facing higher vacancy.
Average Monthly Occupancy Rate Trend in Charlotte Park
Average Daily Rate (ADR) Airbnb Trends in Charlotte Park (2025)
Effective short term rental pricing strategy in Charlotte Park involves understanding monthly ADR fluctuations. The Average Daily Rate (ADR) for Airbnb in Charlotte Park typically peaks in February and dips lowest during May. Leveraging Airbnb dynamic pricing tools or strategies based on this seasonality can significantly boost revenue. Here's a look at the typical nightly rates achieved:
- Best-in-class properties (Top 10%) command rates of $322+ per night, often due to premium features or locations.
- Strong performing properties (Top 25%) achieve nightly rates of $245 or more.
- Typical properties (Median) charge around $177 per night.
- Entry-level properties (Bottom 25%) earn around $138 per night.
Average Daily Rate (ADR) Trend by Month in Charlotte Park
Get Live Charlotte Park Market Intelligence 👇

Explore Real-time Analytics
Airbnb Seasonality Analysis & Trends in Charlotte Park (2025)
Peak Season (February, March, January)
- Revenue averages $4,852 per month
- Occupancy rates average 67.1%
- Daily rates average $223
Shoulder Season
- Revenue averages $2,692 per month
- Occupancy maintains around 40.6%
- Daily rates hold near $196
Low Season (June, October, November)
- Revenue drops to average $1,691 per month
- Occupancy decreases to average 29.7%
- Daily rates adjust to average $195
Seasonality Insights for Charlotte Park
- The Airbnb seasonality in Charlotte Park shows highly seasonal trends requiring careful strategy. While the sections above show seasonal averages, it's also insightful to look at the extremes:
- During the high season, the absolute peak month showcases Charlotte Park's highest earning potential, with monthly revenues capable of climbing to $5,021, occupancy reaching a high of 73.5%, and ADRs peaking at $228.
- Conversely, the slowest single month of the year, typically falling within the low season, marks the market's lowest point. In this month, revenue might dip to $1,160, occupancy could drop to 19.5%, and ADRs may adjust down to $186.
- Understanding both the seasonal averages and these monthly peaks and troughs in revenue, occupancy, and ADR is crucial for maximizing your Airbnb profit potential in Charlotte Park.
Seasonal Strategies for Maximizing Profit
- Peak Season: Maximize revenue through premium pricing and potentially longer minimum stays. Ensure high availability.
- Low Season: Offer competitive pricing, special promotions (e.g., extended stay discounts), and flexible cancellation policies. Target off-season travelers like remote workers or budget-conscious guests.
- Shoulder Seasons: Implement dynamic pricing that balances peak and low rates. Target weekend travelers or specific events. Offer slightly more flexible terms than peak season.
- Regularly analyze your own performance against these Charlotte Park seasonality benchmarks and adjust your pricing and availability strategy accordingly.
Best Areas for Airbnb Investment in Charlotte Park (2025)
Exploring the top neighborhoods for short-term rentals in Charlotte Park? This section highlights key areas, outlining why they are attractive for hosts and guests, along with notable local attractions. Consider these locations based on your target guest profile and investment strategy.
| Neighborhood / Area | Why Host Here? (Target Guests & Appeal) | Key Attractions & Landmarks |
|---|---|---|
| Uptown Charlotte | The central business district of Charlotte, known for its vibrant nightlife, dining, and shopping options. It's a popular destination for business travelers and tourists alike, with direct access to major attractions. | NASCAR Hall of Fame, Discovery Place Science, Charlotte Convention Center, Bank of America Corporate Center, Romare Bearden Park, Charlotte Epicenter |
| South End | A trendy neighborhood rich in history, known for its eclectic mix of shops, breweries, and art galleries. Close proximity to light rail makes it appealing for tourists looking to explore the city. | Rail Trail, Brewery Row, Historic South End, Parks and outdoor spaces, Shops and restaurants, The Charlotte Regional Farmer's Market |
| Ballantyne | A suburban area known for its upscale neighborhoods, golf courses, and family-friendly amenities. Attracts families and corporate travelers, especially for business retreats. | Ballantyne Resort, The Ballantyne Hotel, Parks and recreation areas, Shopping centers, Golf courses, Local dining options |
| NoDa | Charlotte's arts district, known for its vibrant street art, music scene, and unique boutiques. Highly attractive to young adults and creatives seeking an artsy, cultural experience. | NoDa Arts District, Live music venues, Local breweries, Art shops, Street festivals, Historic North Davidson |
| University City | A growing area with a mix of residential, commercial, and educational spaces. Home to the University of North Carolina at Charlotte, it attracts students and families alike. | University of North Carolina at Charlotte, Charlotte Premium Outlets, Parks and outdoor activities, Local dining options, Shopping plazas, Sports events at the university |
| East Charlotte | An eclectic area that features a diverse community, offering a variety of local businesses and parks. Attractive to those looking for authenticity and local flavor. | Reedy Creek Park, Local farmer's markets, Independence Boulevard attractions, Signature restaurants, Community events, Nearby hiking trails |
| West Charlotte | Features a mix of residential neighborhoods and local businesses, with significant cultural heritage. Growing interest among travelers looking for an off-the-beaten-path experience. | Historic landmarks, Local BBQ spots, Outdoor areas and parks, Cultural festivals, The Arts District, Public transportation links |
| Mecklenburg County | Surrounding the city, this area offers beautiful landscapes and a quieter lifestyle while still being close to the urban attractions, ideal for family-oriented visitors. | Lake Norman, Parks and recreational areas, Golf courses, Hiking trails, Local vineyards and farms, Community fairs and events |
Understanding Airbnb License Requirements & STR Laws in Charlotte Park (2025)
While Charlotte Park, Florida, United States currently shows low STR regulations, specific Airbnb license requirements might still exist or change. Always verify the latest short term rental regulations and Airbnb license requirements directly with local government authorities for Charlotte Park to ensure full compliance before hosting.
(Source: AirROI data, 2025, finding no licensed listings among those analyzed)
Top Performing Airbnb Properties in Charlotte Park (2025)
Benchmark your potential! Explore examples of top-performing Airbnb properties in Charlotte Parkbased on Trailing Twelve Month (TTM) revenue. Analyze their characteristics, revenue, occupancy rate, and ADR to understand what drives success in this market.
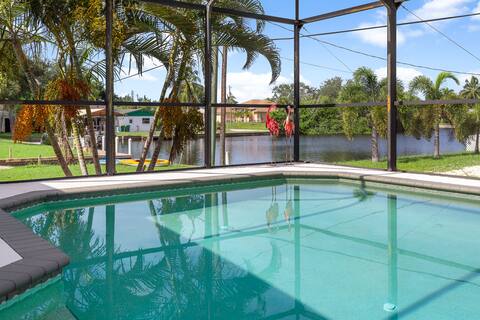
Punta Paradise- Enjoy a 4 bedroom heated pool home
Entire Place • 4 bedrooms
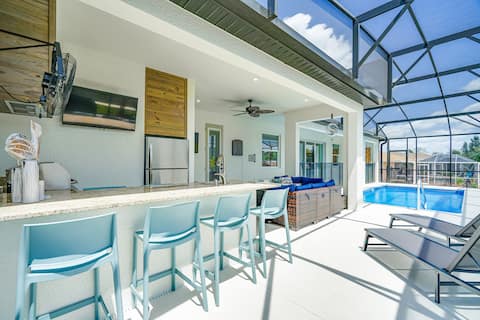
Punta Gorda Paradise: Pool & Outdoor Kitchen!
Entire Place • 3 bedrooms
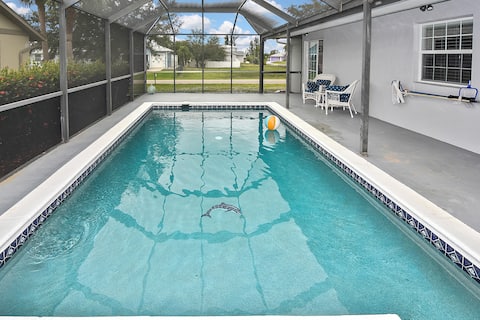
Stylish 3BRS Heated Pool Home/Walk to downtown!
Entire Place • 3 bedrooms

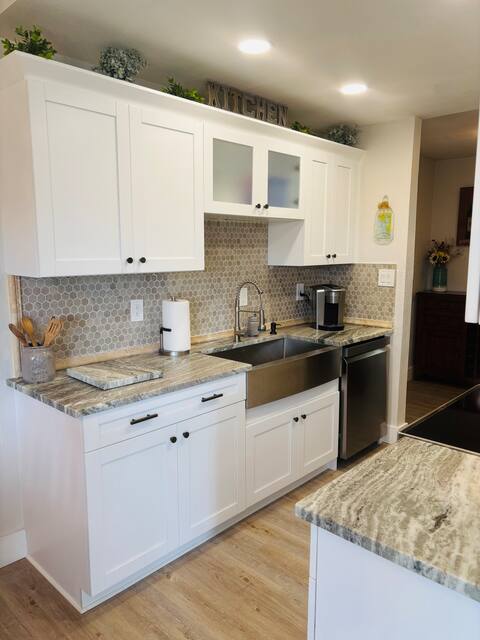
Gulf Coast Pool Home-Punta Gorda
Entire Place • 3 bedrooms
Punta Paradise: Comfortable Home Near Downtown
Entire Place • N/A

Tarpon Hideaway
Entire Place • 2 bedrooms
Note: Performance varies based on location, size, amenities, seasonality, and management quality. Data reflects the past 12 months.
Top Performing Airbnb Hosts in Charlotte Park (2025)
Learn from the best! This table showcases top-performing Airbnb hosts in Charlotte Park based on the number of properties managed and estimated total revenue over the past year. Analyze their scale and performance metrics.
| Host Name | Properties | Grossing Revenue | Stay Reviews | Avg Rating |
|---|---|---|---|---|
| Mark | 2 | $73,699 | 106 | 4.88/5.0 |
| Evolve | 1 | $70,848 | 22 | 4.95/5.0 |
| Juliet | 1 | $68,766 | 44 | 4.95/5.0 |
| Elizabeth | 2 | $36,793 | 48 | 4.95/5.0 |
| Jamal | 1 | $33,236 | 6 | 5.00/5.0 |
| Edward | 1 | $27,849 | 33 | 4.73/5.0 |
| Yamilet | 1 | $23,293 | 26 | 4.81/5.0 |
| Collin | 1 | $18,714 | 5 | 4.80/5.0 |
| Oscar | 2 | $18,297 | 116 | 4.92/5.0 |
| Randall Richard | 1 | $16,252 | 4 | 5.00/5.0 |
Analyzing the strategies of top hosts, such as their property selection, pricing, and guest communication, can offer valuable lessons for optimizing your own Airbnb operations in Charlotte Park.
Dive Deeper: Advanced Charlotte Park STR Market Data (2025)
Ready to unlock more insights? AirROI provides access to advanced metrics and comprehensive Airbnb data for Charlotte Park. Explore detailed analytics beyond this report to refine your investment strategy, optimize pricing, and maximize your vacation rental profits.
Explore Advanced MetricsCharlotte Park Short-Term Rental Market Composition (2025): Property & Room Types
Room Type Distribution
Property Type Distribution
Market Composition Insights for Charlotte Park
- The Charlotte Park Airbnb market composition is heavily skewed towards Entire Home/Apt listings, which make up 100% of the 19 active rentals. This indicates strong guest preference for privacy and space.
- Looking at the property type distribution in Charlotte Park, House properties are the most common (94.7%), reflecting the local real estate landscape.
- Houses represent a significant 94.7% portion, catering likely to families or larger groups.
Charlotte Park Airbnb Room Capacity Analysis (2025): Bedroom Distribution
Distribution of Listings by Number of Bedrooms
Room Capacity Insights for Charlotte Park
- The dominant room capacity in Charlotte Park is 2 bedrooms listings, making up 47.4% of the market. This suggests a strong demand for properties suitable for couples or solo travelers.
- Together, 2 bedrooms and 3 bedrooms properties represent 79.0% of the active Airbnb listings in Charlotte Park, indicating a high concentration in these sizes.
- A significant 42.1% of listings offer 3+ bedrooms, catering to larger groups and families seeking more space in Charlotte Park.
Charlotte Park Vacation Rental Guest Capacity Trends (2025)
Distribution of Listings by Guest Capacity
Guest Capacity Insights for Charlotte Park
- The most common guest capacity trend in Charlotte Park vacation rentals is listings accommodating 4 guests (31.6%). This suggests the primary traveler segment is likely small families or groups.
- Properties designed for 4 guests and 6 guests dominate the Charlotte Park STR market, accounting for 57.9% of listings.
- 52.6% of properties accommodate 6+ guests, serving the market segment for larger families or group travel in Charlotte Park.
- On average, properties in Charlotte Park are equipped to host 5.5 guests.
Charlotte Park Airbnb Booking Patterns (2025): Available vs. Booked Days
Available Days Distribution
Booked Days Distribution
Booking Pattern Insights for Charlotte Park
- The most common availability pattern in Charlotte Park falls within the 271-366 days range, representing 57.9% of listings. This suggests many properties have significant open periods on their calendars.
- Approximately 68.4% of listings show high availability (181+ days open annually), indicating potential for increased bookings or specific owner usage patterns.
- For booked days, the 31-90 days range is most frequent in Charlotte Park (36.8%), reflecting common guest stay durations or potential owner blocking patterns.
- A notable 31.6% of properties secure long booking periods (181+ days booked per year), highlighting successful long-term rental strategies or significant owner usage.
Charlotte Park Airbnb Minimum Stay Requirements Analysis
Distribution of Listings by Minimum Night Requirement
1 Night
2 listings
11.1% of total
2 Nights
4 listings
22.2% of total
3 Nights
1 listings
5.6% of total
4-6 Nights
2 listings
11.1% of total
7-29 Nights
4 listings
22.2% of total
30+ Nights
5 listings
27.8% of total
Key Insights
- The most prevalent minimum stay requirement in Charlotte Park is 30+ Nights, adopted by 27.8% of listings. This highlights the market's preference for longer commitments.
- A significant segment (27.8%) caters to monthly stays (30+ nights) in Charlotte Park, pointing to opportunities in the extended-stay market.
Recommendations
- Align with the market by considering a 30+ Nights minimum stay, as 27.8% of Charlotte Park hosts use this setting.
- If feasible, allowing 1-night stays, especially midweek or during low season, could capture last-minute bookings, as only 11.1% currently do.
- Explore offering discounts for stays of 30+ nights to attract the 27.8% of the market seeking extended stays.
- Adjust minimum nights based on seasonality – potentially shorter during low season and longer during peak demand periods in Charlotte Park.
Charlotte Park Airbnb Cancellation Policy Trends Analysis (2025)
Super Strict 30 Days
2 listings
11.1% of total
Flexible
5 listings
27.8% of total
Moderate
2 listings
11.1% of total
Firm
7 listings
38.9% of total
Strict
2 listings
11.1% of total
Cancellation Policy Insights for Charlotte Park
- The prevailing Airbnb cancellation policy trend in Charlotte Park is Firm, used by 38.9% of listings.
- There's a relatively balanced mix between guest-friendly (38.9%) and stricter (50.0%) policies, offering choices for different guest needs.
Recommendations for Hosts
- Consider adopting a Firm policy to align with the 38.9% market standard in Charlotte Park.
- Using a Strict policy might deter some guests, as only 11.1% of listings use it. Evaluate if potential revenue protection outweighs possible lower booking rates.
- Regularly review your cancellation policy against competitors and market demand shifts in Charlotte Park.
Charlotte Park STR Booking Lead Time Analysis (2025)
Average Booking Lead Time by Month
Booking Lead Time Insights for Charlotte Park
- The overall average booking lead time for vacation rentals in Charlotte Park is 53 days.
- Guests book furthest in advance for stays during January (average 113 days), likely coinciding with peak travel demand or local events.
- The shortest booking windows occur for stays in September (average 14 days), indicating more last-minute travel plans during this time.
- Seasonally, Winter (87 days avg.) sees the longest lead times, while Summer (22 days avg.) has the shortest, reflecting typical travel planning cycles.
Recommendations for Hosts
- Use the overall average lead time (53 days) as a baseline for your pricing and availability strategy in Charlotte Park.
- For January stays, consider implementing length-of-stay discounts or slightly higher rates for bookings made less than 113 days out to capitalize on advance planning.
- During September, focus on last-minute booking availability and promotions, as guests book with very short notice (14 days avg.).
- Target marketing efforts for the Winter season well in advance (at least 87 days) to capture early planners.
- Monitor your own booking lead times against these Charlotte Park averages to identify opportunities for dynamic pricing adjustments.
Popular & Essential Airbnb Amenities in Charlotte Park (2025)
Amenity Prevalence
Amenity Insights for Charlotte Park
- Essential amenities in Charlotte Park that guests expect include: Air conditioning, Bed linens, Smoke alarm, Wifi, TV, Free parking on premises, Kitchen. Lacking these (any) could significantly impact bookings.
- Popular amenities like Dishes and silverware, Refrigerator, Hot water are common but not universal. Offering these can provide a competitive edge.
Recommendations for Hosts
- Ensure your listing includes all essential amenities for Charlotte Park: Air conditioning, Bed linens, Smoke alarm, Wifi, TV, Free parking on premises, Kitchen.
- Consider adding popular differentiators like Dishes and silverware or Refrigerator to increase appeal.
- Highlight unique or less common amenities you offer (e.g., hot tub, dedicated workspace, EV charger) in your listing description and photos.
- Regularly check competitor amenities in Charlotte Park to stay competitive.
Charlotte Park Airbnb Guest Demographics & Profile Analysis (2025)
Guest Profile Summary for Charlotte Park
- The typical guest profile for Airbnb in Charlotte Park consists of primarily domestic travelers (100%), often arriving from nearby Stuart, typically belonging to the Post-2000s (Gen Z/Alpha) group (50%), primarily speaking English or Spanish.
- Domestic travelers account for 100.0% of guests.
- Top languages spoken are English (72.7%) followed by Spanish (18.2%).
- A significant demographic segment is the Post-2000s (Gen Z/Alpha) group, representing 50% of guests.
Recommendations for Hosts
- Target domestic marketing efforts towards travelers from Stuart and Fort Pierce.
- Tailor amenities and listing descriptions to appeal to the dominant Post-2000s (Gen Z/Alpha) demographic (e.g., highlight fast WiFi, smart home features, local guides).
- Highlight unique local experiences or amenities relevant to the primary guest profile.
- Consider seasonal promotions aligned with peak travel times for key origin markets.
Nearby Short-Term Rental Market Comparison
How does the Charlotte Park Airbnb market stack up against its neighbors? Compare key performance metrics like average monthly revenue, ADR, and occupancy rates in surrounding areas to understand the broader regional STR landscape.
| Market | Active Properties | Monthly Revenue | Daily Rate | Avg. Occupancy |
|---|---|---|---|---|
| Anna Maria island | 615 | $6,647 | $785.31 | 40% |
| Boca Grande | 33 | $5,428 | $674.31 | 38% |
| Bradenton Beach | 52 | $5,383 | $547.91 | 48% |
| Captiva | 264 | $5,108 | $711.11 | 36% |
| Indian Rocks Beach | 848 | $5,054 | $404.90 | 48% |
| Siesta Key | 1,143 | $4,700 | $493.17 | 43% |
| Seminole | 525 | $4,302 | $304.47 | 55% |
| Belleair Beach | 104 | $4,278 | $321.14 | 51% |
| Largo | 718 | $3,793 | $262.53 | 55% |
| Apollo Beach | 113 | $3,737 | $323.90 | 49% |