Celebration Airbnb Market Analysis 2026: Short Term Rental Data & Vacation Rental Statistics in Florida, United States
Is Airbnb profitable in Celebration in 2026? Explore comprehensive Airbnb analytics for Celebration, Florida, United States to uncover income potential. This 2026 STR market report for Celebration, based on AirROI data from February 2025 to January 2026, reveals key trends in the market of 611 active listings.
Whether you're considering an Airbnb investment in Celebration, optimizing your existing vacation rental, or exploring rental arbitrage opportunities, understanding the Celebration Airbnb data is crucial. Leveraging the low regulation environment is key to maximizing your short term rental income potential. Let's dive into the specifics.
Key Celebration Airbnb Performance Metrics Overview
Monthly Airbnb Revenue Variations & Income Potential in Celebration (2026)
Understanding the monthly revenue variations for Airbnb listings in Celebration is key to maximizing your short term rental income potential. Seasonality significantly impacts earnings. Our analysis, based on data from the past 12 months, shows that the peak revenue month for STRs in Celebration is typically March, while September often presents the lowest earnings, highlighting opportunities for strategic pricing adjustments during shoulder and low seasons. Explore the typical Airbnb income in Celebration across different performance tiers:
- Best-in-class properties (Top 10%) achieve $5,377+ monthly, often utilizing dynamic pricing and superior guest experiences.
- Strong performing properties (Top 25%) earn $3,997 or more, indicating effective management and desirable locations/amenities.
- Typical properties (Median) generate around $2,343 per month, representing the average market performance.
- Entry-level properties (Bottom 25%) see earnings around $1,182, often with potential for optimization.
Average Monthly Airbnb Earnings Trend in Celebration
Celebration Airbnb Occupancy Rate Trends (2026)
Maximize your bookings by understanding the Celebration STR occupancy trends. Seasonal demand shifts significantly influence how often properties are booked. Typically, Marchsees the highest demand (peak season occupancy), while January experiences the lowest (low season). Effective strategies, like adjusting minimum stays or offering promotions, can boost occupancy during slower periods. Here's how different property tiers perform in Celebration:
- Best-in-class properties (Top 10%) achieve 89%+ occupancy, indicating high desirability and potentially optimized availability.
- Strong performing properties (Top 25%) maintain 77% or higher occupancy, suggesting good market fit and guest satisfaction.
- Typical properties (Median) have an occupancy rate around 54%.
- Entry-level properties (Bottom 25%) average 26% occupancy, potentially facing higher vacancy.
Average Monthly Occupancy Rate Trend in Celebration
Average Daily Rate (ADR) Airbnb Trends in Celebration (2026)
Effective short term rental pricing strategy in Celebration involves understanding monthly ADR fluctuations. The Average Daily Rate (ADR) for Airbnb in Celebration typically peaks in December and dips lowest during May. Leveraging Airbnb dynamic pricing tools or strategies based on this seasonality can significantly boost revenue. Here's a look at the typical nightly rates achieved:
- Best-in-class properties (Top 10%) command rates of $252+ per night, often due to premium features or locations.
- Strong performing properties (Top 25%) achieve nightly rates of $198 or more.
- Typical properties (Median) charge around $149 per night.
- Entry-level properties (Bottom 25%) earn around $115 per night.
Average Daily Rate (ADR) Trend by Month in Celebration
Get Live Celebration Market Intelligence 👇

Explore Real-time Analytics
Airbnb Seasonality Analysis & Trends in Celebration (2026)
Peak Season (March, July, December)
- Revenue averages $3,192 per month
- Occupancy rates average 54.6%
- Daily rates average $183
Shoulder Season
- Revenue averages $2,785 per month
- Occupancy maintains around 54.0%
- Daily rates hold near $173
Low Season (January, May, September)
- Revenue drops to average $2,356 per month
- Occupancy decreases to average 44.2%
- Daily rates adjust to average $177
Seasonality Insights for Celebration
- The Airbnb seasonality in Celebration shows moderate seasonality with distinct peak and low periods. While the sections above show seasonal averages, it's also insightful to look at the extremes:
- During the high season, the absolute peak month showcases Celebration's highest earning potential, with monthly revenues capable of climbing to $3,247, occupancy reaching a high of 63.4%, and ADRs peaking at $199.
- Conversely, the slowest single month of the year, typically falling within the low season, marks the market's lowest point. In this month, revenue might dip to $2,181, occupancy could drop to 42.1%, and ADRs may adjust down to $167.
- Understanding both the seasonal averages and these monthly peaks and troughs in revenue, occupancy, and ADR is crucial for maximizing your Airbnb profit potential in Celebration.
Seasonal Strategies for Maximizing Profit
- Peak Season: Maximize revenue through premium pricing and potentially longer minimum stays. Ensure high availability.
- Low Season: Offer competitive pricing, special promotions (e.g., extended stay discounts), and flexible cancellation policies. Target off-season travelers like remote workers or budget-conscious guests.
- Shoulder Seasons: Implement dynamic pricing that balances peak and low rates. Target weekend travelers or specific events. Offer slightly more flexible terms than peak season.
- Regularly analyze your own performance against these Celebration seasonality benchmarks and adjust your pricing and availability strategy accordingly.
Best Areas for Airbnb Investment in Celebration (2026)
Exploring the top neighborhoods for short-term rentals in Celebration? This section highlights key areas, outlining why they are attractive for hosts and guests, along with notable local attractions. Consider these locations based on your target guest profile and investment strategy.
| Neighborhood / Area | Why Host Here? (Target Guests & Appeal) | Key Attractions & Landmarks |
|---|---|---|
| Celebration Downtown | Charming area known for its picturesque streets and quaint shops, making it a favorite among families and tourists. | Celebration Town Center, Lake Rianhard, Celebration Farmers Market, Celebration Golf Club, The Bohemian Hotel |
| Lake Buena Vista | Close proximity to Walt Disney World, providing convenient access to the theme parks. Popular with families and vacationers. | Walt Disney World, Disney Springs, Epcot, Magic Kingdom, Typhoon Lagoon |
| Mystic Dunes | A resort-style area with vacation homes and proximity to attractions, appealing to those looking for a more laid-back atmosphere. | Mystic Dunes Golf Club, Orlando Premium Outlets, Reunion Resort |
| Westside | Residential area near amusement parks, suitable for families and larger groups seeking convenience and comfort. | Disney's Animal Kingdom, Blizzard Beach, ESPN Wide World of Sports |
| Kissimmee | Offers a variety of accommodations and dining options, known for its tourist attractions and budget-friendly options. | Old Town Kissimmee, Fun Spot America, Lake Tohopekaliga, Kissimmee Go-Karts |
| Orlando International Drive | Central location with major attractions, restaurants, and entertainment options, popular with tourists. | Universal Studios, SeaWorld Orlando, Orlando Eye, The Mall at Millenia |
| Four Corners | Growing area attracting investment due to its convenient location to theme parks and new developments. | Nearby golf courses, Shopping centers, Natural parks |
| Sandy Ridge | Quiet community with vacation homes, ideal for families looking for relaxation after theme park visits. | Local parks, Walking trails, Community swimming pool |
Understanding Airbnb License Requirements & STR Laws in Celebration (2026)
While Celebration, Florida, United States currently shows low STR regulations, specific Airbnb license requirements might still exist or change. Always verify the latest short term rental regulations and Airbnb license requirements directly with local government authorities for Celebration to ensure full compliance before hosting.
(Source: AirROI data, 2026, based on 1% licensed listings)
Top Performing Airbnb Properties in Celebration (2026)
Benchmark your potential! Explore examples of top-performing Airbnb properties in Celebrationbased on Trailing Twelve Month (TTM) revenue. Analyze their characteristics, revenue, occupancy rate, and ADR to understand what drives success in this market.
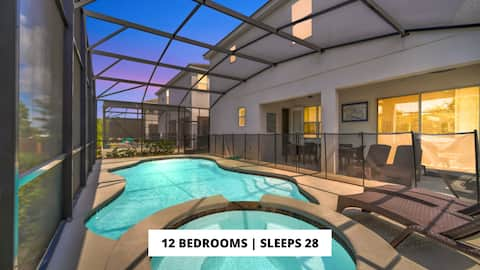
12BR | 11.5 BA > Sports Game Room!
Entire Place • 12 bedrooms
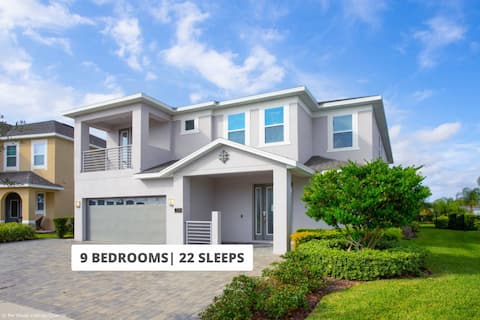
Stylish Family Home Private Pool
Entire Place • 9 bedrooms
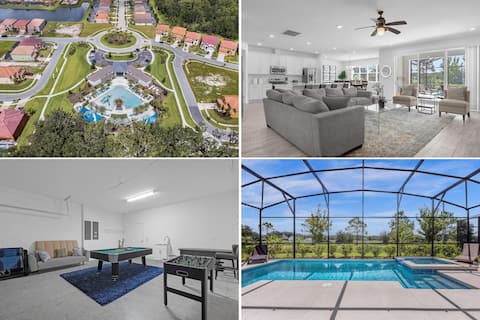
9 BD/7 BA Sleeps 18! Veranda Palms (2493 SD)
Entire Place • 9 bedrooms
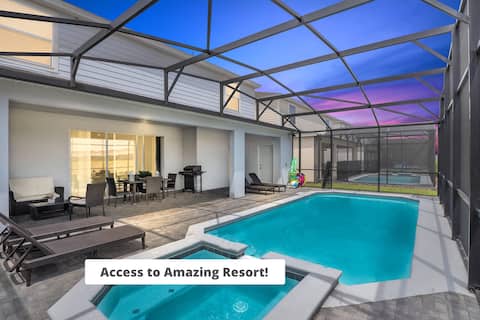
Gated & Spacious, Full Resort Access!
Entire Place • 8 bedrooms
5 Bd/4 Ba Sleeps 10! Storey Lake (2601 SS)
Entire Place • 5 bedrooms

Sea Shore at Solara Resort 401
Entire Place • 7 bedrooms
Note: Performance varies based on location, size, amenities, seasonality, and management quality. Data reflects the past 12 months.
Top Performing Airbnb Hosts in Celebration (2026)
Learn from the best! This table showcases top-performing Airbnb hosts in Celebration based on the number of properties managed and estimated total revenue over the past year. Analyze their scale and performance metrics.
| Host Name | Properties | Grossing Revenue | Stay Reviews | Avg Rating |
|---|---|---|---|---|
| Helen & Sam - Canaan Vacation | 26 | $1,582,939 | 4370 | 4.80/5.0 |
| Paula | 40 | $1,351,718 | 1526 | 4.83/5.0 |
| Hector And Ale | 18 | $1,323,987 | 692 | 4.72/5.0 |
| Laura | 34 | $741,257 | 8107 | 4.77/5.0 |
| Rodrigo (Master Vacation Home | 11 | $693,354 | 527 | 4.73/5.0 |
| Rodrigo (Master Vacation Home | 9 | $407,608 | 424 | 4.71/5.0 |
| Paula | 7 | $379,645 | 1413 | 4.82/5.0 |
| Invilla | 8 | $301,287 | 658 | 4.88/5.0 |
| Regal Oaks Resort By IDILIQ | 19 | $236,539 | 7667 | 4.37/5.0 |
| Brian (黄永怡) | 52 | $233,480 | 1972 | 4.70/5.0 |
Analyzing the strategies of top hosts, such as their property selection, pricing, and guest communication, can offer valuable lessons for optimizing your own Airbnb operations in Celebration.
Dive Deeper: Advanced Celebration STR Market Data (2026)
Ready to unlock more insights? AirROI provides access to advanced metrics and comprehensive Airbnb data for Celebration. Explore detailed analytics beyond this report to refine your investment strategy, optimize pricing, and maximize your vacation rental profits.
Explore Advanced MetricsCelebration Short-Term Rental Market Composition (2026): Property & Room Types
Room Type Distribution
Property Type Distribution
Market Composition Insights for Celebration
- The Celebration Airbnb market composition is heavily skewed towards Entire Home/Apt listings, which make up 92.5% of the 611 active rentals. This indicates strong guest preference for privacy and space.
- Looking at the property type distribution in Celebration, House properties are the most common (48.9%), reflecting the local real estate landscape.
- Houses represent a significant 48.9% portion, catering likely to families or larger groups.
- The presence of 6.9% Hotel/Boutique listings indicates integration with traditional hospitality.
- Smaller segments like others (combined 0.2%) offer potential for unique stay experiences.
Celebration Airbnb Room Capacity Analysis (2026): Bedroom Distribution
Distribution of Listings by Number of Bedrooms
Room Capacity Insights for Celebration
- The dominant room capacity in Celebration is 1 bedroom listings, making up 40.4% of the market. This suggests a strong demand for properties suitable for couples or solo travelers.
- Together, 1 bedroom and 2 bedrooms properties represent 64.9% of the active Airbnb listings in Celebration, indicating a high concentration in these sizes.
- A significant 34.5% of listings offer 3+ bedrooms, catering to larger groups and families seeking more space in Celebration.
Celebration Vacation Rental Guest Capacity Trends (2026)
Distribution of Listings by Guest Capacity
Guest Capacity Insights for Celebration
- The most common guest capacity trend in Celebration vacation rentals is listings accommodating 8+ guests (36.8%). This suggests the primary traveler segment is likely larger groups.
- Properties designed for 8+ guests and 6 guests dominate the Celebration STR market, accounting for 71.8% of listings.
- 72.9% of properties accommodate 6+ guests, serving the market segment for larger families or group travel in Celebration.
- On average, properties in Celebration are equipped to host 6.2 guests.
Celebration Airbnb Booking Patterns (2026): Available vs. Booked Days
Available Days Distribution
Booked Days Distribution
Booking Pattern Insights for Celebration
- The most common availability pattern in Celebration falls within the 271-366 days range, representing 41.1% of listings. This suggests many properties have significant open periods on their calendars.
- Approximately 60.1% of listings show high availability (181+ days open annually), indicating potential for increased bookings or specific owner usage patterns.
- For booked days, the 181-270 days range is most frequent in Celebration (24.2%), reflecting common guest stay durations or potential owner blocking patterns.
- A notable 40.4% of properties secure long booking periods (181+ days booked per year), highlighting successful long-term rental strategies or significant owner usage.
Celebration Airbnb Minimum Stay Requirements Analysis
Distribution of Listings by Minimum Night Requirement
1 Night
155 listings
25.4% of total
2 Nights
122 listings
20% of total
3 Nights
46 listings
7.5% of total
4-6 Nights
31 listings
5.1% of total
7-29 Nights
27 listings
4.4% of total
30+ Nights
230 listings
37.6% of total
Key Insights
- The most prevalent minimum stay requirement in Celebration is 30+ Nights, adopted by 37.6% of listings. This highlights the market's preference for longer commitments.
- A significant segment (37.6%) caters to monthly stays (30+ nights) in Celebration, pointing to opportunities in the extended-stay market.
Recommendations
- Align with the market by considering a 30+ Nights minimum stay, as 37.6% of Celebration hosts use this setting.
- If feasible, allowing 1-night stays, especially midweek or during low season, could capture last-minute bookings, as only 25.4% currently do.
- Explore offering discounts for stays of 30+ nights to attract the 37.6% of the market seeking extended stays.
- Adjust minimum nights based on seasonality – potentially shorter during low season and longer during peak demand periods in Celebration.
Celebration Airbnb Cancellation Policy Trends Analysis (2026)
Super Strict 60 Days
1 listings
0.2% of total
Limited
11 listings
1.8% of total
Super Strict 30 Days
2 listings
0.3% of total
Flexible
122 listings
20% of total
Moderate
160 listings
26.3% of total
Firm
231 listings
37.9% of total
Strict
82 listings
13.5% of total
Cancellation Policy Insights for Celebration
- The prevailing Airbnb cancellation policy trend in Celebration is Firm, used by 37.9% of listings.
- A majority (51.4%) of hosts in Celebration utilize Firm or Strict policies, indicating a market where hosts prioritize booking security.
Recommendations for Hosts
- Consider adopting a Firm policy to align with the 37.9% market standard in Celebration.
- Using a Strict policy might deter some guests, as only 13.5% of listings use it. Evaluate if potential revenue protection outweighs possible lower booking rates.
- Regularly review your cancellation policy against competitors and market demand shifts in Celebration.
Celebration STR Booking Lead Time Analysis (2026)
Average Booking Lead Time by Month
Booking Lead Time Insights for Celebration
- The overall average booking lead time for vacation rentals in Celebration is 50 days.
- Guests book furthest in advance for stays during December (average 68 days), likely coinciding with peak travel demand or local events.
- The shortest booking windows occur for stays in June (average 40 days), indicating more last-minute travel plans during this time.
- Seasonally, Winter (63 days avg.) sees the longest lead times, while Summer (44 days avg.) has the shortest, reflecting typical travel planning cycles.
Recommendations for Hosts
- Use the overall average lead time (50 days) as a baseline for your pricing and availability strategy in Celebration.
- For December stays, consider implementing length-of-stay discounts or slightly higher rates for bookings made less than 68 days out to capitalize on advance planning.
- Target marketing efforts for the Winter season well in advance (at least 63 days) to capture early planners.
- Monitor your own booking lead times against these Celebration averages to identify opportunities for dynamic pricing adjustments.
Popular & Essential Airbnb Amenities in Celebration (2026)
Amenity Prevalence
Amenity Insights for Celebration
- Essential amenities in Celebration that guests expect include: Air conditioning, Wifi, TV, Pool, Smoke alarm, Free parking on premises, Kitchen. Lacking these (any) could significantly impact bookings.
- Popular amenities like Hair dryer, Heating, Iron are common but not universal. Offering these can provide a competitive edge.
Recommendations for Hosts
- Ensure your listing includes all essential amenities for Celebration: Air conditioning, Wifi, TV, Pool, Smoke alarm, Free parking on premises, Kitchen.
- Prioritize adding missing essentials: Wifi, TV, Pool, Smoke alarm, Free parking on premises, Kitchen.
- Consider adding popular differentiators like Hair dryer or Heating to increase appeal.
- Highlight unique or less common amenities you offer (e.g., hot tub, dedicated workspace, EV charger) in your listing description and photos.
- Regularly check competitor amenities in Celebration to stay competitive.
Celebration Airbnb Guest Demographics & Profile Analysis (2026)
Guest Profile Summary for Celebration
- The typical guest profile for Airbnb in Celebration consists of primarily domestic travelers (78%), often arriving from nearby Miami, typically belonging to the Post-2000s (Gen Z/Alpha) group (50%), primarily speaking English or Spanish.
- Domestic travelers account for 78.4% of guests.
- Key international markets include United States (78.4%) and Canada (5.2%).
- Top languages spoken are English (61.9%) followed by Spanish (22.8%).
- A significant demographic segment is the Post-2000s (Gen Z/Alpha) group, representing 50% of guests.
Recommendations for Hosts
- Target domestic marketing efforts towards travelers from Miami and New York.
- Tailor amenities and listing descriptions to appeal to the dominant Post-2000s (Gen Z/Alpha) demographic (e.g., highlight fast WiFi, smart home features, local guides).
- Highlight unique local experiences or amenities relevant to the primary guest profile.
- Consider seasonal promotions aligned with peak travel times for key origin markets.
Nearby Short-Term Rental Market Comparison
How does the Celebration Airbnb market stack up against its neighbors? Compare key performance metrics like average monthly revenue, ADR, and occupancy rates in surrounding areas to understand the broader regional STR landscape.
| Market | Active Properties | Monthly Revenue | Daily Rate | Avg. Occupancy |
|---|---|---|---|---|
| Sailfish Point | 19 | $16,709 | $1587.63 | 48% |
| Anna Maria island | 587 | $7,996 | $823.96 | 41% |
| Anna Maria | 56 | $6,434 | $692.96 | 52% |
| Reunion | 12 | $6,321 | $580.45 | 44% |
| Vilano Beach | 173 | $5,571 | $442.95 | 45% |
| Indian Rocks Beach | 842 | $5,560 | $419.63 | 49% |
| Melbourne Beach | 275 | $5,384 | $488.83 | 43% |
| Siesta Key | 1,175 | $5,206 | $518.91 | 42% |
| Belleair Beach | 94 | $5,086 | $339.65 | 53% |
| Bradenton Beach | 122 | $4,977 | $507.12 | 42% |