Carrabelle Airbnb Market Analysis 2026: Short Term Rental Data & Vacation Rental Statistics in Florida, United States
Is Airbnb profitable in Carrabelle in 2026? Explore comprehensive Airbnb analytics for Carrabelle, Florida, United States to uncover income potential. This 2026 STR market report for Carrabelle, based on AirROI data from February 2025 to January 2026, reveals key trends in the niche market of 178 active listings.
Whether you're considering an Airbnb investment in Carrabelle, optimizing your existing vacation rental, or exploring rental arbitrage opportunities, understanding the Carrabelle Airbnb data is crucial. Leveraging the low regulation environment is key to maximizing your short term rental income potential. Let's dive into the specifics.
Key Carrabelle Airbnb Performance Metrics Overview
Monthly Airbnb Revenue Variations & Income Potential in Carrabelle (2026)
Understanding the monthly revenue variations for Airbnb listings in Carrabelle is key to maximizing your short term rental income potential. Seasonality significantly impacts earnings. Our analysis, based on data from the past 12 months, shows that the peak revenue month for STRs in Carrabelle is typically July, while January often presents the lowest earnings, highlighting opportunities for strategic pricing adjustments during shoulder and low seasons. Explore the typical Airbnb income in Carrabelle across different performance tiers:
- Best-in-class properties (Top 10%) achieve $4,991+ monthly, often utilizing dynamic pricing and superior guest experiences.
- Strong performing properties (Top 25%) earn $2,897 or more, indicating effective management and desirable locations/amenities.
- Typical properties (Median) generate around $1,617 per month, representing the average market performance.
- Entry-level properties (Bottom 25%) see earnings around $845, often with potential for optimization.
Average Monthly Airbnb Earnings Trend in Carrabelle
Carrabelle Airbnb Occupancy Rate Trends (2026)
Maximize your bookings by understanding the Carrabelle STR occupancy trends. Seasonal demand shifts significantly influence how often properties are booked. Typically, Junesees the highest demand (peak season occupancy), while January experiences the lowest (low season). Effective strategies, like adjusting minimum stays or offering promotions, can boost occupancy during slower periods. Here's how different property tiers perform in Carrabelle:
- Best-in-class properties (Top 10%) achieve 66%+ occupancy, indicating high desirability and potentially optimized availability.
- Strong performing properties (Top 25%) maintain 48% or higher occupancy, suggesting good market fit and guest satisfaction.
- Typical properties (Median) have an occupancy rate around 29%.
- Entry-level properties (Bottom 25%) average 15% occupancy, potentially facing higher vacancy.
Average Monthly Occupancy Rate Trend in Carrabelle
Average Daily Rate (ADR) Airbnb Trends in Carrabelle (2026)
Effective short term rental pricing strategy in Carrabelle involves understanding monthly ADR fluctuations. The Average Daily Rate (ADR) for Airbnb in Carrabelle typically peaks in October and dips lowest during February. Leveraging Airbnb dynamic pricing tools or strategies based on this seasonality can significantly boost revenue. Here's a look at the typical nightly rates achieved:
- Best-in-class properties (Top 10%) command rates of $341+ per night, often due to premium features or locations.
- Strong performing properties (Top 25%) achieve nightly rates of $258 or more.
- Typical properties (Median) charge around $185 per night.
- Entry-level properties (Bottom 25%) earn around $142 per night.
Average Daily Rate (ADR) Trend by Month in Carrabelle
Get Live Carrabelle Market Intelligence 👇

Explore Real-time Analytics
Airbnb Seasonality Analysis & Trends in Carrabelle (2026)
Peak Season (July, June, March)
- Revenue averages $3,198 per month
- Occupancy rates average 46.0%
- Daily rates average $206
Shoulder Season
- Revenue averages $2,163 per month
- Occupancy maintains around 32.5%
- Daily rates hold near $207
Low Season (January, November, December)
- Revenue drops to average $1,634 per month
- Occupancy decreases to average 23.9%
- Daily rates adjust to average $224
Seasonality Insights for Carrabelle
- The Airbnb seasonality in Carrabelle shows highly seasonal trends requiring careful strategy. While the sections above show seasonal averages, it's also insightful to look at the extremes:
- During the high season, the absolute peak month showcases Carrabelle's highest earning potential, with monthly revenues capable of climbing to $3,471, occupancy reaching a high of 48.1%, and ADRs peaking at $227.
- Conversely, the slowest single month of the year, typically falling within the low season, marks the market's lowest point. In this month, revenue might dip to $1,463, occupancy could drop to 22.5%, and ADRs may adjust down to $189.
- Understanding both the seasonal averages and these monthly peaks and troughs in revenue, occupancy, and ADR is crucial for maximizing your Airbnb profit potential in Carrabelle.
Seasonal Strategies for Maximizing Profit
- Peak Season: Maximize revenue through premium pricing and potentially longer minimum stays. Ensure high availability.
- Low Season: Offer competitive pricing, special promotions (e.g., extended stay discounts), and flexible cancellation policies. Target off-season travelers like remote workers or budget-conscious guests.
- Shoulder Seasons: Implement dynamic pricing that balances peak and low rates. Target weekend travelers or specific events. Offer slightly more flexible terms than peak season.
- Regularly analyze your own performance against these Carrabelle seasonality benchmarks and adjust your pricing and availability strategy accordingly.
Best Areas for Airbnb Investment in Carrabelle (2026)
Exploring the top neighborhoods for short-term rentals in Carrabelle? This section highlights key areas, outlining why they are attractive for hosts and guests, along with notable local attractions. Consider these locations based on your target guest profile and investment strategy.
| Neighborhood / Area | Why Host Here? (Target Guests & Appeal) | Key Attractions & Landmarks |
|---|---|---|
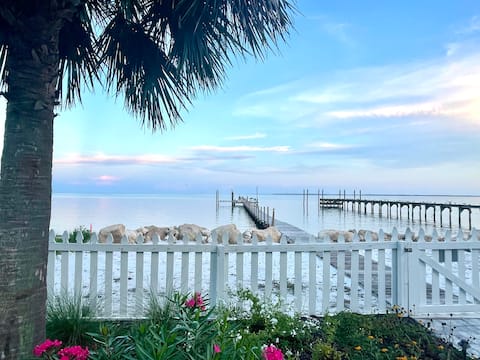
| Carrabelle Beach | A beautiful stretch of white sand beach along the Gulf of Mexico. Ideal for families and beachgoers looking for a relaxing seaside getaway. | Carrabelle Beach, Gulf Island National Seashore, Camp Gordon Johnston Museum, St. George Island State Park |
| St. George Island | Nearby island known for its stunning natural beauty and tranquil environment. Great for fishing, boating, and enjoying nature, attracts vacationers seeking a peaceful retreat. | St. George Island State Park, Dr. Julian G. Bruce St. George Island State Park, St. George Island Lighthouse, Econfina River State Park |
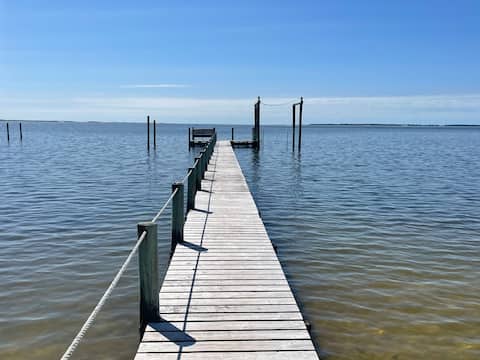
| Carrabelle River | A picturesque river area great for nature lovers and recreational activities like fishing and kayaking. Inviting for those who enjoy scenic views and wildlife. | Carrabelle River, Fishing charters, Kayaking and paddle boarding opportunities, Wildlife observation |
| Apalachicola | Just a short drive away, this charming historic town is known for its seafood and rich history. Attracts visitors interested in culture and heritage. | Apalachicola River, Historic downtown, Apalachicola National Estuarine Research Reserve, Local seafood restaurants |
| Panacea | A quaint coastal community known for its access to nature and barrier islands. Ideal for eco-tourism and outdoor activities. | Ochlockonee River, Gulf Coast Bird Observatory, Alligator Point Beach, Local seafood dining |
| Eastpoint | A small, scenic town near the coast that is known for its friendly atmosphere and local culture. Great for visitors looking for a laid-back experience. | Scenic views of Apalachicola Bay, Local art shops, Fresh seafood markets |
| St. Vincent Island | A nearby uninhabited island offering pristine natural landscapes and wildlife. Perfect for eco-tours and nature enthusiasts. | St. Vincent National Wildlife Refuge, Birdwatching, Nature trails |
| Tallahassee (1.5 hours away) | The state capital offers a range of attractions, including parks, museums, and cultural sites. An excellent choice for guests looking to explore a larger city. | Florida State University, Tallahassee Museum, Cascade Park, Old Capitol Museum |
Understanding Airbnb License Requirements & STR Laws in Carrabelle (2026)
While Carrabelle, Florida, United States currently shows low STR regulations, specific Airbnb license requirements might still exist or change. Always verify the latest short term rental regulations and Airbnb license requirements directly with local government authorities for Carrabelle to ensure full compliance before hosting.
(Source: AirROI data, 2026, finding no licensed listings among those analyzed)
Top Performing Airbnb Properties in Carrabelle (2026)
Benchmark your potential! Explore examples of top-performing Airbnb properties in Carrabellebased on Trailing Twelve Month (TTM) revenue. Analyze their characteristics, revenue, occupancy rate, and ADR to understand what drives success in this market.
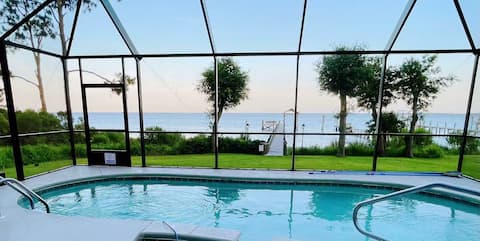
Heavenly Hideaway: Waterfront, Pool, Fishing, Golf
Entire Place • 3 bedrooms

The Bella Beach Treehouse: New Pool. Kayak. Golf
Entire Place • 3 bedrooms
lily’s Escaped, Waterfront, pool,fishing, golf
Entire Place • 3 bedrooms
Coastal Adventures Waterfront!
Entire Place • 3 bedrooms
Seaside Sunrise 2BR/1BA beachfront home
Entire Place • 2 bedrooms
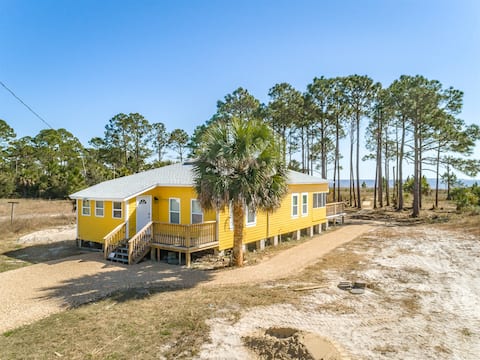
Allure- Beautiful 4BR/2BA house on the bay
Entire Place • 4 bedrooms
Note: Performance varies based on location, size, amenities, seasonality, and management quality. Data reflects the past 12 months.
Top Performing Airbnb Hosts in Carrabelle (2026)
Learn from the best! This table showcases top-performing Airbnb hosts in Carrabelle based on the number of properties managed and estimated total revenue over the past year. Analyze their scale and performance metrics.
| Host Name | Properties | Grossing Revenue | Stay Reviews | Avg Rating |
|---|---|---|---|---|
| Sandy Beach Properties | 48 | $762,577 | 483 | 4.73/5.0 |
| Kelly | 10 | $270,240 | 685 | 4.95/5.0 |
| Mimi | 2 | $203,620 | 238 | 4.81/5.0 |
| Krista | 8 | $184,153 | 126 | 4.94/5.0 |
| Evolve | 5 | $131,134 | 136 | 4.74/5.0 |
| Bill | 1 | $76,702 | 43 | 5.00/5.0 |
| Jessica | 2 | $69,974 | 212 | 4.89/5.0 |
| Doreen | 1 | $61,863 | 94 | 4.98/5.0 |
| Christina | 2 | $57,086 | 58 | 4.93/5.0 |
| Bonnie | 1 | $56,738 | 100 | 4.92/5.0 |
Analyzing the strategies of top hosts, such as their property selection, pricing, and guest communication, can offer valuable lessons for optimizing your own Airbnb operations in Carrabelle.
Dive Deeper: Advanced Carrabelle STR Market Data (2026)
Ready to unlock more insights? AirROI provides access to advanced metrics and comprehensive Airbnb data for Carrabelle. Explore detailed analytics beyond this report to refine your investment strategy, optimize pricing, and maximize your vacation rental profits.
Explore Advanced MetricsCarrabelle Short-Term Rental Market Composition (2026): Property & Room Types
Room Type Distribution
Property Type Distribution
Market Composition Insights for Carrabelle
- The Carrabelle Airbnb market composition is heavily skewed towards Entire Home/Apt listings, which make up 94.9% of the 178 active rentals. This indicates strong guest preference for privacy and space.
- Looking at the property type distribution in Carrabelle, House properties are the most common (71.9%), reflecting the local real estate landscape.
- Houses represent a significant 71.9% portion, catering likely to families or larger groups.
- Smaller segments like outdoor/unique, hotel/boutique, others (combined 6.2%) offer potential for unique stay experiences.
Carrabelle Airbnb Room Capacity Analysis (2026): Bedroom Distribution
Distribution of Listings by Number of Bedrooms
Room Capacity Insights for Carrabelle
- The dominant room capacity in Carrabelle is 3 bedrooms listings, making up 35.4% of the market. This suggests a strong demand for properties suitable for families or small groups.
- Together, 3 bedrooms and 2 bedrooms properties represent 64.6% of the active Airbnb listings in Carrabelle, indicating a high concentration in these sizes.
- A significant 43.3% of listings offer 3+ bedrooms, catering to larger groups and families seeking more space in Carrabelle.
Carrabelle Vacation Rental Guest Capacity Trends (2026)
Distribution of Listings by Guest Capacity
Guest Capacity Insights for Carrabelle
- The most common guest capacity trend in Carrabelle vacation rentals is listings accommodating 6 guests (33.7%). This suggests the primary traveler segment is likely larger groups.
- Properties designed for 6 guests and 4 guests dominate the Carrabelle STR market, accounting for 57.3% of listings.
- 61.8% of properties accommodate 6+ guests, serving the market segment for larger families or group travel in Carrabelle.
- On average, properties in Carrabelle are equipped to host 5.5 guests.
Carrabelle Airbnb Booking Patterns (2026): Available vs. Booked Days
Available Days Distribution
Booked Days Distribution
Booking Pattern Insights for Carrabelle
- The most common availability pattern in Carrabelle falls within the 271-366 days range, representing 58.4% of listings. This suggests many properties have significant open periods on their calendars.
- Approximately 94.4% of listings show high availability (181+ days open annually), indicating potential for increased bookings or specific owner usage patterns.
- For booked days, the 31-90 days range is most frequent in Carrabelle (37.1%), reflecting common guest stay durations or potential owner blocking patterns.
- A notable 6.7% of properties secure long booking periods (181+ days booked per year), highlighting successful long-term rental strategies or significant owner usage.
Carrabelle Airbnb Minimum Stay Requirements Analysis
Distribution of Listings by Minimum Night Requirement
1 Night
17 listings
9.6% of total
2 Nights
78 listings
43.8% of total
3 Nights
26 listings
14.6% of total
4-6 Nights
5 listings
2.8% of total
7-29 Nights
5 listings
2.8% of total
30+ Nights
47 listings
26.4% of total
Key Insights
- The most prevalent minimum stay requirement in Carrabelle is 2 Nights, adopted by 43.8% of listings. This highlights the market's preference for shorter, flexible bookings.
- A significant segment (26.4%) caters to monthly stays (30+ nights) in Carrabelle, pointing to opportunities in the extended-stay market.
Recommendations
- Align with the market by considering a 2 Nights minimum stay, as 43.8% of Carrabelle hosts use this setting.
- If feasible, allowing 1-night stays, especially midweek or during low season, could capture last-minute bookings, as only 9.6% currently do.
- A 2-night minimum appears standard (43.8%). Consider this for weekends or peak periods.
- Explore offering discounts for stays of 30+ nights to attract the 26.4% of the market seeking extended stays.
- Adjust minimum nights based on seasonality – potentially shorter during low season and longer during peak demand periods in Carrabelle.
Carrabelle Airbnb Cancellation Policy Trends Analysis (2026)
Super Strict 30 Days
3 listings
1.7% of total
Super Strict 60 Days
47 listings
26.4% of total
Limited
2 listings
1.1% of total
Flexible
29 listings
16.3% of total
Moderate
39 listings
21.9% of total
Firm
43 listings
24.2% of total
Strict
15 listings
8.4% of total
Cancellation Policy Insights for Carrabelle
- The prevailing Airbnb cancellation policy trend in Carrabelle is Super Strict 60 Days, used by 26.4% of listings.
- There's a relatively balanced mix between guest-friendly (38.2%) and stricter (32.6%) policies, offering choices for different guest needs.
- Strict cancellation policies are quite rare (8.4%), potentially making listings with this policy less competitive unless justified by high demand or property type.
Recommendations for Hosts
- Consider adopting a Super Strict 60 Days policy to align with the 26.4% market standard in Carrabelle.
- Using a Strict policy might deter some guests, as only 8.4% of listings use it. Evaluate if potential revenue protection outweighs possible lower booking rates.
- Regularly review your cancellation policy against competitors and market demand shifts in Carrabelle.
Carrabelle STR Booking Lead Time Analysis (2026)
Average Booking Lead Time by Month
Booking Lead Time Insights for Carrabelle
- The overall average booking lead time for vacation rentals in Carrabelle is 44 days.
- Guests book furthest in advance for stays during March (average 63 days), likely coinciding with peak travel demand or local events.
- The shortest booking windows occur for stays in December (average 37 days), indicating more last-minute travel plans during this time.
- Seasonally, Spring (52 days avg.) sees the longest lead times, while Fall (41 days avg.) has the shortest, reflecting typical travel planning cycles.
Recommendations for Hosts
- Use the overall average lead time (44 days) as a baseline for your pricing and availability strategy in Carrabelle.
- For March stays, consider implementing length-of-stay discounts or slightly higher rates for bookings made less than 63 days out to capitalize on advance planning.
- Target marketing efforts for the Spring season well in advance (at least 52 days) to capture early planners.
- Monitor your own booking lead times against these Carrabelle averages to identify opportunities for dynamic pricing adjustments.
Popular & Essential Airbnb Amenities in Carrabelle (2026)
Amenity Prevalence
Amenity Insights for Carrabelle
- Essential amenities in Carrabelle that guests expect include: Air conditioning, Wifi, TV. Lacking these (any) could significantly impact bookings.
- Popular amenities like Heating, Kitchen, Coffee maker are common but not universal. Offering these can provide a competitive edge.
Recommendations for Hosts
- Ensure your listing includes all essential amenities for Carrabelle: Air conditioning, Wifi, TV.
- Prioritize adding missing essentials: Air conditioning, Wifi, TV.
- Consider adding popular differentiators like Heating or Kitchen to increase appeal.
- Highlight unique or less common amenities you offer (e.g., hot tub, dedicated workspace, EV charger) in your listing description and photos.
- Regularly check competitor amenities in Carrabelle to stay competitive.
Carrabelle Airbnb Guest Demographics & Profile Analysis (2026)
Guest Profile Summary for Carrabelle
- The typical guest profile for Airbnb in Carrabelle consists of primarily domestic travelers (99%), often arriving from nearby Tallahassee, typically belonging to the Post-2000s (Gen Z/Alpha) group (50%), primarily speaking English or Spanish.
- Domestic travelers account for 98.8% of guests.
- Key international markets include United States (98.8%) and Canada (0.4%).
- Top languages spoken are English (79.1%) followed by Spanish (10.8%).
- A significant demographic segment is the Post-2000s (Gen Z/Alpha) group, representing 50% of guests.
Recommendations for Hosts
- Target domestic marketing efforts towards travelers from Tallahassee and Nashville.
- Tailor amenities and listing descriptions to appeal to the dominant Post-2000s (Gen Z/Alpha) demographic (e.g., highlight fast WiFi, smart home features, local guides).
- Highlight unique local experiences or amenities relevant to the primary guest profile.
- Consider seasonal promotions aligned with peak travel times for key origin markets.
Nearby Short-Term Rental Market Comparison
How does the Carrabelle Airbnb market stack up against its neighbors? Compare key performance metrics like average monthly revenue, ADR, and occupancy rates in surrounding areas to understand the broader regional STR landscape.
| Market | Active Properties | Monthly Revenue | Daily Rate | Avg. Occupancy |
|---|---|---|---|---|
| Saint George Island | 153 | $4,832 | $490.02 | 43% |
| Gulf County | 13 | $4,070 | $471.61 | 36% |
| Alligator Point | 53 | $4,041 | $309.03 | 47% |
| Port St. Joe | 734 | $3,927 | $473.96 | 38% |
| Cape San Blas | 87 | $3,888 | $543.75 | 35% |
| Indian Pass | 35 | $3,882 | $459.62 | 40% |
| Saint Teresa | 16 | $3,411 | $321.37 | 41% |
| Panama City Beach | 9,974 | $3,029 | $325.93 | 41% |
| Eastpoint | 125 | $3,007 | $373.52 | 37% |
| Port Saint Joe | 321 | $2,785 | $329.87 | 38% |