Cape Coral Airbnb Market Analysis 2026: Short Term Rental Data & Vacation Rental Statistics in Florida, United States
Is Airbnb profitable in Cape Coral in 2026? Explore comprehensive Airbnb analytics for Cape Coral, Florida, United States to uncover income potential. This 2026 STR market report for Cape Coral, based on AirROI data from February 2025 to January 2026, reveals key trends in the bustling market of 3,935 active listings.
Whether you're considering an Airbnb investment in Cape Coral, optimizing your existing vacation rental, or exploring rental arbitrage opportunities, understanding the Cape Coral Airbnb data is crucial. Leveraging the low regulation environment is key to maximizing your short term rental income potential. Let's dive into the specifics.
Key Cape Coral Airbnb Performance Metrics Overview
Monthly Airbnb Revenue Variations & Income Potential in Cape Coral (2026)
Understanding the monthly revenue variations for Airbnb listings in Cape Coral is key to maximizing your short term rental income potential. Seasonality significantly impacts earnings. Our analysis, based on data from the past 12 months, shows that the peak revenue month for STRs in Cape Coral is typically March, while September often presents the lowest earnings, highlighting opportunities for strategic pricing adjustments during shoulder and low seasons. Explore the typical Airbnb income in Cape Coral across different performance tiers:
- Best-in-class properties (Top 10%) achieve $7,360+ monthly, often utilizing dynamic pricing and superior guest experiences.
- Strong performing properties (Top 25%) earn $5,081 or more, indicating effective management and desirable locations/amenities.
- Typical properties (Median) generate around $3,096 per month, representing the average market performance.
- Entry-level properties (Bottom 25%) see earnings around $1,581, often with potential for optimization.
Average Monthly Airbnb Earnings Trend in Cape Coral
Cape Coral Airbnb Occupancy Rate Trends (2026)
Maximize your bookings by understanding the Cape Coral STR occupancy trends. Seasonal demand shifts significantly influence how often properties are booked. Typically, Marchsees the highest demand (peak season occupancy), while September experiences the lowest (low season). Effective strategies, like adjusting minimum stays or offering promotions, can boost occupancy during slower periods. Here's how different property tiers perform in Cape Coral:
- Best-in-class properties (Top 10%) achieve 79%+ occupancy, indicating high desirability and potentially optimized availability.
- Strong performing properties (Top 25%) maintain 61% or higher occupancy, suggesting good market fit and guest satisfaction.
- Typical properties (Median) have an occupancy rate around 39%.
- Entry-level properties (Bottom 25%) average 22% occupancy, potentially facing higher vacancy.
Average Monthly Occupancy Rate Trend in Cape Coral
Average Daily Rate (ADR) Airbnb Trends in Cape Coral (2026)
Effective short term rental pricing strategy in Cape Coral involves understanding monthly ADR fluctuations. The Average Daily Rate (ADR) for Airbnb in Cape Coral typically peaks in January and dips lowest during May. Leveraging Airbnb dynamic pricing tools or strategies based on this seasonality can significantly boost revenue. Here's a look at the typical nightly rates achieved:
- Best-in-class properties (Top 10%) command rates of $408+ per night, often due to premium features or locations.
- Strong performing properties (Top 25%) achieve nightly rates of $320 or more.
- Typical properties (Median) charge around $251 per night.
- Entry-level properties (Bottom 25%) earn around $196 per night.
Average Daily Rate (ADR) Trend by Month in Cape Coral
Get Live Cape Coral Market Intelligence 👇

Explore Real-time Analytics
Airbnb Seasonality Analysis & Trends in Cape Coral (2026)
Peak Season (March, February, April)
- Revenue averages $5,568 per month
- Occupancy rates average 61.2%
- Daily rates average $276
Shoulder Season
- Revenue averages $3,387 per month
- Occupancy maintains around 37.8%
- Daily rates hold near $276
Low Season (May, September, October)
- Revenue drops to average $2,510 per month
- Occupancy decreases to average 32.2%
- Daily rates adjust to average $254
Seasonality Insights for Cape Coral
- The Airbnb seasonality in Cape Coral shows highly seasonal trends requiring careful strategy. While the sections above show seasonal averages, it's also insightful to look at the extremes:
- During the high season, the absolute peak month showcases Cape Coral's highest earning potential, with monthly revenues capable of climbing to $6,840, occupancy reaching a high of 70.8%, and ADRs peaking at $322.
- Conversely, the slowest single month of the year, typically falling within the low season, marks the market's lowest point. In this month, revenue might dip to $2,114, occupancy could drop to 28.0%, and ADRs may adjust down to $241.
- Understanding both the seasonal averages and these monthly peaks and troughs in revenue, occupancy, and ADR is crucial for maximizing your Airbnb profit potential in Cape Coral.
Seasonal Strategies for Maximizing Profit
- Peak Season: Maximize revenue through premium pricing and potentially longer minimum stays. Ensure high availability.
- Low Season: Offer competitive pricing, special promotions (e.g., extended stay discounts), and flexible cancellation policies. Target off-season travelers like remote workers or budget-conscious guests.
- Shoulder Seasons: Implement dynamic pricing that balances peak and low rates. Target weekend travelers or specific events. Offer slightly more flexible terms than peak season.
- Regularly analyze your own performance against these Cape Coral seasonality benchmarks and adjust your pricing and availability strategy accordingly.
Best Areas for Airbnb Investment in Cape Coral (2026)
Exploring the top neighborhoods for short-term rentals in Cape Coral? This section highlights key areas, outlining why they are attractive for hosts and guests, along with notable local attractions. Consider these locations based on your target guest profile and investment strategy.
| Neighborhood / Area | Why Host Here? (Target Guests & Appeal) | Key Attractions & Landmarks |
|---|---|---|
| Cape Harbour | A beautiful waterfront community in Cape Coral known for its upscale dining, shopping, and stunning views. Ideal for visitors looking for a relaxing and picturesque setting on the water. | Cape Harbour Marina, Peace River, Tarpon Point Marina, Restaurants & Shops, Waterfront Events |
| Pine Island Road | The main commercial corridor in Cape Coral featuring a range of shops, restaurants, and entertainment. Popular for its accessibility and proximity to attractions. | Cape Coral Sports Complex, Midpoint Bridge, Shopping Plaza, Dining Options, Cinema |
| Tarpon Point | This area features luxury properties and a vibrant marina. A prime location for visitors seeking upscale accommodations with access to boating and water activities. | Tarpon Point Marina, Restaurants with Waterfront Views, Sunset Cruises, Kayaking and Paddleboarding |
| Matlacha | A charming artsy community famous for its colorful buildings and galleries. Great for visitors looking for a unique experience with easy access to local art and the outdoors. | Matlacha Park, Fishing and Boating, Art Galleries, Local Restaurants, Matlacha Community Center |
| Four Freedoms Park | A family-friendly park area featuring recreational activities and facilities. Perfect for families visiting Cape Coral. | Playground, Beach Area, Boat Launch, Picnic Areas, Walking Trails |
| Caloosahatchee River | An ideal spot for those interested in fishing, boating, and enjoying beautiful waterfront views. Attracts outdoor enthusiasts and water lovers. | Fishing Spots, Kayaking, Public Boat Ramps, Riverfront Parks, Wildlife Viewing |
| Coral Oaks Golf Course | A well-maintained golf course that attracts golf enthusiasts. Offering a peaceful atmosphere and scenic views, it's perfect for sports lovers. | Golfing, Pro Shop, Clubhouse, Practice Facilities, Community Events |
| Old Cape Coral | A historic area of Cape Coral with a mix of older homes and new developments. It has local charm and is close to amenities. | Community Events, Local Markets, Gymnastics Center, Historic Sites, Restaurants |
Understanding Airbnb License Requirements & STR Laws in Cape Coral (2026)
While Cape Coral, Florida, United States currently shows low STR regulations, specific Airbnb license requirements might still exist or change. Always verify the latest short term rental regulations and Airbnb license requirements directly with local government authorities for Cape Coral to ensure full compliance before hosting.
(Source: AirROI data, 2026, based on 1% licensed listings)
Top Performing Airbnb Properties in Cape Coral (2026)
Benchmark your potential! Explore examples of top-performing Airbnb properties in Cape Coralbased on Trailing Twelve Month (TTM) revenue. Analyze their characteristics, revenue, occupancy rate, and ADR to understand what drives success in this market.

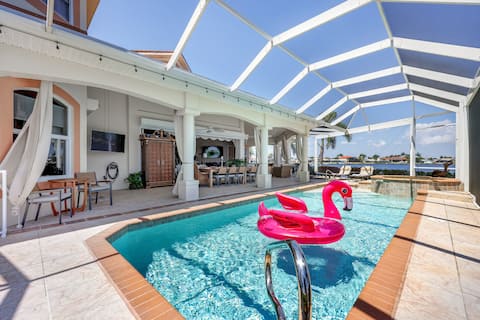
Palazzo Azzurro: Where Luxury Meets Play!
Entire Place • 6 bedrooms
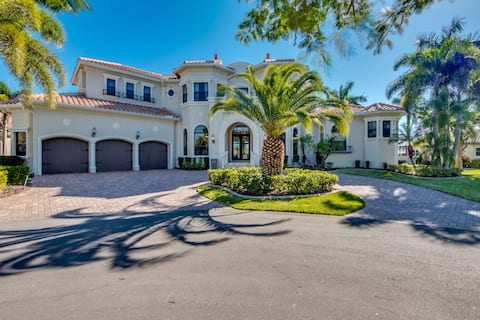
Paradise oasis villa
Entire Place • 6 bedrooms
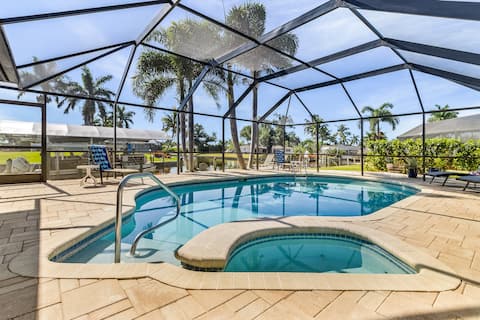
Gulf Access | Heated Pool & 2 Spas | Theatre |
Entire Place • 5 bedrooms

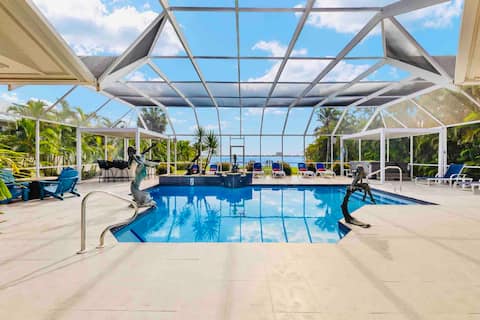
Skyline Paradise Retreat
Entire Place • 5 bedrooms
5 Bedroom Saltwater Pool Home W/Kayaks and Boat!
Entire Place • 5 bedrooms
Luxe Riverfront Retreat~Pool~Spa~Bar~Tropical Yard
Entire Place • 4 bedrooms
Note: Performance varies based on location, size, amenities, seasonality, and management quality. Data reflects the past 12 months.
Top Performing Airbnb Hosts in Cape Coral (2026)
Learn from the best! This table showcases top-performing Airbnb hosts in Cape Coral based on the number of properties managed and estimated total revenue over the past year. Analyze their scale and performance metrics.
| Host Name | Properties | Grossing Revenue | Stay Reviews | Avg Rating |
|---|---|---|---|---|
| Roelens | 333 | $8,804,367 | 3253 | 4.69/5.0 |
| Evolve | 179 | $4,175,482 | 3722 | 4.69/5.0 |
| Vesteva Vacation Rentals | 119 | $3,120,076 | 1794 | 4.77/5.0 |
| Björn | 69 | $1,663,835 | 575 | 4.68/5.0 |
| VacationHit Realty | 32 | $1,661,643 | 1020 | 4.86/5.0 |
| Reto | 40 | $1,462,137 | 170 | 4.89/5.0 |
| CoralVilla | 48 | $1,366,418 | 844 | 4.87/5.0 |
| Rhi | 28 | $1,043,580 | 1794 | 4.84/5.0 |
| Glenn | 20 | $928,115 | 304 | 4.97/5.0 |
| Andrea | 23 | $916,095 | 582 | 4.93/5.0 |
Analyzing the strategies of top hosts, such as their property selection, pricing, and guest communication, can offer valuable lessons for optimizing your own Airbnb operations in Cape Coral.
Dive Deeper: Advanced Cape Coral STR Market Data (2026)
Ready to unlock more insights? AirROI provides access to advanced metrics and comprehensive Airbnb data for Cape Coral. Explore detailed analytics beyond this report to refine your investment strategy, optimize pricing, and maximize your vacation rental profits.
Explore Advanced MetricsCape Coral Short-Term Rental Market Composition (2026): Property & Room Types
Room Type Distribution
Property Type Distribution
Market Composition Insights for Cape Coral
- The Cape Coral Airbnb market composition is heavily skewed towards Entire Home/Apt listings, which make up 97% of the 3,935 active rentals. This indicates strong guest preference for privacy and space.
- Looking at the property type distribution in Cape Coral, House properties are the most common (94.4%), reflecting the local real estate landscape.
- Houses represent a significant 94.4% portion, catering likely to families or larger groups.
- Smaller segments like apartment/condo, hotel/boutique, others, outdoor/unique (combined 5.5%) offer potential for unique stay experiences.
Cape Coral Airbnb Room Capacity Analysis (2026): Bedroom Distribution
Distribution of Listings by Number of Bedrooms
Room Capacity Insights for Cape Coral
- The dominant room capacity in Cape Coral is 3 bedrooms listings, making up 52% of the market. This suggests a strong demand for properties suitable for families or small groups.
- Together, 3 bedrooms and 4 bedrooms properties represent 82.7% of the active Airbnb listings in Cape Coral, indicating a high concentration in these sizes.
- A significant 88.0% of listings offer 3+ bedrooms, catering to larger groups and families seeking more space in Cape Coral.
Cape Coral Vacation Rental Guest Capacity Trends (2026)
Distribution of Listings by Guest Capacity
Guest Capacity Insights for Cape Coral
- The most common guest capacity trend in Cape Coral vacation rentals is listings accommodating 8+ guests (50.7%). This suggests the primary traveler segment is likely larger groups.
- Properties designed for 8+ guests and 6 guests dominate the Cape Coral STR market, accounting for 84.4% of listings.
- 88.5% of properties accommodate 6+ guests, serving the market segment for larger families or group travel in Cape Coral.
- On average, properties in Cape Coral are equipped to host 6.7 guests.
Cape Coral Airbnb Booking Patterns (2026): Available vs. Booked Days
Available Days Distribution
Booked Days Distribution
Booking Pattern Insights for Cape Coral
- The most common availability pattern in Cape Coral falls within the 271-366 days range, representing 55.9% of listings. This suggests many properties have significant open periods on their calendars.
- Approximately 86.5% of listings show high availability (181+ days open annually), indicating potential for increased bookings or specific owner usage patterns.
- For booked days, the 31-90 days range is most frequent in Cape Coral (35.7%), reflecting common guest stay durations or potential owner blocking patterns.
- A notable 14.3% of properties secure long booking periods (181+ days booked per year), highlighting successful long-term rental strategies or significant owner usage.
Cape Coral Airbnb Minimum Stay Requirements Analysis
Distribution of Listings by Minimum Night Requirement
1 Night
181 listings
4.6% of total
2 Nights
279 listings
7.1% of total
3 Nights
355 listings
9% of total
4-6 Nights
1646 listings
41.9% of total
7-29 Nights
371 listings
9.4% of total
30+ Nights
1100 listings
28% of total
Key Insights
- The most prevalent minimum stay requirement in Cape Coral is 4-6 Nights, adopted by 41.9% of listings. This highlights the market's preference for longer commitments.
- Very short stays (1-2 nights) are less common (11.7%), suggesting hosts prefer slightly longer bookings to optimize turnover.
- A significant segment (28%) caters to monthly stays (30+ nights) in Cape Coral, pointing to opportunities in the extended-stay market.
Recommendations
- Align with the market by considering a 4-6 Nights minimum stay, as 41.9% of Cape Coral hosts use this setting.
- If feasible, allowing 1-night stays, especially midweek or during low season, could capture last-minute bookings, as only 4.6% currently do.
- Explore offering discounts for stays of 30+ nights to attract the 28% of the market seeking extended stays.
- Adjust minimum nights based on seasonality – potentially shorter during low season and longer during peak demand periods in Cape Coral.
Cape Coral Airbnb Cancellation Policy Trends Analysis (2026)
Limited
90 listings
2.3% of total
Super Strict 60 Days
514 listings
13.1% of total
Super Strict 30 Days
304 listings
7.8% of total
Flexible
478 listings
12.2% of total
Moderate
518 listings
13.2% of total
Firm
1364 listings
34.8% of total
Strict
646 listings
16.5% of total
Cancellation Policy Insights for Cape Coral
- The prevailing Airbnb cancellation policy trend in Cape Coral is Firm, used by 34.8% of listings.
- A majority (51.3%) of hosts in Cape Coral utilize Firm or Strict policies, indicating a market where hosts prioritize booking security.
Recommendations for Hosts
- Consider adopting a Firm policy to align with the 34.8% market standard in Cape Coral.
- Regularly review your cancellation policy against competitors and market demand shifts in Cape Coral.
Cape Coral STR Booking Lead Time Analysis (2026)
Average Booking Lead Time by Month
Booking Lead Time Insights for Cape Coral
- The overall average booking lead time for vacation rentals in Cape Coral is 72 days.
- Guests book furthest in advance for stays during January (average 102 days), likely coinciding with peak travel demand or local events.
- The shortest booking windows occur for stays in September (average 44 days), indicating more last-minute travel plans during this time.
- Seasonally, Winter (95 days avg.) sees the longest lead times, while Summer (48 days avg.) has the shortest, reflecting typical travel planning cycles.
Recommendations for Hosts
- Use the overall average lead time (72 days) as a baseline for your pricing and availability strategy in Cape Coral.
- For January stays, consider implementing length-of-stay discounts or slightly higher rates for bookings made less than 102 days out to capitalize on advance planning.
- Target marketing efforts for the Winter season well in advance (at least 95 days) to capture early planners.
- Monitor your own booking lead times against these Cape Coral averages to identify opportunities for dynamic pricing adjustments.
Popular & Essential Airbnb Amenities in Cape Coral (2026)
Amenity Prevalence
Amenity Insights for Cape Coral
- Essential amenities in Cape Coral that guests expect include: Air conditioning, Wifi, TV, Kitchen, Free parking on premises, Smoke alarm, Washer. Lacking these (any) could significantly impact bookings.
- Popular amenities like Coffee maker, Refrigerator, Dryer are common but not universal. Offering these can provide a competitive edge.
Recommendations for Hosts
- Ensure your listing includes all essential amenities for Cape Coral: Air conditioning, Wifi, TV, Kitchen, Free parking on premises, Smoke alarm, Washer.
- Prioritize adding missing essentials: Air conditioning, Wifi, TV, Kitchen, Free parking on premises, Smoke alarm, Washer.
- Consider adding popular differentiators like Coffee maker or Refrigerator to increase appeal.
- Highlight unique or less common amenities you offer (e.g., hot tub, dedicated workspace, EV charger) in your listing description and photos.
- Regularly check competitor amenities in Cape Coral to stay competitive.
Cape Coral Airbnb Guest Demographics & Profile Analysis (2026)
Guest Profile Summary for Cape Coral
- The typical guest profile for Airbnb in Cape Coral consists of primarily domestic travelers (90%), often arriving from nearby Miami, typically belonging to the Post-2000s (Gen Z/Alpha) group (50%), primarily speaking English or Spanish.
- Domestic travelers account for 89.9% of guests.
- Key international markets include United States (89.9%) and Canada (2.6%).
- Top languages spoken are English (65.4%) followed by Spanish (18.9%).
- A significant demographic segment is the Post-2000s (Gen Z/Alpha) group, representing 50% of guests.
Recommendations for Hosts
- Target domestic marketing efforts towards travelers from Miami and New York.
- Tailor amenities and listing descriptions to appeal to the dominant Post-2000s (Gen Z/Alpha) demographic (e.g., highlight fast WiFi, smart home features, local guides).
- Highlight unique local experiences or amenities relevant to the primary guest profile.
- Consider seasonal promotions aligned with peak travel times for key origin markets.
Nearby Short-Term Rental Market Comparison
How does the Cape Coral Airbnb market stack up against its neighbors? Compare key performance metrics like average monthly revenue, ADR, and occupancy rates in surrounding areas to understand the broader regional STR landscape.
| Market | Active Properties | Monthly Revenue | Daily Rate | Avg. Occupancy |
|---|---|---|---|---|
| Sailfish Point | 19 | $16,709 | $1587.63 | 48% |
| Bal Harbour Village | 37 | $8,846 | $850.63 | 34% |
| Anna Maria island | 587 | $7,996 | $823.96 | 41% |
| Lake Clarke Shores | 26 | $6,710 | $516.52 | 46% |
| Anna Maria | 56 | $6,434 | $692.96 | 52% |
| Lighthouse Point | 75 | $6,205 | $472.94 | 51% |
| Boca Grande | 31 | $6,128 | $787.07 | 37% |
| Pinecrest | 11 | $6,117 | $861.24 | 43% |
| North Bay Village | 120 | $6,032 | $561.12 | 44% |
| Indian Rocks Beach | 842 | $5,560 | $419.63 | 49% |