Campbell Airbnb Market Analysis 2026: Short Term Rental Data & Vacation Rental Statistics in Florida, United States
Is Airbnb profitable in Campbell in 2026? Explore comprehensive Airbnb analytics for Campbell, Florida, United States to uncover income potential. This 2026 STR market report for Campbell, based on AirROI data from February 2025 to January 2026, reveals key trends in the niche market of 22 active listings.
Whether you're considering an Airbnb investment in Campbell, optimizing your existing vacation rental, or exploring rental arbitrage opportunities, understanding the Campbell Airbnb data is crucial. Leveraging the low regulation environment is key to maximizing your short term rental income potential. Let's dive into the specifics.
Key Campbell Airbnb Performance Metrics Overview
Monthly Airbnb Revenue Variations & Income Potential in Campbell (2026)
Understanding the monthly revenue variations for Airbnb listings in Campbell is key to maximizing your short term rental income potential. Seasonality significantly impacts earnings. Our analysis, based on data from the past 12 months, shows that the peak revenue month for STRs in Campbell is typically April, while September often presents the lowest earnings, highlighting opportunities for strategic pricing adjustments during shoulder and low seasons. Explore the typical Airbnb income in Campbell across different performance tiers:
- Best-in-class properties (Top 10%) achieve $8,534+ monthly, often utilizing dynamic pricing and superior guest experiences.
- Strong performing properties (Top 25%) earn $5,868 or more, indicating effective management and desirable locations/amenities.
- Typical properties (Median) generate around $3,981 per month, representing the average market performance.
- Entry-level properties (Bottom 25%) see earnings around $2,347, often with potential for optimization.
Average Monthly Airbnb Earnings Trend in Campbell
Campbell Airbnb Occupancy Rate Trends (2026)
Maximize your bookings by understanding the Campbell STR occupancy trends. Seasonal demand shifts significantly influence how often properties are booked. Typically, Marchsees the highest demand (peak season occupancy), while September experiences the lowest (low season). Effective strategies, like adjusting minimum stays or offering promotions, can boost occupancy during slower periods. Here's how different property tiers perform in Campbell:
- Best-in-class properties (Top 10%) achieve 85%+ occupancy, indicating high desirability and potentially optimized availability.
- Strong performing properties (Top 25%) maintain 70% or higher occupancy, suggesting good market fit and guest satisfaction.
- Typical properties (Median) have an occupancy rate around 49%.
- Entry-level properties (Bottom 25%) average 30% occupancy, potentially facing higher vacancy.
Average Monthly Occupancy Rate Trend in Campbell
Average Daily Rate (ADR) Airbnb Trends in Campbell (2026)
Effective short term rental pricing strategy in Campbell involves understanding monthly ADR fluctuations. The Average Daily Rate (ADR) for Airbnb in Campbell typically peaks in December and dips lowest during May. Leveraging Airbnb dynamic pricing tools or strategies based on this seasonality can significantly boost revenue. Here's a look at the typical nightly rates achieved:
- Best-in-class properties (Top 10%) command rates of $584+ per night, often due to premium features or locations.
- Strong performing properties (Top 25%) achieve nightly rates of $448 or more.
- Typical properties (Median) charge around $290 per night.
- Entry-level properties (Bottom 25%) earn around $200 per night.
Average Daily Rate (ADR) Trend by Month in Campbell
Get Live Campbell Market Intelligence 👇

Explore Real-time Analytics
Airbnb Seasonality Analysis & Trends in Campbell (2026)
Peak Season (April, June, November)
- Revenue averages $6,118 per month
- Occupancy rates average 54.2%
- Daily rates average $367
Shoulder Season
- Revenue averages $4,690 per month
- Occupancy maintains around 54.1%
- Daily rates hold near $352
Low Season (May, September, October)
- Revenue drops to average $3,225 per month
- Occupancy decreases to average 40.9%
- Daily rates adjust to average $305
Seasonality Insights for Campbell
- The Airbnb seasonality in Campbell shows highly seasonal trends requiring careful strategy. While the sections above show seasonal averages, it's also insightful to look at the extremes:
- During the high season, the absolute peak month showcases Campbell's highest earning potential, with monthly revenues capable of climbing to $6,671, occupancy reaching a high of 66.8%, and ADRs peaking at $468.
- Conversely, the slowest single month of the year, typically falling within the low season, marks the market's lowest point. In this month, revenue might dip to $2,393, occupancy could drop to 35.1%, and ADRs may adjust down to $271.
- Understanding both the seasonal averages and these monthly peaks and troughs in revenue, occupancy, and ADR is crucial for maximizing your Airbnb profit potential in Campbell.
Seasonal Strategies for Maximizing Profit
- Peak Season: Maximize revenue through premium pricing and potentially longer minimum stays. Ensure high availability.
- Low Season: Offer competitive pricing, special promotions (e.g., extended stay discounts), and flexible cancellation policies. Target off-season travelers like remote workers or budget-conscious guests.
- Shoulder Seasons: Implement dynamic pricing that balances peak and low rates. Target weekend travelers or specific events. Offer slightly more flexible terms than peak season.
- Regularly analyze your own performance against these Campbell seasonality benchmarks and adjust your pricing and availability strategy accordingly.
Best Areas for Airbnb Investment in Campbell (2026)
Exploring the top neighborhoods for short-term rentals in Campbell? This section highlights key areas, outlining why they are attractive for hosts and guests, along with notable local attractions. Consider these locations based on your target guest profile and investment strategy.
| Neighborhood / Area | Why Host Here? (Target Guests & Appeal) | Key Attractions & Landmarks |
|---|---|---|
| Downtown Campbell | The heart of Campbell, offering a mix of local restaurants, cafes, and unique shops. It's a vibrant area with a strong community feel, attracting both tourists and locals. | Campbell Park, The Pruneyard Shopping Center, Downtown Campbell Farmer's Market, The Campbell Historical Museum, Los Gatos Creek Trail |
| Campbell's Historic District | A charming area known for its historic homes and tree-lined streets, ideal for visitors seeking a more relaxed, residential vibe while still close to downtown amenities. | The Campbell Historical Museum, Campbell Community Center, Local Art Galleries, Coyote Creek Trail |
| Hiking Trails near Campbell | Beautiful natural landscapes and hiking opportunities close to Campbell, attracting outdoor enthusiasts and families looking for nature experiences. | Los Gatos Creek Trail, Vasona Lake County Park, Saratoga Gap, Castle Rock State Park, Almaden Quicksilver County Park |
| San Tomas Aquino Creek Trail | A scenic and serene area perfect for families and fitness enthusiasts, walking and biking paths lead to various parks and local attractions. | San Tomas Aquino Creek Trail, Open Space Preserves, Local Parks |
| Campbell Village | An upscale area with boutique shopping, dining, and nightlife options, catering to those looking for a vibrant community experience. | Local Shops, Bistros and Restaurants, Microbreweries, Night Market Events |
| Nearby Los Gatos | A neighboring town with a charming downtown area and a suburban feel, appealing for visitors looking for a quaint stay with access to both nature and local culture. | Downtown Los Gatos, Vasona Lake, Los Gatos Theatre, Local Wine Tasting Rooms |
| Tech & Business Hub | Close to the tech centers of Silicon Valley, attracting business travelers and those seeking short-term accommodation for corporate events. | Local Corporate Offices, Silicon Valley Attractions, Business Centers |
| Parks and Recreation | Campbell has numerous parks and family-friendly recreation areas that are great for guests traveling with children or looking for outdoor activities. | Campbell Park, Los Gatos Creek Trail Parks, Playgrounds, Sports Facilities |
Understanding Airbnb License Requirements & STR Laws in Campbell (2026)
While Campbell, Florida, United States currently shows low STR regulations, specific Airbnb license requirements might still exist or change. Always verify the latest short term rental regulations and Airbnb license requirements directly with local government authorities for Campbell to ensure full compliance before hosting.
(Source: AirROI data, 2026, finding no licensed listings among those analyzed)
Top Performing Airbnb Properties in Campbell (2026)
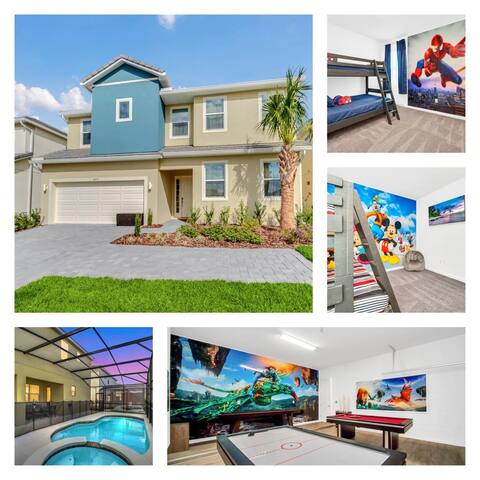
Benchmark your potential! Explore examples of top-performing Airbnb properties in Campbellbased on Trailing Twelve Month (TTM) revenue. Analyze their characteristics, revenue, occupancy rate, and ADR to understand what drives success in this market.
15BR 17BA Luxury/Pool BBQ/Game (2391)
Entire Place • 15 bedrooms
Stylish 12Bd / 11.5 b/ 25 People
Entire Place • 12 bedrooms
Dreamy 5 Bed w/ Game Room, Pool & Themed Bedrooms!
Entire Place • 5 bedrooms

Elegant Brand New 5 BD Villa/Games Room/Pool
Entire Place • 5 bedrooms

Stunning 6BR Lakeview @Storey Lake | Disney - 2929
Entire Place • 6 bedrooms
Happy Villa 12BR 11.5BA Pool BBQ 25
Entire Place • 12 bedrooms
Note: Performance varies based on location, size, amenities, seasonality, and management quality. Data reflects the past 12 months.
Top Performing Airbnb Hosts in Campbell (2026)
Learn from the best! This table showcases top-performing Airbnb hosts in Campbell based on the number of properties managed and estimated total revenue over the past year. Analyze their scale and performance metrics.
| Host Name | Properties | Grossing Revenue | Stay Reviews | Avg Rating |
|---|---|---|---|---|
| Jack | 4 | $195,276 | 43 | 4.50/5.0 |
| Javier | 1 | $104,749 | 37 | 4.92/5.0 |
| Rangel | 1 | $85,054 | 88 | 4.80/5.0 |
| Luis | 1 | $69,888 | 45 | 4.69/5.0 |
| Frank @ Singular Vacations | 1 | $66,851 | 256 | 4.91/5.0 |
| Tiffany | 2 | $63,809 | 427 | 4.87/5.0 |
| Jerry | 1 | $61,800 | 9 | 5.00/5.0 |
| Steven | 1 | $57,599 | 20 | 4.90/5.0 |
| Rodrigo (Master Vacation Home | 1 | $56,757 | 9 | 4.67/5.0 |
| Luis | 1 | $51,336 | 36 | 4.75/5.0 |
Analyzing the strategies of top hosts, such as their property selection, pricing, and guest communication, can offer valuable lessons for optimizing your own Airbnb operations in Campbell.
Dive Deeper: Advanced Campbell STR Market Data (2026)
Ready to unlock more insights? AirROI provides access to advanced metrics and comprehensive Airbnb data for Campbell. Explore detailed analytics beyond this report to refine your investment strategy, optimize pricing, and maximize your vacation rental profits.
Explore Advanced MetricsCampbell Short-Term Rental Market Composition (2026): Property & Room Types
Room Type Distribution
Property Type Distribution
Market Composition Insights for Campbell
- The Campbell Airbnb market composition is heavily skewed towards Entire Home/Apt listings, which make up 95.5% of the 22 active rentals. This indicates strong guest preference for privacy and space.
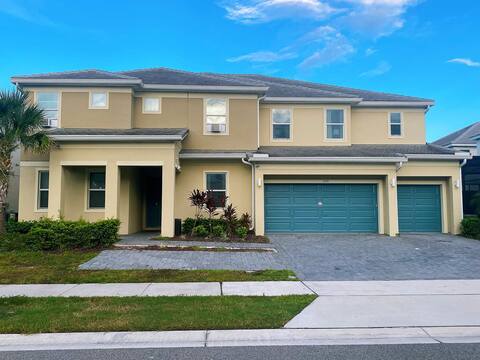
- Looking at the property type distribution in Campbell, House properties are the most common (90.9%), reflecting the local real estate landscape.
- Houses represent a significant 90.9% portion, catering likely to families or larger groups.
Campbell Airbnb Room Capacity Analysis (2026): Bedroom Distribution
Distribution of Listings by Number of Bedrooms
Room Capacity Insights for Campbell
- The dominant room capacity in Campbell is 5+ bedrooms listings, making up 63.6% of the market. This suggests a strong demand for properties suitable for families or small groups.
- Together, 5+ bedrooms and 3 bedrooms properties represent 90.9% of the active Airbnb listings in Campbell, indicating a high concentration in these sizes.
- A significant 95.4% of listings offer 3+ bedrooms, catering to larger groups and families seeking more space in Campbell.
Campbell Vacation Rental Guest Capacity Trends (2026)
Distribution of Listings by Guest Capacity
Guest Capacity Insights for Campbell
- The most common guest capacity trend in Campbell vacation rentals is listings accommodating 8+ guests (72.7%). This suggests the primary traveler segment is likely larger groups.
- Properties designed for 8+ guests and 6 guests dominate the Campbell STR market, accounting for 90.9% of listings.
- 95.4% of properties accommodate 6+ guests, serving the market segment for larger families or group travel in Campbell.
- On average, properties in Campbell are equipped to host 7.4 guests.
Campbell Airbnb Booking Patterns (2026): Available vs. Booked Days
Available Days Distribution
Booked Days Distribution
Booking Pattern Insights for Campbell
- The most common availability pattern in Campbell falls within the 181-270 days range, representing 54.5% of listings. This suggests many properties have significant open periods on their calendars.
- Approximately 68.1% of listings show high availability (181+ days open annually), indicating potential for increased bookings or specific owner usage patterns.
- For booked days, the 91-180 days range is most frequent in Campbell (50%), reflecting common guest stay durations or potential owner blocking patterns.
- A notable 36.4% of properties secure long booking periods (181+ days booked per year), highlighting successful long-term rental strategies or significant owner usage.
Campbell Airbnb Minimum Stay Requirements Analysis
Distribution of Listings by Minimum Night Requirement
1 Night
2 listings
9.1% of total
2 Nights
4 listings
18.2% of total
3 Nights
3 listings
13.6% of total
4-6 Nights
4 listings
18.2% of total
30+ Nights
9 listings
40.9% of total
Key Insights
- The most prevalent minimum stay requirement in Campbell is 30+ Nights, adopted by 40.9% of listings. This highlights the market's preference for longer commitments.
- A significant segment (40.9%) caters to monthly stays (30+ nights) in Campbell, pointing to opportunities in the extended-stay market.
Recommendations
- Align with the market by considering a 30+ Nights minimum stay, as 40.9% of Campbell hosts use this setting.
- If feasible, allowing 1-night stays, especially midweek or during low season, could capture last-minute bookings, as only 9.1% currently do.
- Explore offering discounts for stays of 30+ nights to attract the 40.9% of the market seeking extended stays.
- Adjust minimum nights based on seasonality – potentially shorter during low season and longer during peak demand periods in Campbell.
Campbell Airbnb Cancellation Policy Trends Analysis (2026)
Limited
1 listings
4.5% of total
Flexible
3 listings
13.6% of total
Moderate
4 listings
18.2% of total
Firm
9 listings
40.9% of total
Strict
5 listings
22.7% of total
Cancellation Policy Insights for Campbell
- The prevailing Airbnb cancellation policy trend in Campbell is Firm, used by 40.9% of listings.
- A majority (63.6%) of hosts in Campbell utilize Firm or Strict policies, indicating a market where hosts prioritize booking security.
Recommendations for Hosts
- Consider adopting a Firm policy to align with the 40.9% market standard in Campbell.
- Regularly review your cancellation policy against competitors and market demand shifts in Campbell.
Campbell STR Booking Lead Time Analysis (2026)
Average Booking Lead Time by Month
Booking Lead Time Insights for Campbell
- The overall average booking lead time for vacation rentals in Campbell is 68 days.
- Guests book furthest in advance for stays during July (average 99 days), likely coinciding with peak travel demand or local events.
- The shortest booking windows occur for stays in April (average 58 days), indicating more last-minute travel plans during this time.
- Seasonally, Summer (88 days avg.) sees the longest lead times, while Fall (64 days avg.) has the shortest, reflecting typical travel planning cycles.
Recommendations for Hosts
- Use the overall average lead time (68 days) as a baseline for your pricing and availability strategy in Campbell.
- For July stays, consider implementing length-of-stay discounts or slightly higher rates for bookings made less than 99 days out to capitalize on advance planning.
- Target marketing efforts for the Summer season well in advance (at least 88 days) to capture early planners.
- Monitor your own booking lead times against these Campbell averages to identify opportunities for dynamic pricing adjustments.
Popular & Essential Airbnb Amenities in Campbell (2026)
Amenity Prevalence
Amenity Insights for Campbell
- Essential amenities in Campbell that guests expect include: Free parking on premises, Air conditioning, Wifi, Smoke alarm, TV, Dryer, Hot water. Lacking these (any) could significantly impact bookings.
- Popular amenities like Refrigerator, Microwave, Cooking basics are common but not universal. Offering these can provide a competitive edge.
Recommendations for Hosts
- Ensure your listing includes all essential amenities for Campbell: Free parking on premises, Air conditioning, Wifi, Smoke alarm, TV, Dryer, Hot water.
- Prioritize adding missing essentials: Dryer, Hot water.
- Consider adding popular differentiators like Refrigerator or Microwave to increase appeal.
- Highlight unique or less common amenities you offer (e.g., hot tub, dedicated workspace, EV charger) in your listing description and photos.
- Regularly check competitor amenities in Campbell to stay competitive.
Campbell Airbnb Guest Demographics & Profile Analysis (2026)
Guest Profile Summary for Campbell
- The typical guest profile for Airbnb in Campbell consists of primarily domestic travelers (84%), often arriving from nearby Miami, typically belonging to the Post-2000s (Gen Z/Alpha) group (50%), primarily speaking English or Spanish.
- Domestic travelers account for 83.7% of guests.
- Key international markets include United States (83.7%) and Canada (4.3%).
- Top languages spoken are English (73.3%) followed by Spanish (20%).
- A significant demographic segment is the Post-2000s (Gen Z/Alpha) group, representing 50% of guests.
Recommendations for Hosts
- Target domestic marketing efforts towards travelers from Miami and São Paulo.
- Tailor amenities and listing descriptions to appeal to the dominant Post-2000s (Gen Z/Alpha) demographic (e.g., highlight fast WiFi, smart home features, local guides).
- Highlight unique local experiences or amenities relevant to the primary guest profile.
- Consider seasonal promotions aligned with peak travel times for key origin markets.
Nearby Short-Term Rental Market Comparison
How does the Campbell Airbnb market stack up against its neighbors? Compare key performance metrics like average monthly revenue, ADR, and occupancy rates in surrounding areas to understand the broader regional STR landscape.
| Market | Active Properties | Monthly Revenue | Daily Rate | Avg. Occupancy |
|---|---|---|---|---|
| Sailfish Point | 19 | $16,709 | $1587.63 | 48% |
| Anna Maria island | 587 | $7,996 | $823.96 | 41% |
| Anna Maria | 56 | $6,434 | $692.96 | 52% |
| Reunion | 12 | $6,321 | $580.45 | 44% |
| Vilano Beach | 173 | $5,571 | $442.95 | 45% |
| Indian Rocks Beach | 842 | $5,560 | $419.63 | 49% |
| Melbourne Beach | 275 | $5,384 | $488.83 | 43% |
| Siesta Key | 1,175 | $5,206 | $518.91 | 42% |
| Belleair Beach | 94 | $5,086 | $339.65 | 53% |
| Bradenton Beach | 122 | $4,977 | $507.12 | 42% |