Buenaventura Lakes Airbnb Market Analysis 2026: Short Term Rental Data & Vacation Rental Statistics in Florida, United States
Is Airbnb profitable in Buenaventura Lakes in 2026? Explore comprehensive Airbnb analytics for Buenaventura Lakes, Florida, United States to uncover income potential. This 2026 STR market report for Buenaventura Lakes, based on AirROI data from February 2025 to January 2026, reveals key trends in the niche market of 143 active listings.
Whether you're considering an Airbnb investment in Buenaventura Lakes, optimizing your existing vacation rental, or exploring rental arbitrage opportunities, understanding the Buenaventura Lakes Airbnb data is crucial. Leveraging the low regulation environment is key to maximizing your short term rental income potential. Let's dive into the specifics.
Key Buenaventura Lakes Airbnb Performance Metrics Overview
Monthly Airbnb Revenue Variations & Income Potential in Buenaventura Lakes (2026)
Understanding the monthly revenue variations for Airbnb listings in Buenaventura Lakes is key to maximizing your short term rental income potential. Seasonality significantly impacts earnings. Our analysis, based on data from the past 12 months, shows that the peak revenue month for STRs in Buenaventura Lakes is typically July, while September often presents the lowest earnings, highlighting opportunities for strategic pricing adjustments during shoulder and low seasons. Explore the typical Airbnb income in Buenaventura Lakes across different performance tiers:
- Best-in-class properties (Top 10%) achieve $5,202+ monthly, often utilizing dynamic pricing and superior guest experiences.
- Strong performing properties (Top 25%) earn $3,977 or more, indicating effective management and desirable locations/amenities.
- Typical properties (Median) generate around $2,594 per month, representing the average market performance.
- Entry-level properties (Bottom 25%) see earnings around $1,148, often with potential for optimization.
Average Monthly Airbnb Earnings Trend in Buenaventura Lakes
Buenaventura Lakes Airbnb Occupancy Rate Trends (2026)
Maximize your bookings by understanding the Buenaventura Lakes STR occupancy trends. Seasonal demand shifts significantly influence how often properties are booked. Typically, Marchsees the highest demand (peak season occupancy), while September experiences the lowest (low season). Effective strategies, like adjusting minimum stays or offering promotions, can boost occupancy during slower periods. Here's how different property tiers perform in Buenaventura Lakes:
- Best-in-class properties (Top 10%) achieve 85%+ occupancy, indicating high desirability and potentially optimized availability.
- Strong performing properties (Top 25%) maintain 75% or higher occupancy, suggesting good market fit and guest satisfaction.
- Typical properties (Median) have an occupancy rate around 57%.
- Entry-level properties (Bottom 25%) average 32% occupancy, potentially facing higher vacancy.
Average Monthly Occupancy Rate Trend in Buenaventura Lakes
Average Daily Rate (ADR) Airbnb Trends in Buenaventura Lakes (2026)
Effective short term rental pricing strategy in Buenaventura Lakes involves understanding monthly ADR fluctuations. The Average Daily Rate (ADR) for Airbnb in Buenaventura Lakes typically peaks in December and dips lowest during February. Leveraging Airbnb dynamic pricing tools or strategies based on this seasonality can significantly boost revenue. Here's a look at the typical nightly rates achieved:
- Best-in-class properties (Top 10%) command rates of $245+ per night, often due to premium features or locations.
- Strong performing properties (Top 25%) achieve nightly rates of $192 or more.
- Typical properties (Median) charge around $126 per night.
- Entry-level properties (Bottom 25%) earn around $67 per night.
Average Daily Rate (ADR) Trend by Month in Buenaventura Lakes
Get Live Buenaventura Lakes Market Intelligence 👇

Explore Real-time Analytics
Airbnb Seasonality Analysis & Trends in Buenaventura Lakes (2026)
Peak Season (July, March, December)
- Revenue averages $3,176 per month
- Occupancy rates average 59.2%
- Daily rates average $141
Shoulder Season
- Revenue averages $2,774 per month
- Occupancy maintains around 54.3%
- Daily rates hold near $139
Low Season (April, May, September)
- Revenue drops to average $2,271 per month
- Occupancy decreases to average 47.9%
- Daily rates adjust to average $131
Seasonality Insights for Buenaventura Lakes
- The Airbnb seasonality in Buenaventura Lakes shows moderate seasonality with distinct peak and low periods. While the sections above show seasonal averages, it's also insightful to look at the extremes:
- During the high season, the absolute peak month showcases Buenaventura Lakes's highest earning potential, with monthly revenues capable of climbing to $3,469, occupancy reaching a high of 65.6%, and ADRs peaking at $157.
- Conversely, the slowest single month of the year, typically falling within the low season, marks the market's lowest point. In this month, revenue might dip to $2,010, occupancy could drop to 39.7%, and ADRs may adjust down to $124.
- Understanding both the seasonal averages and these monthly peaks and troughs in revenue, occupancy, and ADR is crucial for maximizing your Airbnb profit potential in Buenaventura Lakes.
Seasonal Strategies for Maximizing Profit
- Peak Season: Maximize revenue through premium pricing and potentially longer minimum stays. Ensure high availability.
- Low Season: Offer competitive pricing, special promotions (e.g., extended stay discounts), and flexible cancellation policies. Target off-season travelers like remote workers or budget-conscious guests.
- Shoulder Seasons: Implement dynamic pricing that balances peak and low rates. Target weekend travelers or specific events. Offer slightly more flexible terms than peak season.
- Regularly analyze your own performance against these Buenaventura Lakes seasonality benchmarks and adjust your pricing and availability strategy accordingly.
Best Areas for Airbnb Investment in Buenaventura Lakes (2026)
Exploring the top neighborhoods for short-term rentals in Buenaventura Lakes? This section highlights key areas, outlining why they are attractive for hosts and guests, along with notable local attractions. Consider these locations based on your target guest profile and investment strategy.
| Neighborhood / Area | Why Host Here? (Target Guests & Appeal) | Key Attractions & Landmarks |
|---|---|---|
| Buenaventura Lakes Park | A family-friendly neighborhood with abundant parks and outdoor activities, ideal for families visiting the area or enjoying nature. Close to numerous lakes and recreational facilities. | Buenaventura Lakes Park, Orlando Watersports Complex, Lake Nona, Lakeside Park, Greenwood Urban Wetlands |
| Kissimmee Lakefront Park | A picturesque park on the shores of Lake Tohopekaliga, offering scenic views, picnicking, and recreational activities. Great for tourists looking to enjoy natural beauty and local events. | Lake Tohopekaliga, Kissimmee Lakefront Park, Kissimmee River, Whispering Coves Park, Middleton Gardens |
| The Loop | A shopping and entertainment destination with a variety of dining and retail options. Attracts visitors looking for convenience and leisure time close to major highways. | The Loop Shopping Center, Cinemark, Target, Old Town, Orlando Vineland Premium Outlets |
| Lake Nona | A fast-developing community known for its modern amenities and proximity to the Medical City. Ideal for business travelers and families looking for a long-term stay. | Medical City, Lake Nona Discovery Center, Biking and walking trails, Boxi Park, Nona Adventure Park |
| Disney's Animal Kingdom | One of the major theme parks near the area, attracting families, thrill-seekers, and animal lovers. Hosts various attractions that make it a hotspot for visitors to Central Florida. | Expedition Everest, Kilimanjaro Safaris, Avatar Flight of Passage, Festival of the Lion King, TriceraTop Spin |
| Theme Park Corridor | Home to several major attractions including Universal Studios and SeaWorld, ideal for guests looking to experience the theme park excitement Florida offers. | Universal Studios Theme Parks, SeaWorld Orlando, Fun Spot America, Wet 'n Wild Orlando, Orlando International Airport |
| Historic Downtown Kissimmee | Rich in history and local culture, this area allows visitors to experience traditional Florida. Great for those interested in local cuisine and heritage. | Kissimmee Museum, Kissimmee Main Street, Lakefront Park, Historic architecture, Local eateries |
| Orlando International Airport Area | Conveniently located for travelers coming and going, this area is perfect for short stays and business travel. Offers immediate access to transportation and amenities. | Orlando International Airport, Airport Lakes Park, The Florida Mall, Lake Nona, Dining options in the area |
Understanding Airbnb License Requirements & STR Laws in Buenaventura Lakes (2026)
While Buenaventura Lakes, Florida, United States currently shows low STR regulations, specific Airbnb license requirements might still exist or change. Always verify the latest short term rental regulations and Airbnb license requirements directly with local government authorities for Buenaventura Lakes to ensure full compliance before hosting.
(Source: AirROI data, 2026, based on 1% licensed listings)
Top Performing Airbnb Properties in Buenaventura Lakes (2026)
Benchmark your potential! Explore examples of top-performing Airbnb properties in Buenaventura Lakesbased on Trailing Twelve Month (TTM) revenue. Analyze their characteristics, revenue, occupancy rate, and ADR to understand what drives success in this market.
Villa Sol Quite Family Pool/Hot tub Home
Entire Place • 4 bedrooms
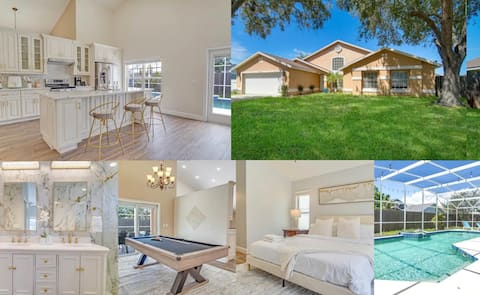
Luxury /Airport-Parks PoolHome
Entire Place • 4 bedrooms
Lake view home near parks & MCO
Entire Place • 6 bedrooms

Luxury 5Bed 3Bath|Private Pool Home|Close to USTA
Entire Place • 5 bedrooms

Four Seasons Home
Entire Place • 2 bedrooms

Cozy Tropical Getaway w/ FREE Heated Pool!
Entire Place • 3 bedrooms
Note: Performance varies based on location, size, amenities, seasonality, and management quality. Data reflects the past 12 months.
Top Performing Airbnb Hosts in Buenaventura Lakes (2026)
Learn from the best! This table showcases top-performing Airbnb hosts in Buenaventura Lakes based on the number of properties managed and estimated total revenue over the past year. Analyze their scale and performance metrics.
| Host Name | Properties | Grossing Revenue | Stay Reviews | Avg Rating |
|---|---|---|---|---|
| Adriel | 5 | $113,259 | 758 | 4.75/5.0 |
| Mike | 2 | $112,914 | 44 | 4.71/5.0 |
| Sandra | 2 | $111,482 | 130 | 4.81/5.0 |
| Fuat | 4 | $92,234 | 576 | 4.75/5.0 |
| Norlan | 2 | $86,274 | 149 | 4.79/5.0 |
| Sarah | 1 | $84,983 | 124 | 5.00/5.0 |
| William | 3 | $80,475 | 378 | 4.85/5.0 |
| Evolve | 3 | $77,219 | 108 | 4.73/5.0 |
| Juan | 1 | $77,023 | 103 | 4.82/5.0 |
| Andrea | 2 | $76,760 | 135 | 4.82/5.0 |
Analyzing the strategies of top hosts, such as their property selection, pricing, and guest communication, can offer valuable lessons for optimizing your own Airbnb operations in Buenaventura Lakes.
Dive Deeper: Advanced Buenaventura Lakes STR Market Data (2026)
Ready to unlock more insights? AirROI provides access to advanced metrics and comprehensive Airbnb data for Buenaventura Lakes. Explore detailed analytics beyond this report to refine your investment strategy, optimize pricing, and maximize your vacation rental profits.
Explore Advanced MetricsBuenaventura Lakes Short-Term Rental Market Composition (2026): Property & Room Types
Room Type Distribution
Property Type Distribution
Market Composition Insights for Buenaventura Lakes
- The Buenaventura Lakes Airbnb market composition is heavily skewed towards Entire Home/Apt listings, which make up 79% of the 143 active rentals. This indicates strong guest preference for privacy and space.
- Looking at the property type distribution in Buenaventura Lakes, House properties are the most common (76.2%), reflecting the local real estate landscape.
- Houses represent a significant 76.2% portion, catering likely to families or larger groups.
- Smaller segments like hotel/boutique, unique stays, outdoor/unique (combined 7.0%) offer potential for unique stay experiences.
Buenaventura Lakes Airbnb Room Capacity Analysis (2026): Bedroom Distribution
Distribution of Listings by Number of Bedrooms
Room Capacity Insights for Buenaventura Lakes
- The dominant room capacity in Buenaventura Lakes is 3 bedrooms listings, making up 24.5% of the market. This suggests a strong demand for properties suitable for families or small groups.
- Together, 3 bedrooms and 1 bedroom properties represent 46.9% of the active Airbnb listings in Buenaventura Lakes, indicating a high concentration in these sizes.
- A significant 49.0% of listings offer 3+ bedrooms, catering to larger groups and families seeking more space in Buenaventura Lakes.
Buenaventura Lakes Vacation Rental Guest Capacity Trends (2026)
Distribution of Listings by Guest Capacity
Guest Capacity Insights for Buenaventura Lakes
- The most common guest capacity trend in Buenaventura Lakes vacation rentals is listings accommodating 8+ guests (37.1%). This suggests the primary traveler segment is likely larger groups.
- Properties designed for 8+ guests and 6 guests dominate the Buenaventura Lakes STR market, accounting for 51.1% of listings.
- 53.2% of properties accommodate 6+ guests, serving the market segment for larger families or group travel in Buenaventura Lakes.
- On average, properties in Buenaventura Lakes are equipped to host 4.8 guests.
Buenaventura Lakes Airbnb Booking Patterns (2026): Available vs. Booked Days
Available Days Distribution
Booked Days Distribution
Booking Pattern Insights for Buenaventura Lakes
- The most common availability pattern in Buenaventura Lakes falls within the 91-180 days range, representing 31.5% of listings. This suggests many properties have significant open periods on their calendars.
- Approximately 58.8% of listings show high availability (181+ days open annually), indicating potential for increased bookings or specific owner usage patterns.
- For booked days, the 91-180 days range is most frequent in Buenaventura Lakes (33.6%), reflecting common guest stay durations or potential owner blocking patterns.
- A notable 42.0% of properties secure long booking periods (181+ days booked per year), highlighting successful long-term rental strategies or significant owner usage.
Buenaventura Lakes Airbnb Minimum Stay Requirements Analysis
Distribution of Listings by Minimum Night Requirement
1 Night
37 listings
25.9% of total
2 Nights
33 listings
23.1% of total
3 Nights
16 listings
11.2% of total
4-6 Nights
10 listings
7% of total
7-29 Nights
3 listings
2.1% of total
30+ Nights
44 listings
30.8% of total
Key Insights
- The most prevalent minimum stay requirement in Buenaventura Lakes is 30+ Nights, adopted by 30.8% of listings. This highlights the market's preference for longer commitments.
- A significant segment (30.8%) caters to monthly stays (30+ nights) in Buenaventura Lakes, pointing to opportunities in the extended-stay market.
Recommendations
- Align with the market by considering a 30+ Nights minimum stay, as 30.8% of Buenaventura Lakes hosts use this setting.
- If feasible, allowing 1-night stays, especially midweek or during low season, could capture last-minute bookings, as only 25.9% currently do.
- Explore offering discounts for stays of 30+ nights to attract the 30.8% of the market seeking extended stays.
- Adjust minimum nights based on seasonality – potentially shorter during low season and longer during peak demand periods in Buenaventura Lakes.
Buenaventura Lakes Airbnb Cancellation Policy Trends Analysis (2026)
Limited
3 listings
2.1% of total
Flexible
29 listings
20.3% of total
Moderate
47 listings
32.9% of total
Firm
45 listings
31.5% of total
Strict
19 listings
13.3% of total
Cancellation Policy Insights for Buenaventura Lakes
- The prevailing Airbnb cancellation policy trend in Buenaventura Lakes is Moderate, used by 32.9% of listings.
- There's a relatively balanced mix between guest-friendly (53.2%) and stricter (44.8%) policies, offering choices for different guest needs.
Recommendations for Hosts
- Consider adopting a Moderate policy to align with the 32.9% market standard in Buenaventura Lakes.
- Using a Strict policy might deter some guests, as only 13.3% of listings use it. Evaluate if potential revenue protection outweighs possible lower booking rates.
- Regularly review your cancellation policy against competitors and market demand shifts in Buenaventura Lakes.
Buenaventura Lakes STR Booking Lead Time Analysis (2026)
Average Booking Lead Time by Month
Booking Lead Time Insights for Buenaventura Lakes
- The overall average booking lead time for vacation rentals in Buenaventura Lakes is 40 days.
- Guests book furthest in advance for stays during December (average 62 days), likely coinciding with peak travel demand or local events.
- The shortest booking windows occur for stays in May (average 28 days), indicating more last-minute travel plans during this time.
- Seasonally, Winter (49 days avg.) sees the longest lead times, while Spring (39 days avg.) has the shortest, reflecting typical travel planning cycles.
Recommendations for Hosts
- Use the overall average lead time (40 days) as a baseline for your pricing and availability strategy in Buenaventura Lakes.
- For December stays, consider implementing length-of-stay discounts or slightly higher rates for bookings made less than 62 days out to capitalize on advance planning.
- Target marketing efforts for the Winter season well in advance (at least 49 days) to capture early planners.
- Monitor your own booking lead times against these Buenaventura Lakes averages to identify opportunities for dynamic pricing adjustments.
Popular & Essential Airbnb Amenities in Buenaventura Lakes (2026)
Amenity Prevalence
Amenity Insights for Buenaventura Lakes
- Essential amenities in Buenaventura Lakes that guests expect include: Air conditioning, Wifi, TV, Free parking on premises. Lacking these (any) could significantly impact bookings.
- Popular amenities like Smoke alarm, Hot water, Microwave are common but not universal. Offering these can provide a competitive edge.
Recommendations for Hosts
- Ensure your listing includes all essential amenities for Buenaventura Lakes: Air conditioning, Wifi, TV, Free parking on premises.
- Prioritize adding missing essentials: TV, Free parking on premises.
- Consider adding popular differentiators like Smoke alarm or Hot water to increase appeal.
- Highlight unique or less common amenities you offer (e.g., hot tub, dedicated workspace, EV charger) in your listing description and photos.
- Regularly check competitor amenities in Buenaventura Lakes to stay competitive.
Buenaventura Lakes Airbnb Guest Demographics & Profile Analysis (2026)
Guest Profile Summary for Buenaventura Lakes
- The typical guest profile for Airbnb in Buenaventura Lakes consists of primarily domestic travelers (84%), often arriving from nearby New York, typically belonging to the Post-2000s (Gen Z/Alpha) group (50%), primarily speaking English or Spanish.
- Domestic travelers account for 83.9% of guests.
- Key international markets include United States (83.9%) and Canada (3%).
- Top languages spoken are English (61.8%) followed by Spanish (23.1%).
- A significant demographic segment is the Post-2000s (Gen Z/Alpha) group, representing 50% of guests.
Recommendations for Hosts
- Target domestic marketing efforts towards travelers from New York and Miami.
- Tailor amenities and listing descriptions to appeal to the dominant Post-2000s (Gen Z/Alpha) demographic (e.g., highlight fast WiFi, smart home features, local guides).
- Highlight unique local experiences or amenities relevant to the primary guest profile.
- Consider seasonal promotions aligned with peak travel times for key origin markets.
Nearby Short-Term Rental Market Comparison
How does the Buenaventura Lakes Airbnb market stack up against its neighbors? Compare key performance metrics like average monthly revenue, ADR, and occupancy rates in surrounding areas to understand the broader regional STR landscape.
| Market | Active Properties | Monthly Revenue | Daily Rate | Avg. Occupancy |
|---|---|---|---|---|
| Sailfish Point | 19 | $16,709 | $1587.63 | 48% |
| Anna Maria island | 587 | $7,996 | $823.96 | 41% |
| Anna Maria | 56 | $6,434 | $692.96 | 52% |
| Reunion | 12 | $6,321 | $580.45 | 44% |
| Vilano Beach | 173 | $5,571 | $442.95 | 45% |
| Indian Rocks Beach | 842 | $5,560 | $419.63 | 49% |
| Melbourne Beach | 275 | $5,384 | $488.83 | 43% |
| Siesta Key | 1,175 | $5,206 | $518.91 | 42% |
| Belleair Beach | 94 | $5,086 | $339.65 | 53% |
| Bradenton Beach | 122 | $4,977 | $507.12 | 42% |