Brooksville Airbnb Market Analysis 2026: Short Term Rental Data & Vacation Rental Statistics in Florida, United States
Is Airbnb profitable in Brooksville in 2026? Explore comprehensive Airbnb analytics for Brooksville, Florida, United States to uncover income potential. This 2026 STR market report for Brooksville, based on AirROI data from February 2025 to January 2026, reveals key trends in the niche market of 101 active listings.
Whether you're considering an Airbnb investment in Brooksville, optimizing your existing vacation rental, or exploring rental arbitrage opportunities, understanding the Brooksville Airbnb data is crucial. Leveraging the low regulation environment is key to maximizing your short term rental income potential. Let's dive into the specifics.
Key Brooksville Airbnb Performance Metrics Overview
Monthly Airbnb Revenue Variations & Income Potential in Brooksville (2026)
Understanding the monthly revenue variations for Airbnb listings in Brooksville is key to maximizing your short term rental income potential. Seasonality significantly impacts earnings. Our analysis, based on data from the past 12 months, shows that the peak revenue month for STRs in Brooksville is typically March, while September often presents the lowest earnings, highlighting opportunities for strategic pricing adjustments during shoulder and low seasons. Explore the typical Airbnb income in Brooksville across different performance tiers:
- Best-in-class properties (Top 10%) achieve $4,061+ monthly, often utilizing dynamic pricing and superior guest experiences.
- Strong performing properties (Top 25%) earn $2,598 or more, indicating effective management and desirable locations/amenities.
- Typical properties (Median) generate around $1,564 per month, representing the average market performance.
- Entry-level properties (Bottom 25%) see earnings around $651, often with potential for optimization.
Average Monthly Airbnb Earnings Trend in Brooksville
Brooksville Airbnb Occupancy Rate Trends (2026)
Maximize your bookings by understanding the Brooksville STR occupancy trends. Seasonal demand shifts significantly influence how often properties are booked. Typically, Februarysees the highest demand (peak season occupancy), while September experiences the lowest (low season). Effective strategies, like adjusting minimum stays or offering promotions, can boost occupancy during slower periods. Here's how different property tiers perform in Brooksville:
- Best-in-class properties (Top 10%) achieve 75%+ occupancy, indicating high desirability and potentially optimized availability.
- Strong performing properties (Top 25%) maintain 57% or higher occupancy, suggesting good market fit and guest satisfaction.
- Typical properties (Median) have an occupancy rate around 39%.
- Entry-level properties (Bottom 25%) average 20% occupancy, potentially facing higher vacancy.
Average Monthly Occupancy Rate Trend in Brooksville
Average Daily Rate (ADR) Airbnb Trends in Brooksville (2026)
Effective short term rental pricing strategy in Brooksville involves understanding monthly ADR fluctuations. The Average Daily Rate (ADR) for Airbnb in Brooksville typically peaks in December and dips lowest during April. Leveraging Airbnb dynamic pricing tools or strategies based on this seasonality can significantly boost revenue. Here's a look at the typical nightly rates achieved:
- Best-in-class properties (Top 10%) command rates of $270+ per night, often due to premium features or locations.
- Strong performing properties (Top 25%) achieve nightly rates of $197 or more.
- Typical properties (Median) charge around $132 per night.
- Entry-level properties (Bottom 25%) earn around $92 per night.
Average Daily Rate (ADR) Trend by Month in Brooksville
Get Live Brooksville Market Intelligence 👇

Explore Real-time Analytics
Airbnb Seasonality Analysis & Trends in Brooksville (2026)
Peak Season (March, February, July)
- Revenue averages $2,487 per month
- Occupancy rates average 52.8%
- Daily rates average $157
Shoulder Season
- Revenue averages $1,866 per month
- Occupancy maintains around 37.0%
- Daily rates hold near $166
Low Season (May, August, September)
- Revenue drops to average $1,570 per month
- Occupancy decreases to average 32.9%
- Daily rates adjust to average $159
Seasonality Insights for Brooksville
- The Airbnb seasonality in Brooksville shows moderate seasonality with distinct peak and low periods. While the sections above show seasonal averages, it's also insightful to look at the extremes:
- During the high season, the absolute peak month showcases Brooksville's highest earning potential, with monthly revenues capable of climbing to $2,611, occupancy reaching a high of 59.9%, and ADRs peaking at $173.
- Conversely, the slowest single month of the year, typically falling within the low season, marks the market's lowest point. In this month, revenue might dip to $1,496, occupancy could drop to 30.0%, and ADRs may adjust down to $149.
- Understanding both the seasonal averages and these monthly peaks and troughs in revenue, occupancy, and ADR is crucial for maximizing your Airbnb profit potential in Brooksville.
Seasonal Strategies for Maximizing Profit
- Peak Season: Maximize revenue through premium pricing and potentially longer minimum stays. Ensure high availability.
- Low Season: Offer competitive pricing, special promotions (e.g., extended stay discounts), and flexible cancellation policies. Target off-season travelers like remote workers or budget-conscious guests.
- Shoulder Seasons: Implement dynamic pricing that balances peak and low rates. Target weekend travelers or specific events. Offer slightly more flexible terms than peak season.
- Regularly analyze your own performance against these Brooksville seasonality benchmarks and adjust your pricing and availability strategy accordingly.
Best Areas for Airbnb Investment in Brooksville (2026)
Exploring the top neighborhoods for short-term rentals in Brooksville? This section highlights key areas, outlining why they are attractive for hosts and guests, along with notable local attractions. Consider these locations based on your target guest profile and investment strategy.
| Neighborhood / Area | Why Host Here? (Target Guests & Appeal) | Key Attractions & Landmarks |
|---|---|---|
| Downtown Brooksville | The historic heart of Brooksville, known for its charming architecture and proximity to local events. Ideal for guests looking to explore the city's history and culture. | Brooksville Main Street, The Hernando Historical Museum, The Withlacoochee State Trail, The Florida Classic Park |
| Brooksville Ridge | A suburban area with spacious homes and access to outdoor activities. Great for families and longer stays, providing a peaceful retreat while still close to amenities. | Nature Coast Botanical Gardens, Pine Island, Brooksville Golf and Country Club, Local parks |
| Kays Landing | A quiet community surrounded by nature, appealing for guests who enjoy hiking and outdoor adventures. Attracts nature lovers and vacationers seeking tranquility. | Croom Wildlife Management Area, Withlacoochee State Forest, Local fishing spots |
| Highlands | This neighborhood offers a mix of residential and commercial spaces, with convenient access to shopping and dining. Attracts both local visitors and commuters. | Shopping plazas, Restaurants, Local events at Hernando County Fairgrounds |
| Spring Hill | Nearby Spring Hill provides additional amenities and is a popular spot for visitors to Brooksville. Ideal for those wanting access to beaches while staying near Brooksville. | Weeki Wachee Springs State Park, Pine Island Beach Park, Local dining and shops |
| Silver Lake | A picturesque area offering scenic views and outdoor activities, perfect for guests looking to relax near water bodies and parks. | Silver Lake Park, Local hiking trails, Fishing areas |
| East Brooksville | A rural neighborhood providing a quiet escape with a distinct agricultural charm, attracting those wanting a taste of Florida's rural life. | Farmer's markets, Local farms, Nature trails |
| Croom Area | Known for beautiful countryside scenery and outdoor recreational opportunities, this area appeals to outdoor enthusiasts and those seeking adventure. | Croom Motorcycle Area, Withlacoochee State Trail, Croom Wildlife Management Area |
Understanding Airbnb License Requirements & STR Laws in Brooksville (2026)
While Brooksville, Florida, United States currently shows low STR regulations, specific Airbnb license requirements might still exist or change. Always verify the latest short term rental regulations and Airbnb license requirements directly with local government authorities for Brooksville to ensure full compliance before hosting.
(Source: AirROI data, 2026, finding no licensed listings among those analyzed)
Top Performing Airbnb Properties in Brooksville (2026)
Benchmark your potential! Explore examples of top-performing Airbnb properties in Brooksvillebased on Trailing Twelve Month (TTM) revenue. Analyze their characteristics, revenue, occupancy rate, and ADR to understand what drives success in this market.
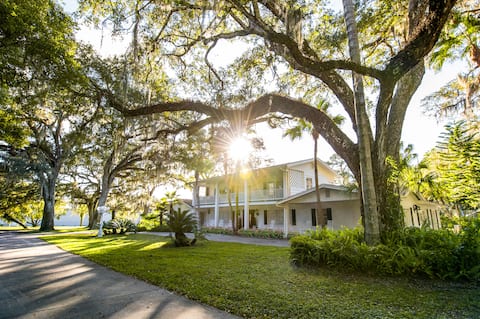
Luxurious 16 Overnight Guests Micro-wedding Venue
Entire Place • 4 bedrooms
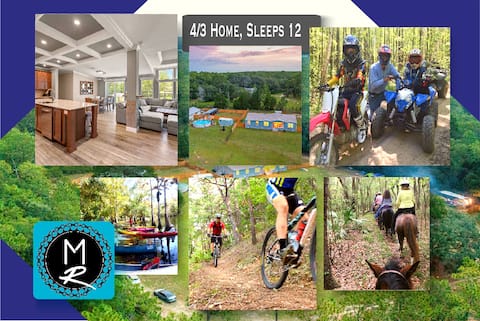
Fuel Your Passion, Epic Moto Ranch Factory Ride
Entire Place • 4 bedrooms
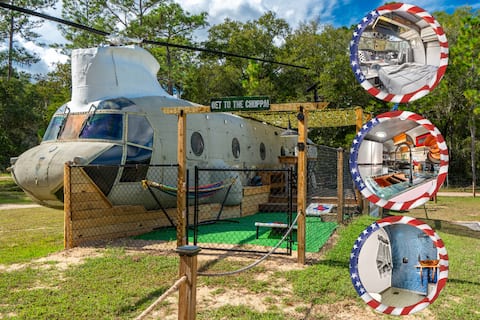
Get to the Choppa! One-of-a-kind 2/1 Helicopter!
Entire Place • 2 bedrooms
Brooksville Home ~ 12 Mi to Cabot Citrus Farms
Entire Place • 5 bedrooms
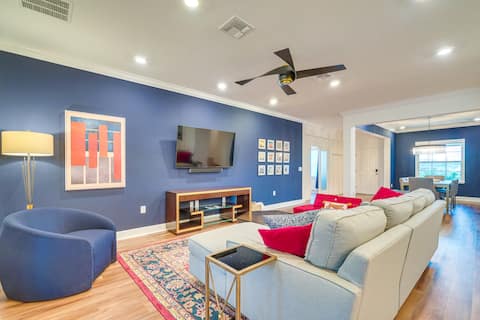
Brooksville Oasis! 3 Bedroom, Heated Pool Home
Entire Place • 3 bedrooms
Saltwater Pool + Fire Pit Nights | Weeki Wachee
Entire Place • 3 bedrooms
Note: Performance varies based on location, size, amenities, seasonality, and management quality. Data reflects the past 12 months.
Top Performing Airbnb Hosts in Brooksville (2026)
Learn from the best! This table showcases top-performing Airbnb hosts in Brooksville based on the number of properties managed and estimated total revenue over the past year. Analyze their scale and performance metrics.
| Host Name | Properties | Grossing Revenue | Stay Reviews | Avg Rating |
|---|---|---|---|---|
| MotoRanch | 7 | $253,262 | 702 | 4.94/5.0 |
| Melanie | 1 | $115,457 | 9 | 5.00/5.0 |
| Evolve | 3 | $82,175 | 76 | 4.87/5.0 |
| Jason | 2 | $78,291 | 80 | 4.92/5.0 |
| Brandy @ Farm Of Dreams Resort | 4 | $68,042 | 29 | 5.00/5.0 |
| Jeff | 2 | $59,536 | 478 | 4.61/5.0 |
| Robert | 3 | $48,726 | 156 | 4.97/5.0 |
| Cheryl | 2 | $42,179 | 442 | 4.96/5.0 |
| Gil | 1 | $40,385 | 16 | 4.75/5.0 |
| Scott | 1 | $39,750 | 35 | 5.00/5.0 |
Analyzing the strategies of top hosts, such as their property selection, pricing, and guest communication, can offer valuable lessons for optimizing your own Airbnb operations in Brooksville.
Dive Deeper: Advanced Brooksville STR Market Data (2026)
Ready to unlock more insights? AirROI provides access to advanced metrics and comprehensive Airbnb data for Brooksville. Explore detailed analytics beyond this report to refine your investment strategy, optimize pricing, and maximize your vacation rental profits.
Explore Advanced MetricsBrooksville Short-Term Rental Market Composition (2026): Property & Room Types
Room Type Distribution
Property Type Distribution
Market Composition Insights for Brooksville
- The Brooksville Airbnb market composition is heavily skewed towards Entire Home/Apt listings, which make up 90.1% of the 101 active rentals. This indicates strong guest preference for privacy and space.
- Looking at the property type distribution in Brooksville, House properties are the most common (55.4%), reflecting the local real estate landscape.
- Houses represent a significant 55.4% portion, catering likely to families or larger groups.
- The presence of 5.9% Hotel/Boutique listings indicates integration with traditional hospitality.
- Smaller segments like apartment/condo, others, unique stays (combined 7.0%) offer potential for unique stay experiences.
Brooksville Airbnb Room Capacity Analysis (2026): Bedroom Distribution
Distribution of Listings by Number of Bedrooms
Room Capacity Insights for Brooksville
- The dominant room capacity in Brooksville is 2 bedrooms listings, making up 25.7% of the market. This suggests a strong demand for properties suitable for couples or solo travelers.
- Together, 2 bedrooms and 1 bedroom properties represent 49.5% of the active Airbnb listings in Brooksville, indicating a high concentration in these sizes.
- A significant 28.8% of listings offer 3+ bedrooms, catering to larger groups and families seeking more space in Brooksville.
Brooksville Vacation Rental Guest Capacity Trends (2026)
Distribution of Listings by Guest Capacity
Guest Capacity Insights for Brooksville
- The most common guest capacity trend in Brooksville vacation rentals is listings accommodating 4 guests (24.8%). This suggests the primary traveler segment is likely small families or groups.
- Properties designed for 4 guests and 6 guests dominate the Brooksville STR market, accounting for 48.6% of listings.
- 44.6% of properties accommodate 6+ guests, serving the market segment for larger families or group travel in Brooksville.
- On average, properties in Brooksville are equipped to host 4.8 guests.
Brooksville Airbnb Booking Patterns (2026): Available vs. Booked Days
Available Days Distribution
Booked Days Distribution
Booking Pattern Insights for Brooksville
- The most common availability pattern in Brooksville falls within the 271-366 days range, representing 46.5% of listings. This suggests many properties have significant open periods on their calendars.
- Approximately 84.1% of listings show high availability (181+ days open annually), indicating potential for increased bookings or specific owner usage patterns.
- For booked days, the 91-180 days range is most frequent in Brooksville (40.6%), reflecting common guest stay durations or potential owner blocking patterns.
- A notable 16.9% of properties secure long booking periods (181+ days booked per year), highlighting successful long-term rental strategies or significant owner usage.
Brooksville Airbnb Minimum Stay Requirements Analysis
Distribution of Listings by Minimum Night Requirement
1 Night
39 listings
38.6% of total
2 Nights
29 listings
28.7% of total
3 Nights
5 listings
5% of total
4-6 Nights
3 listings
3% of total
7-29 Nights
2 listings
2% of total
30+ Nights
23 listings
22.8% of total
Key Insights
- The most prevalent minimum stay requirement in Brooksville is 1 Night, adopted by 38.6% of listings. This highlights the market's preference for shorter, flexible bookings.
- A strong majority (67.3%) of the Brooksville Airbnb data shows acceptance of very short stays (1-2 nights), indicating a dynamic, high-turnover market.
- A significant segment (22.8%) caters to monthly stays (30+ nights) in Brooksville, pointing to opportunities in the extended-stay market.
Recommendations
- Align with the market by considering a 1 Night minimum stay, as 38.6% of Brooksville hosts use this setting.
- Explore offering discounts for stays of 30+ nights to attract the 22.8% of the market seeking extended stays.
- Adjust minimum nights based on seasonality – potentially shorter during low season and longer during peak demand periods in Brooksville.
Brooksville Airbnb Cancellation Policy Trends Analysis (2026)
Limited
2 listings
2% of total
Super Strict 30 Days
1 listings
1% of total
Super Strict 60 Days
1 listings
1% of total
Flexible
21 listings
20.8% of total
Moderate
38 listings
37.6% of total
Firm
27 listings
26.7% of total
Strict
11 listings
10.9% of total
Cancellation Policy Insights for Brooksville
- The prevailing Airbnb cancellation policy trend in Brooksville is Moderate, used by 37.6% of listings.
- There's a relatively balanced mix between guest-friendly (58.4%) and stricter (37.6%) policies, offering choices for different guest needs.
Recommendations for Hosts
- Consider adopting a Moderate policy to align with the 37.6% market standard in Brooksville.
- Using a Strict policy might deter some guests, as only 10.9% of listings use it. Evaluate if potential revenue protection outweighs possible lower booking rates.
- Regularly review your cancellation policy against competitors and market demand shifts in Brooksville.
Brooksville STR Booking Lead Time Analysis (2026)
Average Booking Lead Time by Month
Booking Lead Time Insights for Brooksville
- The overall average booking lead time for vacation rentals in Brooksville is 42 days.
- Guests book furthest in advance for stays during November (average 66 days), likely coinciding with peak travel demand or local events.
- The shortest booking windows occur for stays in May (average 22 days), indicating more last-minute travel plans during this time.
- Seasonally, Winter (57 days avg.) sees the longest lead times, while Summer (30 days avg.) has the shortest, reflecting typical travel planning cycles.
Recommendations for Hosts
- Use the overall average lead time (42 days) as a baseline for your pricing and availability strategy in Brooksville.
- For November stays, consider implementing length-of-stay discounts or slightly higher rates for bookings made less than 66 days out to capitalize on advance planning.
- Target marketing efforts for the Winter season well in advance (at least 57 days) to capture early planners.
- Monitor your own booking lead times against these Brooksville averages to identify opportunities for dynamic pricing adjustments.
Popular & Essential Airbnb Amenities in Brooksville (2026)
Amenity Prevalence
Amenity Insights for Brooksville
- Popular amenities like Free parking on premises, Hot water, Air conditioning are common but not universal. Offering these can provide a competitive edge.
- Warning: Wifi is not universally provided but is considered essential globally. Ensure reliable Wifi is offered.
Recommendations for Hosts
- Consider adding popular differentiators like Free parking on premises or Hot water to increase appeal.
- Highlight unique or less common amenities you offer (e.g., hot tub, dedicated workspace, EV charger) in your listing description and photos.
- Regularly check competitor amenities in Brooksville to stay competitive.
Brooksville Airbnb Guest Demographics & Profile Analysis (2026)
Guest Profile Summary for Brooksville
- The typical guest profile for Airbnb in Brooksville consists of primarily domestic travelers (95%), often arriving from nearby Orlando, typically belonging to the Post-2000s (Gen Z/Alpha) group (50%), primarily speaking English or Spanish.
- Domestic travelers account for 95.2% of guests.
- Key international markets include United States (95.2%) and Canada (1.3%).
- Top languages spoken are English (68.1%) followed by Spanish (18.7%).
- A significant demographic segment is the Post-2000s (Gen Z/Alpha) group, representing 50% of guests.
Recommendations for Hosts
- Target domestic marketing efforts towards travelers from Orlando and Tampa.
- Tailor amenities and listing descriptions to appeal to the dominant Post-2000s (Gen Z/Alpha) demographic (e.g., highlight fast WiFi, smart home features, local guides).
- Highlight unique local experiences or amenities relevant to the primary guest profile.
- Consider seasonal promotions aligned with peak travel times for key origin markets.
Nearby Short-Term Rental Market Comparison
How does the Brooksville Airbnb market stack up against its neighbors? Compare key performance metrics like average monthly revenue, ADR, and occupancy rates in surrounding areas to understand the broader regional STR landscape.
| Market | Active Properties | Monthly Revenue | Daily Rate | Avg. Occupancy |
|---|---|---|---|---|
| Anna Maria island | 587 | $7,996 | $823.96 | 41% |
| Anna Maria | 56 | $6,434 | $692.96 | 52% |
| Reunion | 12 | $6,321 | $580.45 | 44% |
| Vilano Beach | 173 | $5,571 | $442.95 | 45% |
| Indian Rocks Beach | 842 | $5,560 | $419.63 | 49% |
| Siesta Key | 1,175 | $5,206 | $518.91 | 42% |
| Belleair Beach | 94 | $5,086 | $339.65 | 53% |
| Bradenton Beach | 122 | $4,977 | $507.12 | 42% |
| Thonotosassa | 17 | $4,309 | $347.75 | 50% |
| Seminole | 519 | $4,223 | $316.69 | 52% |