Boca Raton Airbnb Market Analysis 2026: Short Term Rental Data & Vacation Rental Statistics in Florida, United States
Is Airbnb profitable in Boca Raton in 2026? Explore comprehensive Airbnb analytics for Boca Raton, Florida, United States to uncover income potential. This 2026 STR market report for Boca Raton, based on AirROI data from February 2025 to January 2026, reveals key trends in the market of 310 active listings.
Whether you're considering an Airbnb investment in Boca Raton, optimizing your existing vacation rental, or exploring rental arbitrage opportunities, understanding the Boca Raton Airbnb data is crucial. Navigating the high regulation landscape is key to maximizing your short term rental income potential. Let's dive into the specifics.
Key Boca Raton Airbnb Performance Metrics Overview
Monthly Airbnb Revenue Variations & Income Potential in Boca Raton (2026)
Understanding the monthly revenue variations for Airbnb listings in Boca Raton is key to maximizing your short term rental income potential. Seasonality significantly impacts earnings. Our analysis, based on data from the past 12 months, shows that the peak revenue month for STRs in Boca Raton is typically February, while September often presents the lowest earnings, highlighting opportunities for strategic pricing adjustments during shoulder and low seasons. Explore the typical Airbnb income in Boca Raton across different performance tiers:
- Best-in-class properties (Top 10%) achieve $9,363+ monthly, often utilizing dynamic pricing and superior guest experiences.
- Strong performing properties (Top 25%) earn $6,499 or more, indicating effective management and desirable locations/amenities.
- Typical properties (Median) generate around $3,797 per month, representing the average market performance.
- Entry-level properties (Bottom 25%) see earnings around $1,794, often with potential for optimization.
Average Monthly Airbnb Earnings Trend in Boca Raton
Boca Raton Airbnb Occupancy Rate Trends (2026)
Maximize your bookings by understanding the Boca Raton STR occupancy trends. Seasonal demand shifts significantly influence how often properties are booked. Typically, Februarysees the highest demand (peak season occupancy), while October experiences the lowest (low season). Effective strategies, like adjusting minimum stays or offering promotions, can boost occupancy during slower periods. Here's how different property tiers perform in Boca Raton:
- Best-in-class properties (Top 10%) achieve 84%+ occupancy, indicating high desirability and potentially optimized availability.
- Strong performing properties (Top 25%) maintain 71% or higher occupancy, suggesting good market fit and guest satisfaction.
- Typical properties (Median) have an occupancy rate around 48%.
- Entry-level properties (Bottom 25%) average 26% occupancy, potentially facing higher vacancy.
Average Monthly Occupancy Rate Trend in Boca Raton
Average Daily Rate (ADR) Airbnb Trends in Boca Raton (2026)
Effective short term rental pricing strategy in Boca Raton involves understanding monthly ADR fluctuations. The Average Daily Rate (ADR) for Airbnb in Boca Raton typically peaks in January and dips lowest during August. Leveraging Airbnb dynamic pricing tools or strategies based on this seasonality can significantly boost revenue. Here's a look at the typical nightly rates achieved:
- Best-in-class properties (Top 10%) command rates of $496+ per night, often due to premium features or locations.
- Strong performing properties (Top 25%) achieve nightly rates of $380 or more.
- Typical properties (Median) charge around $273 per night.
- Entry-level properties (Bottom 25%) earn around $161 per night.
Average Daily Rate (ADR) Trend by Month in Boca Raton
Get Live Boca Raton Market Intelligence 👇

Explore Real-time Analytics
Airbnb Seasonality Analysis & Trends in Boca Raton (2026)
Peak Season (February, March, December)
- Revenue averages $6,358 per month
- Occupancy rates average 59.1%
- Daily rates average $323
Shoulder Season
- Revenue averages $4,327 per month
- Occupancy maintains around 46.4%
- Daily rates hold near $292
Low Season (May, June, September)
- Revenue drops to average $3,426 per month
- Occupancy decreases to average 41.4%
- Daily rates adjust to average $267
Seasonality Insights for Boca Raton
- The Airbnb seasonality in Boca Raton shows highly seasonal trends requiring careful strategy. While the sections above show seasonal averages, it's also insightful to look at the extremes:
- During the high season, the absolute peak month showcases Boca Raton's highest earning potential, with monthly revenues capable of climbing to $7,016, occupancy reaching a high of 66.8%, and ADRs peaking at $348.
- Conversely, the slowest single month of the year, typically falling within the low season, marks the market's lowest point. In this month, revenue might dip to $3,295, occupancy could drop to 40.6%, and ADRs may adjust down to $261.
- Understanding both the seasonal averages and these monthly peaks and troughs in revenue, occupancy, and ADR is crucial for maximizing your Airbnb profit potential in Boca Raton.
Seasonal Strategies for Maximizing Profit
- Peak Season: Maximize revenue through premium pricing and potentially longer minimum stays. Ensure high availability.
- Low Season: Offer competitive pricing, special promotions (e.g., extended stay discounts), and flexible cancellation policies. Target off-season travelers like remote workers or budget-conscious guests.
- Shoulder Seasons: Implement dynamic pricing that balances peak and low rates. Target weekend travelers or specific events. Offer slightly more flexible terms than peak season.
- Regularly analyze your own performance against these Boca Raton seasonality benchmarks and adjust your pricing and availability strategy accordingly.
Best Areas for Airbnb Investment in Boca Raton (2026)
Exploring the top neighborhoods for short-term rentals in Boca Raton? This section highlights key areas, outlining why they are attractive for hosts and guests, along with notable local attractions. Consider these locations based on your target guest profile and investment strategy.
| Neighborhood / Area | Why Host Here? (Target Guests & Appeal) | Key Attractions & Landmarks |
|---|---|---|
| Downtown Boca Raton | The vibrant center of the city featuring shopping, dining, and entertainment options. Ideal for tourists looking to explore urban attractions and enjoy local culture. | Mizner Park, Boca Raton Museum of Art, Royal Palm Place, Town Center Mall, Boca Raton Public Library |
| Boca Raton Beaches | Beautiful sandy beaches with clear waters, perfect for sunbathing, watersports, and relaxing. Highly sought after for vacationers looking for a beach getaway. | Red Reef Park, Spanish River Park, South Beach Park, Boca Raton Resort & Club, Boca Inlet |
| Boca West | An affluent residential area known for its luxury amenities, golf courses, and country clubs. Attracts visitors seeking a luxurious lifestyle experience. | Boca West Country Club, Boca Raton Golf Club, Shopping at West Boca |
| Royal Palm Yacht & Country Club | An upscale community featuring lavish homes and access to yacht facilities. Ideal for affluent guests looking for exclusivity. | Boca Raton Marina, Yacht Club events, Luxury Shopping nearby |
| The Polo Club | An exclusive gated community known for its equestrian events and high-end living. Appeals to visitors interested in luxury and equestrian sports. | Polo matches, Tennis courts, Gourmet dining options |
| Boca Raton Lake | Scenic areas surrounding large lakes, ideal for outdoor enthusiasts and families. Promises a relaxing atmosphere away from the city's bustle. | Lake Boca, Water sports activities, Parks and trails |
| Spanish River Land | A tranquil neighborhood with easy access to the beach and parks. Popular for families and those seeking a peaceful environment. | Spanish River Park, Boca Raton Beach, Local eateries |
| Mizner Park | A high-end shopping and dining destination with cultural attractions including a museum and theater. Perfect for those looking for entertainment and nightlife. | Mizner Park Amphitheater, Shopping and dining, Boca Raton Museum of Art |
Understanding Airbnb License Requirements & STR Laws in Boca Raton (2026)
Yes, Boca Raton, Florida, United States enforces high STR regulations. Obtaining a license and ensuring compliance is almost certainly required according to current 2026 STR laws. Always verify the latest short term rental regulations and Airbnb license requirements directly with local government authorities for Boca Raton to ensure full compliance before hosting.
(Source: AirROI data, 2026, based on 85% licensed listings)
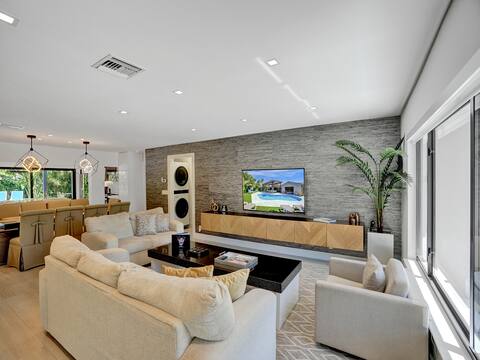
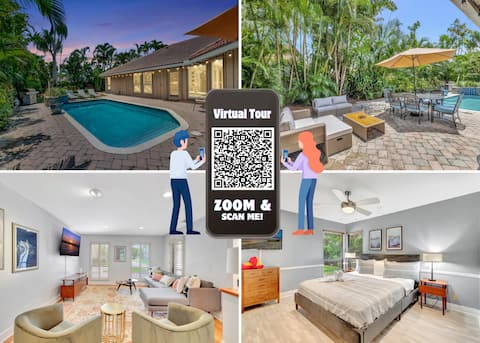
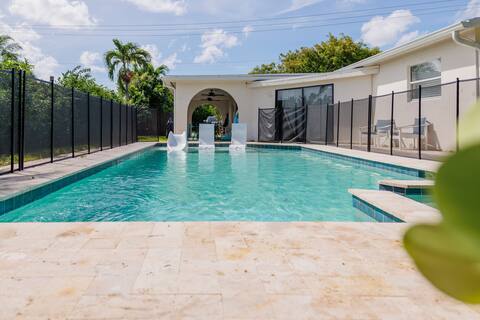
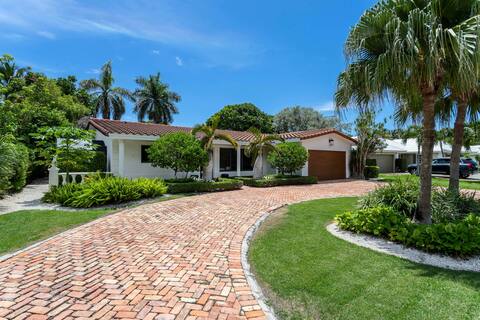
Top Performing Airbnb Properties in Boca Raton (2026)
Benchmark your potential! Explore examples of top-performing Airbnb properties in Boca Ratonbased on Trailing Twelve Month (TTM) revenue. Analyze their characteristics, revenue, occupancy rate, and ADR to understand what drives success in this market.
Luxury close to beach heat pool/hot tub/pool table
Entire Place • 4 bedrooms

4 Bedroom 2 Bathroom Lovely Pool
Entire Place • 4 bedrooms

Exclusive Boca Home Hosted by BNR Vacation Rentals
Entire Place • 3 bedrooms
Idyllic Boca Pool Home: 4/2.5 + Study-FAU & Mizner
Entire Place • 4 bedrooms
1mi to Beach 2 Suite 4bd/3bth Home with Pool &Spa
Entire Place • 4 bedrooms
Beachside 4 Bedroom home with large pool
Entire Place • 4 bedrooms
Note: Performance varies based on location, size, amenities, seasonality, and management quality. Data reflects the past 12 months.
Top Performing Airbnb Hosts in Boca Raton (2026)
Learn from the best! This table showcases top-performing Airbnb hosts in Boca Raton based on the number of properties managed and estimated total revenue over the past year. Analyze their scale and performance metrics.
| Host Name | Properties | Grossing Revenue | Stay Reviews | Avg Rating |
|---|---|---|---|---|
| Emanuele | 33 | $1,474,624 | 815 | 4.89/5.0 |
| Ben | 29 | $571,090 | 477 | 4.72/5.0 |
| James | 19 | $325,735 | 328 | 4.68/5.0 |
| David | 7 | $272,040 | 114 | 4.76/5.0 |
| Brampton Park | 2 | $219,677 | 32 | 4.91/5.0 |
| Denise | 5 | $209,647 | 641 | 4.86/5.0 |
| Sonia | 3 | $209,433 | 169 | 4.92/5.0 |
| Lawrence | 3 | $188,290 | 241 | 4.88/5.0 |
| Max | 1 | $149,617 | 105 | 4.97/5.0 |
| Nicholette | 1 | $137,395 | 9 | 5.00/5.0 |
Analyzing the strategies of top hosts, such as their property selection, pricing, and guest communication, can offer valuable lessons for optimizing your own Airbnb operations in Boca Raton.
Dive Deeper: Advanced Boca Raton STR Market Data (2026)
Ready to unlock more insights? AirROI provides access to advanced metrics and comprehensive Airbnb data for Boca Raton. Explore detailed analytics beyond this report to refine your investment strategy, optimize pricing, and maximize your vacation rental profits.
Explore Advanced MetricsBoca Raton Short-Term Rental Market Composition (2026): Property & Room Types
Room Type Distribution
Property Type Distribution
Market Composition Insights for Boca Raton
- The Boca Raton Airbnb market composition is heavily skewed towards Entire Home/Apt listings, which make up 86.8% of the 310 active rentals. This indicates strong guest preference for privacy and space.
- Looking at the property type distribution in Boca Raton, House properties are the most common (56.1%), reflecting the local real estate landscape.
- Houses represent a significant 56.1% portion, catering likely to families or larger groups.
- Smaller segments like hotel/boutique, others, outdoor/unique (combined 7.4%) offer potential for unique stay experiences.
Boca Raton Airbnb Room Capacity Analysis (2026): Bedroom Distribution
Distribution of Listings by Number of Bedrooms
Room Capacity Insights for Boca Raton
- The dominant room capacity in Boca Raton is 3 bedrooms listings, making up 27.1% of the market. This suggests a strong demand for properties suitable for families or small groups.
- Together, 3 bedrooms and 1 bedroom properties represent 51.6% of the active Airbnb listings in Boca Raton, indicating a high concentration in these sizes.
- A significant 40.0% of listings offer 3+ bedrooms, catering to larger groups and families seeking more space in Boca Raton.
Boca Raton Vacation Rental Guest Capacity Trends (2026)
Distribution of Listings by Guest Capacity
Guest Capacity Insights for Boca Raton
- The most common guest capacity trend in Boca Raton vacation rentals is listings accommodating 6 guests (24.2%). This suggests the primary traveler segment is likely larger groups.
- Properties designed for 6 guests and 8+ guests dominate the Boca Raton STR market, accounting for 46.8% of listings.
- 51.0% of properties accommodate 6+ guests, serving the market segment for larger families or group travel in Boca Raton.
- On average, properties in Boca Raton are equipped to host 5.1 guests.
Boca Raton Airbnb Booking Patterns (2026): Available vs. Booked Days
Available Days Distribution
Booked Days Distribution
Booking Pattern Insights for Boca Raton
- The most common availability pattern in Boca Raton falls within the 271-366 days range, representing 46.5% of listings. This suggests many properties have significant open periods on their calendars.
- Approximately 82.3% of listings show high availability (181+ days open annually), indicating potential for increased bookings or specific owner usage patterns.
- For booked days, the 91-180 days range is most frequent in Boca Raton (36.8%), reflecting common guest stay durations or potential owner blocking patterns.
- A notable 19.3% of properties secure long booking periods (181+ days booked per year), highlighting successful long-term rental strategies or significant owner usage.
Boca Raton Airbnb Minimum Stay Requirements Analysis
Distribution of Listings by Minimum Night Requirement
1 Night
34 listings
11% of total
2 Nights
49 listings
15.8% of total
3 Nights
34 listings
11% of total
4-6 Nights
17 listings
5.5% of total
7-29 Nights
17 listings
5.5% of total
30+ Nights
159 listings
51.3% of total
Key Insights
- The most prevalent minimum stay requirement in Boca Raton is 30+ Nights, adopted by 51.3% of listings. This highlights the market's preference for longer commitments.
- A significant segment (51.3%) caters to monthly stays (30+ nights) in Boca Raton, pointing to opportunities in the extended-stay market.
Recommendations
- Align with the market by considering a 30+ Nights minimum stay, as 51.3% of Boca Raton hosts use this setting.
- If feasible, allowing 1-night stays, especially midweek or during low season, could capture last-minute bookings, as only 11% currently do.
- Explore offering discounts for stays of 30+ nights to attract the 51.3% of the market seeking extended stays.
- Adjust minimum nights based on seasonality – potentially shorter during low season and longer during peak demand periods in Boca Raton.
Boca Raton Airbnb Cancellation Policy Trends Analysis (2026)
Super Strict 60 Days
31 listings
10.1% of total
Super Strict 30 Days
3 listings
1% of total
Limited
11 listings
3.6% of total
Flexible
40 listings
13% of total
Moderate
46 listings
14.9% of total
Firm
108 listings
35.1% of total
Strict
69 listings
22.4% of total
Cancellation Policy Insights for Boca Raton
- The prevailing Airbnb cancellation policy trend in Boca Raton is Firm, used by 35.1% of listings.
- A majority (57.5%) of hosts in Boca Raton utilize Firm or Strict policies, indicating a market where hosts prioritize booking security.
Recommendations for Hosts
- Consider adopting a Firm policy to align with the 35.1% market standard in Boca Raton.
- Regularly review your cancellation policy against competitors and market demand shifts in Boca Raton.
Boca Raton STR Booking Lead Time Analysis (2026)
Average Booking Lead Time by Month
Booking Lead Time Insights for Boca Raton
- The overall average booking lead time for vacation rentals in Boca Raton is 39 days.
- Guests book furthest in advance for stays during January (average 64 days), likely coinciding with peak travel demand or local events.
- The shortest booking windows occur for stays in September (average 23 days), indicating more last-minute travel plans during this time.
- Seasonally, Winter (61 days avg.) sees the longest lead times, while Summer (31 days avg.) has the shortest, reflecting typical travel planning cycles.
Recommendations for Hosts
- Use the overall average lead time (39 days) as a baseline for your pricing and availability strategy in Boca Raton.
- For January stays, consider implementing length-of-stay discounts or slightly higher rates for bookings made less than 64 days out to capitalize on advance planning.
- Target marketing efforts for the Winter season well in advance (at least 61 days) to capture early planners.
- Monitor your own booking lead times against these Boca Raton averages to identify opportunities for dynamic pricing adjustments.
Popular & Essential Airbnb Amenities in Boca Raton (2026)
Amenity Prevalence
Amenity Insights for Boca Raton
- Essential amenities in Boca Raton that guests expect include: Air conditioning, TV, Wifi, Free parking on premises, Smoke alarm. Lacking these (any) could significantly impact bookings.
- Popular amenities like Washer, Kitchen, Microwave are common but not universal. Offering these can provide a competitive edge.
Recommendations for Hosts
- Ensure your listing includes all essential amenities for Boca Raton: Air conditioning, TV, Wifi, Free parking on premises, Smoke alarm.
- Prioritize adding missing essentials: Air conditioning, TV, Wifi, Free parking on premises, Smoke alarm.
- Consider adding popular differentiators like Washer or Kitchen to increase appeal.
- Highlight unique or less common amenities you offer (e.g., hot tub, dedicated workspace, EV charger) in your listing description and photos.
- Regularly check competitor amenities in Boca Raton to stay competitive.
Boca Raton Airbnb Guest Demographics & Profile Analysis (2026)
Guest Profile Summary for Boca Raton
- The typical guest profile for Airbnb in Boca Raton consists of primarily domestic travelers (88%), often arriving from nearby New York, typically belonging to the Post-2000s (Gen Z/Alpha) group (50%), primarily speaking English or Spanish.
- Domestic travelers account for 87.9% of guests.
- Key international markets include United States (87.9%) and Canada (3%).
- Top languages spoken are English (57.7%) followed by Spanish (17.2%).
- A significant demographic segment is the Post-2000s (Gen Z/Alpha) group, representing 50% of guests.
Recommendations for Hosts
- Target domestic marketing efforts towards travelers from New York and Boca Raton.
- Tailor amenities and listing descriptions to appeal to the dominant Post-2000s (Gen Z/Alpha) demographic (e.g., highlight fast WiFi, smart home features, local guides).
- Highlight unique local experiences or amenities relevant to the primary guest profile.
- Consider seasonal promotions aligned with peak travel times for key origin markets.
Nearby Short-Term Rental Market Comparison
How does the Boca Raton Airbnb market stack up against its neighbors? Compare key performance metrics like average monthly revenue, ADR, and occupancy rates in surrounding areas to understand the broader regional STR landscape.
| Market | Active Properties | Monthly Revenue | Daily Rate | Avg. Occupancy |
|---|---|---|---|---|
| Sailfish Point | 19 | $16,709 | $1587.63 | 48% |
| Bal Harbour Village | 37 | $8,846 | $850.63 | 34% |
| Lake Clarke Shores | 26 | $6,710 | $516.52 | 46% |
| Lighthouse Point | 75 | $6,205 | $472.94 | 51% |
| Pinecrest | 11 | $6,117 | $861.24 | 43% |
| North Bay Village | 120 | $6,032 | $561.12 | 44% |
| Tequesta | 43 | $4,920 | $376.96 | 50% |
| Juno Beach | 39 | $4,807 | $377.00 | 47% |
| Parkland | 17 | $4,637 | $369.21 | 47% |
| Ocean Ridge | 14 | $4,588 | $602.78 | 48% |