Bell Airbnb Market Analysis 2025: Short Term Rental Data & Vacation Rental Statistics in Florida, United States
Is Airbnb profitable in Bell in 2025? Explore comprehensive Airbnb analytics for Bell, Florida, United States to uncover income potential. This 2025 STR market report for Bell, based on AirROI data from September 2024 to August 2025, reveals key trends in the niche market of 19 active listings.
Whether you're considering an Airbnb investment in Bell, optimizing your existing vacation rental, or exploring rental arbitrage opportunities, understanding the Bell Airbnb data is crucial. Leveraging the low regulation environment is key to maximizing your short term rental income potential. Let's dive into the specifics.
Key Bell Airbnb Performance Metrics Overview
Monthly Airbnb Revenue Variations & Income Potential in Bell (2025)
Understanding the monthly revenue variations for Airbnb listings in Bell is key to maximizing your short term rental income potential. Seasonality significantly impacts earnings. Our analysis, based on data from the past 12 months, shows that the peak revenue month for STRs in Bell is typically August, while January often presents the lowest earnings, highlighting opportunities for strategic pricing adjustments during shoulder and low seasons. Explore the typical Airbnb income in Bell across different performance tiers:
- Best-in-class properties (Top 10%) achieve $5,603+ monthly, often utilizing dynamic pricing and superior guest experiences.
- Strong performing properties (Top 25%) earn $2,749 or more, indicating effective management and desirable locations/amenities.
- Typical properties (Median) generate around $1,683 per month, representing the average market performance.
- Entry-level properties (Bottom 25%) see earnings around $794, often with potential for optimization.
Average Monthly Airbnb Earnings Trend in Bell
Bell Airbnb Occupancy Rate Trends (2025)
Maximize your bookings by understanding the Bell STR occupancy trends. Seasonal demand shifts significantly influence how often properties are booked. Typically, Marchsees the highest demand (peak season occupancy), while January experiences the lowest (low season). Effective strategies, like adjusting minimum stays or offering promotions, can boost occupancy during slower periods. Here's how different property tiers perform in Bell:
- Best-in-class properties (Top 10%) achieve 76%+ occupancy, indicating high desirability and potentially optimized availability.
- Strong performing properties (Top 25%) maintain 62% or higher occupancy, suggesting good market fit and guest satisfaction.
- Typical properties (Median) have an occupancy rate around 42%.
- Entry-level properties (Bottom 25%) average 21% occupancy, potentially facing higher vacancy.
Average Monthly Occupancy Rate Trend in Bell
Average Daily Rate (ADR) Airbnb Trends in Bell (2025)
Effective short term rental pricing strategy in Bell involves understanding monthly ADR fluctuations. The Average Daily Rate (ADR) for Airbnb in Bell typically peaks in June and dips lowest during April. Leveraging Airbnb dynamic pricing tools or strategies based on this seasonality can significantly boost revenue. Here's a look at the typical nightly rates achieved:
- Best-in-class properties (Top 10%) command rates of $315+ per night, often due to premium features or locations.
- Strong performing properties (Top 25%) achieve nightly rates of $210 or more.
- Typical properties (Median) charge around $123 per night.
- Entry-level properties (Bottom 25%) earn around $82 per night.
Average Daily Rate (ADR) Trend by Month in Bell
Get Live Bell Market Intelligence 👇

Explore Real-time Analytics
Airbnb Seasonality Analysis & Trends in Bell (2025)
Peak Season (August, July, March)
- Revenue averages $2,963 per month
- Occupancy rates average 48.0%
- Daily rates average $173
Shoulder Season
- Revenue averages $2,219 per month
- Occupancy maintains around 45.5%
- Daily rates hold near $174
Low Season (January, April, September)
- Revenue drops to average $1,700 per month
- Occupancy decreases to average 35.6%
- Daily rates adjust to average $166
Seasonality Insights for Bell
- The Airbnb seasonality in Bell shows highly seasonal trends requiring careful strategy. While the sections above show seasonal averages, it's also insightful to look at the extremes:
- During the high season, the absolute peak month showcases Bell's highest earning potential, with monthly revenues capable of climbing to $3,270, occupancy reaching a high of 54.5%, and ADRs peaking at $182.
- Conversely, the slowest single month of the year, typically falling within the low season, marks the market's lowest point. In this month, revenue might dip to $1,595, occupancy could drop to 32.1%, and ADRs may adjust down to $154.
- Understanding both the seasonal averages and these monthly peaks and troughs in revenue, occupancy, and ADR is crucial for maximizing your Airbnb profit potential in Bell.
Seasonal Strategies for Maximizing Profit
- Peak Season: Maximize revenue through premium pricing and potentially longer minimum stays. Ensure high availability.
- Low Season: Offer competitive pricing, special promotions (e.g., extended stay discounts), and flexible cancellation policies. Target off-season travelers like remote workers or budget-conscious guests.
- Shoulder Seasons: Implement dynamic pricing that balances peak and low rates. Target weekend travelers or specific events. Offer slightly more flexible terms than peak season.
- Regularly analyze your own performance against these Bell seasonality benchmarks and adjust your pricing and availability strategy accordingly.
Best Areas for Airbnb Investment in Bell (2025)
Exploring the top neighborhoods for short-term rentals in Bell? This section highlights key areas, outlining why they are attractive for hosts and guests, along with notable local attractions. Consider these locations based on your target guest profile and investment strategy.
| Neighborhood / Area | Why Host Here? (Target Guests & Appeal) | Key Attractions & Landmarks |
|---|---|---|
| Bell Springs | A serene natural setting near the famous Suwannee River, perfect for nature lovers seeking peace and outdoor activities. Ideal for families or couples looking for a weekend getaway. | Suwannee River State Park, Stephen Foster Folk Culture Center State Park, Fishing and boating on the Suwannee River, Bird watching and hiking trails |
| Downtown Bell | The heart of Bell with local charm and access to community events. Great for travelers wanting an authentic small-town experience. | Local restaurants, Community parks, Farmers' market, Historic sites, Events at local community center |
| Fanning Springs | A vibrant area known for its natural springs and recreational opportunities. Attracts families and adventure seekers looking for outdoor fun. | Fanning Springs State Park, Kayaking and canoeing, Swimming in natural springs, Wildlife viewing |
| Suwannee River | Ideal for those seeking outdoor recreational activities like fishing, kayaking, and camping. A popular destination for water sports enthusiasts. | Suwannee River, Camping sites along the river, Fishing spots, Kayak rentals |
| Gilchrist Blue Springs State Park | Recognized for its stunning natural springs and amenities, attracting eco-tourists and groups looking for nature-based experiences. | Blue Springs, Picnic areas, Diving opportunities, Hiking trails |
| Troy Springs State Park | A hidden gem for snorkeling and swimming in a picturesque setting. Great for families and outdoor adventurers. | Troy Spring, Snorkeling spots, Historic structures, Nature trails |
| Chiefland | A nearby town with local amenities and charm, providing easy access to Bell and surrounding attractions. Suitable for budget-conscious travelers. | Local shops and restaurants, Nearby natural parks, Festivals and events |
| Hiking Trails | Abundant trails in the vicinity attracting hikers and nature enthusiasts, providing a range of experiences from easy walks to challenging hikes. | Nature trails, Scenic views, Wildlife observation, Picnic areas |
Understanding Airbnb License Requirements & STR Laws in Bell (2025)
While Bell, Florida, United States currently shows low STR regulations, specific Airbnb license requirements might still exist or change. Always verify the latest short term rental regulations and Airbnb license requirements directly with local government authorities for Bell to ensure full compliance before hosting.
(Source: AirROI data, 2025, finding no licensed listings among those analyzed)
Top Performing Airbnb Properties in Bell (2025)
Benchmark your potential! Explore examples of top-performing Airbnb properties in Bellbased on Trailing Twelve Month (TTM) revenue. Analyze their characteristics, revenue, occupancy rate, and ADR to understand what drives success in this market.
Suwannee River Manor
Entire Place • 6 bedrooms
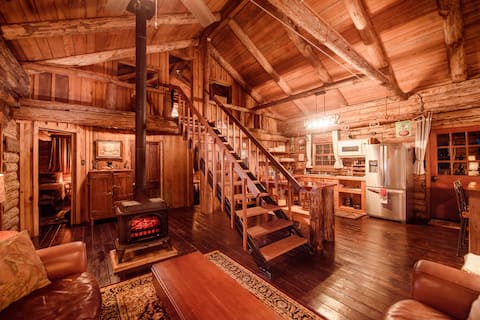
340 Red Rooster Lodge (log cabin)Hot Tub
Entire Place • 3 bedrooms

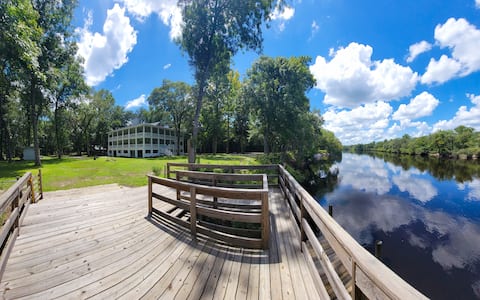
Charming Abode w/ Dock on the Suwannee River
Entire Place • 3 bedrooms
Beautiful 3 bedroom cabin on the Suwannee river.
Entire Place • 3 bedrooms

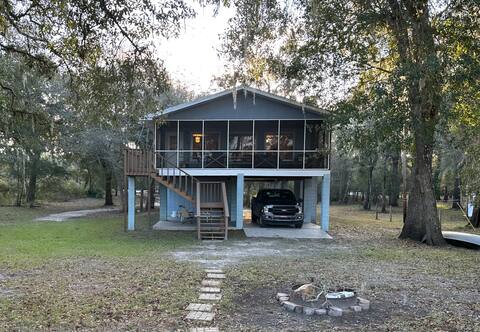
Bell, Fl 3/2 home on Suwannee w/boat ramp
Entire Place • 3 bedrooms
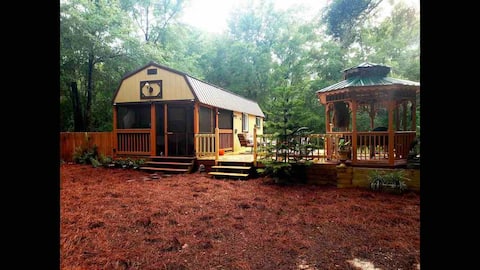
Lala Land. 10 acres all to yourself!
Entire Place • 2 bedrooms
Note: Performance varies based on location, size, amenities, seasonality, and management quality. Data reflects the past 12 months.
Top Performing Airbnb Hosts in Bell (2025)
Learn from the best! This table showcases top-performing Airbnb hosts in Bell based on the number of properties managed and estimated total revenue over the past year. Analyze their scale and performance metrics.
| Host Name | Properties | Grossing Revenue | Stay Reviews | Avg Rating |
|---|---|---|---|---|
| Kindall | 1 | $88,555 | 53 | 4.85/5.0 |
| Geoffrey | 1 | $57,215 | 197 | 4.96/5.0 |
| Evolve | 1 | $38,509 | 48 | 4.67/5.0 |
| Kathleen | 1 | $38,001 | 44 | 4.89/5.0 |
| Gustavo | 2 | $29,544 | 111 | 4.99/5.0 |
| Cynthia | 1 | $21,448 | 21 | 4.81/5.0 |
| Jared And Stephanie | 1 | $20,830 | 194 | 4.93/5.0 |
| Betsey | 1 | $19,145 | 19 | 5.00/5.0 |
| Steve | 1 | $18,234 | 99 | 4.88/5.0 |
| Lauren | 1 | $14,765 | 14 | 4.93/5.0 |
Analyzing the strategies of top hosts, such as their property selection, pricing, and guest communication, can offer valuable lessons for optimizing your own Airbnb operations in Bell.
Dive Deeper: Advanced Bell STR Market Data (2025)
Ready to unlock more insights? AirROI provides access to advanced metrics and comprehensive Airbnb data for Bell. Explore detailed analytics beyond this report to refine your investment strategy, optimize pricing, and maximize your vacation rental profits.
Explore Advanced MetricsBell Short-Term Rental Market Composition (2025): Property & Room Types
Room Type Distribution
Property Type Distribution
Market Composition Insights for Bell
- The Bell Airbnb market composition is heavily skewed towards Entire Home/Apt listings, which make up 89.5% of the 19 active rentals. This indicates strong guest preference for privacy and space.
- Looking at the property type distribution in Bell, House properties are the most common (57.9%), reflecting the local real estate landscape.
- Houses represent a significant 57.9% portion, catering likely to families or larger groups.
- The presence of 5.3% Hotel/Boutique listings indicates integration with traditional hospitality.
Bell Airbnb Room Capacity Analysis (2025): Bedroom Distribution
Distribution of Listings by Number of Bedrooms
Room Capacity Insights for Bell
- The dominant room capacity in Bell is 2 bedrooms listings, making up 31.6% of the market. This suggests a strong demand for properties suitable for couples or solo travelers.
- Together, 2 bedrooms and 1 bedroom properties represent 63.2% of the active Airbnb listings in Bell, indicating a high concentration in these sizes.
- A significant 31.6% of listings offer 3+ bedrooms, catering to larger groups and families seeking more space in Bell.
Bell Vacation Rental Guest Capacity Trends (2025)
Distribution of Listings by Guest Capacity
Guest Capacity Insights for Bell
- The most common guest capacity trend in Bell vacation rentals is listings accommodating 4 guests (36.8%). This suggests the primary traveler segment is likely small families or groups.
- Properties designed for 4 guests and 6 guests dominate the Bell STR market, accounting for 52.6% of listings.
- 31.6% of properties accommodate 6+ guests, serving the market segment for larger families or group travel in Bell.
- On average, properties in Bell are equipped to host 4.6 guests.
Bell Airbnb Booking Patterns (2025): Available vs. Booked Days
Available Days Distribution
Booked Days Distribution
Booking Pattern Insights for Bell
- The most common availability pattern in Bell falls within the 181-270 days range, representing 42.1% of listings. This suggests many properties have significant open periods on their calendars.
- Approximately 73.7% of listings show high availability (181+ days open annually), indicating potential for increased bookings or specific owner usage patterns.
- For booked days, the 91-180 days range is most frequent in Bell (42.1%), reflecting common guest stay durations or potential owner blocking patterns.
- A notable 26.3% of properties secure long booking periods (181+ days booked per year), highlighting successful long-term rental strategies or significant owner usage.
Bell Airbnb Minimum Stay Requirements Analysis
Distribution of Listings by Minimum Night Requirement
1 Night
3 listings
15.8% of total
2 Nights
10 listings
52.6% of total
3 Nights
1 listings
5.3% of total
4-6 Nights
1 listings
5.3% of total
30+ Nights
4 listings
21.1% of total
Key Insights
- The most prevalent minimum stay requirement in Bell is 2 Nights, adopted by 52.6% of listings. This highlights the market's preference for shorter, flexible bookings.
- A strong majority (68.4%) of the Bell Airbnb data shows acceptance of very short stays (1-2 nights), indicating a dynamic, high-turnover market.
- A significant segment (21.1%) caters to monthly stays (30+ nights) in Bell, pointing to opportunities in the extended-stay market.
Recommendations
- Align with the market by considering a 2 Nights minimum stay, as 52.6% of Bell hosts use this setting.
- If feasible, allowing 1-night stays, especially midweek or during low season, could capture last-minute bookings, as only 15.8% currently do.
- A 2-night minimum appears standard (52.6%). Consider this for weekends or peak periods.
- Explore offering discounts for stays of 30+ nights to attract the 21.1% of the market seeking extended stays.
- Adjust minimum nights based on seasonality – potentially shorter during low season and longer during peak demand periods in Bell.
Bell Airbnb Cancellation Policy Trends Analysis (2025)
Flexible
7 listings
41.2% of total
Moderate
4 listings
23.5% of total
Firm
4 listings
23.5% of total
Strict
2 listings
11.8% of total
Cancellation Policy Insights for Bell
- The prevailing Airbnb cancellation policy trend in Bell is Flexible, used by 41.2% of listings.
- There's a relatively balanced mix between guest-friendly (64.7%) and stricter (35.3%) policies, offering choices for different guest needs.
Recommendations for Hosts
- Consider adopting a Flexible policy to align with the 41.2% market standard in Bell.
- Using a Strict policy might deter some guests, as only 11.8% of listings use it. Evaluate if potential revenue protection outweighs possible lower booking rates.
- Regularly review your cancellation policy against competitors and market demand shifts in Bell.
Bell STR Booking Lead Time Analysis (2025)
Average Booking Lead Time by Month
Booking Lead Time Insights for Bell
- The overall average booking lead time for vacation rentals in Bell is 21 days.
- Guests book furthest in advance for stays during August (average 38 days), likely coinciding with peak travel demand or local events.
- The shortest booking windows occur for stays in October (average 14 days), indicating more last-minute travel plans during this time.
- Seasonally, Summer (32 days avg.) sees the longest lead times, while Fall (19 days avg.) has the shortest, reflecting typical travel planning cycles.
Recommendations for Hosts
- Use the overall average lead time (21 days) as a baseline for your pricing and availability strategy in Bell.
- For August stays, consider implementing length-of-stay discounts or slightly higher rates for bookings made less than 38 days out to capitalize on advance planning.
- Target marketing efforts for the Summer season well in advance (at least 32 days) to capture early planners.
- Monitor your own booking lead times against these Bell averages to identify opportunities for dynamic pricing adjustments.
Popular & Essential Airbnb Amenities in Bell (2025)
Amenity Prevalence
Amenity Insights for Bell
- Essential amenities in Bell that guests expect include: Free parking on premises. Lacking these (this) could significantly impact bookings.
- Popular amenities like Hot water, Air conditioning, Coffee maker are common but not universal. Offering these can provide a competitive edge.
- Warning: Wifi is not universally provided but is considered essential globally. Ensure reliable Wifi is offered.
Recommendations for Hosts
- Ensure your listing includes all essential amenities for Bell: Free parking on premises.
- Consider adding popular differentiators like Hot water or Air conditioning to increase appeal.
- Highlight unique or less common amenities you offer (e.g., hot tub, dedicated workspace, EV charger) in your listing description and photos.
- Regularly check competitor amenities in Bell to stay competitive.
Bell Airbnb Guest Demographics & Profile Analysis (2025)
Guest Profile Summary for Bell
- The typical guest profile for Airbnb in Bell consists of primarily domestic travelers (96%), often arriving from nearby Miami, typically belonging to the Post-2000s (Gen Z/Alpha) group (50%), primarily speaking English or Spanish.
- Domestic travelers account for 96.4% of guests.
- Key international markets include United States (96.4%) and United Kingdom (1.2%).
- Top languages spoken are English (67.6%) followed by Spanish (17.6%).
- A significant demographic segment is the Post-2000s (Gen Z/Alpha) group, representing 50% of guests.
Recommendations for Hosts
- Target domestic marketing efforts towards travelers from Miami and Tampa.
- Tailor amenities and listing descriptions to appeal to the dominant Post-2000s (Gen Z/Alpha) demographic (e.g., highlight fast WiFi, smart home features, local guides).
- Highlight unique local experiences or amenities relevant to the primary guest profile.
- Consider seasonal promotions aligned with peak travel times for key origin markets.
Nearby Short-Term Rental Market Comparison
How does the Bell Airbnb market stack up against its neighbors? Compare key performance metrics like average monthly revenue, ADR, and occupancy rates in surrounding areas to understand the broader regional STR landscape.
| Market | Active Properties | Monthly Revenue | Daily Rate | Avg. Occupancy |
|---|---|---|---|---|
| St. Augustine Beach | 10 | $6,573 | $402.54 | 47% |
| Reunion | 13 | $5,874 | $561.09 | 42% |
| Vilano Beach | 174 | $5,510 | $425.17 | 46% |
| Ponte Vedra Beach | 232 | $5,457 | $554.18 | 43% |
| Thonotosassa | 17 | $4,616 | $332.25 | 55% |
| Jacksonville Beach | 775 | $3,944 | $311.05 | 49% |
| Campbell | 24 | $3,704 | $302.91 | 49% |
| Hernando Beach | 81 | $3,682 | $293.72 | 48% |
| Saint Augustine | 1,873 | $3,479 | $273.24 | 47% |
| Palm Harbor | 283 | $3,397 | $253.00 | 52% |