Anna Maria island Airbnb Market Analysis 2026: Short Term Rental Data & Vacation Rental Statistics in Florida, United States
Is Airbnb profitable in Anna Maria island in 2026? Explore comprehensive Airbnb analytics for Anna Maria island, Florida, United States to uncover income potential. This 2026 STR market report for Anna Maria island, based on AirROI data from February 2025 to January 2026, reveals key trends in the market of 587 active listings.
Whether you're considering an Airbnb investment in Anna Maria island, optimizing your existing vacation rental, or exploring rental arbitrage opportunities, understanding the Anna Maria island Airbnb data is crucial. Leveraging the low regulation environment is key to maximizing your short term rental income potential. Let's dive into the specifics.
Key Anna Maria island Airbnb Performance Metrics Overview
Monthly Airbnb Revenue Variations & Income Potential in Anna Maria island (2026)
Understanding the monthly revenue variations for Airbnb listings in Anna Maria island is key to maximizing your short term rental income potential. Seasonality significantly impacts earnings. Our analysis, based on data from the past 12 months, shows that the peak revenue month for STRs in Anna Maria island is typically March, while September often presents the lowest earnings, highlighting opportunities for strategic pricing adjustments during shoulder and low seasons. Explore the typical Airbnb income in Anna Maria island across different performance tiers:
- Best-in-class properties (Top 10%) achieve $24,111+ monthly, often utilizing dynamic pricing and superior guest experiences.
- Strong performing properties (Top 25%) earn $15,719 or more, indicating effective management and desirable locations/amenities.
- Typical properties (Median) generate around $9,016 per month, representing the average market performance.
- Entry-level properties (Bottom 25%) see earnings around $4,503, often with potential for optimization.
Average Monthly Airbnb Earnings Trend in Anna Maria island
Anna Maria island Airbnb Occupancy Rate Trends (2026)
Maximize your bookings by understanding the Anna Maria island STR occupancy trends. Seasonal demand shifts significantly influence how often properties are booked. Typically, Julysees the highest demand (peak season occupancy), while January experiences the lowest (low season). Effective strategies, like adjusting minimum stays or offering promotions, can boost occupancy during slower periods. Here's how different property tiers perform in Anna Maria island:
- Best-in-class properties (Top 10%) achieve 80%+ occupancy, indicating high desirability and potentially optimized availability.
- Strong performing properties (Top 25%) maintain 66% or higher occupancy, suggesting good market fit and guest satisfaction.
- Typical properties (Median) have an occupancy rate around 43%.
- Entry-level properties (Bottom 25%) average 22% occupancy, potentially facing higher vacancy.
Average Monthly Occupancy Rate Trend in Anna Maria island
Average Daily Rate (ADR) Airbnb Trends in Anna Maria island (2026)
Effective short term rental pricing strategy in Anna Maria island involves understanding monthly ADR fluctuations. The Average Daily Rate (ADR) for Airbnb in Anna Maria island typically peaks in March and dips lowest during September. Leveraging Airbnb dynamic pricing tools or strategies based on this seasonality can significantly boost revenue. Here's a look at the typical nightly rates achieved:
- Best-in-class properties (Top 10%) command rates of $1,410+ per night, often due to premium features or locations.
- Strong performing properties (Top 25%) achieve nightly rates of $1,015 or more.
- Typical properties (Median) charge around $683 per night.
- Entry-level properties (Bottom 25%) earn around $481 per night.
Average Daily Rate (ADR) Trend by Month in Anna Maria island
Get Live Anna Maria island Market Intelligence 👇

Explore Real-time Analytics
Airbnb Seasonality Analysis & Trends in Anna Maria island (2026)
Peak Season (March, July, April)
- Revenue averages $17,276 per month
- Occupancy rates average 57.7%
- Daily rates average $902
Shoulder Season
- Revenue averages $11,300 per month
- Occupancy maintains around 45.1%
- Daily rates hold near $781
Low Season (January, September, December)
- Revenue drops to average $7,500 per month
- Occupancy decreases to average 30.6%
- Daily rates adjust to average $780
Seasonality Insights for Anna Maria island
- The Airbnb seasonality in Anna Maria island shows highly seasonal trends requiring careful strategy. While the sections above show seasonal averages, it's also insightful to look at the extremes:
- During the high season, the absolute peak month showcases Anna Maria island's highest earning potential, with monthly revenues capable of climbing to $19,349, occupancy reaching a high of 61.8%, and ADRs peaking at $978.
- Conversely, the slowest single month of the year, typically falling within the low season, marks the market's lowest point. In this month, revenue might dip to $6,620, occupancy could drop to 28.6%, and ADRs may adjust down to $676.
- Understanding both the seasonal averages and these monthly peaks and troughs in revenue, occupancy, and ADR is crucial for maximizing your Airbnb profit potential in Anna Maria island.
Seasonal Strategies for Maximizing Profit
- Peak Season: Maximize revenue through premium pricing and potentially longer minimum stays. Ensure high availability.
- Low Season: Offer competitive pricing, special promotions (e.g., extended stay discounts), and flexible cancellation policies. Target off-season travelers like remote workers or budget-conscious guests.
- Shoulder Seasons: Implement dynamic pricing that balances peak and low rates. Target weekend travelers or specific events. Offer slightly more flexible terms than peak season.
- Regularly analyze your own performance against these Anna Maria island seasonality benchmarks and adjust your pricing and availability strategy accordingly.
Best Areas for Airbnb Investment in Anna Maria island (2026)
Exploring the top neighborhoods for short-term rentals in Anna Maria island? This section highlights key areas, outlining why they are attractive for hosts and guests, along with notable local attractions. Consider these locations based on your target guest profile and investment strategy.
| Neighborhood / Area | Why Host Here? (Target Guests & Appeal) | Key Attractions & Landmarks |
|---|---|---|
| Holmes Beach | A quiet residential area offering beautiful beaches and a family-friendly atmosphere. Ideal for tourists seeking a peaceful getaway with easy access to local dining and shopping. | Holmes Beach, Manatee Public Beach, Island Shopping Center, Primitive Soule Beach, Hurricane Hanks |
| Bradenton Beach | Known for its charming fishing village vibe and beautiful waterfront views. Attracts visitors looking for a laid-back vacation experience with plenty of outdoor activities. | Bridge Street Pier, Bradenton Beach Historic District, Cortez Fishing Village, Gulf Drive Cafe, Coquina Beach |
| Anna Maria City | Quaint coastal town with a relaxed atmosphere and stunning sunsets. Perfect for tourists who appreciate small-town charm, local art, and nature. | Bean Point Beach, Anna Maria Island Historical Museum, The Sand Bar, Rod and Reel Pier, Anna Maria Island City Pier |
| Longboat Key | Luxury beach destination offering pristine beaches, upscale resorts, and a quieter atmosphere. Appeals to visitors seeking a high-end vacation experience. | Longboat Key Beaches, Cedars Tennis Resort, Joan M. Durante Park, Longboat Key Pass, Zodiac Boat Rentals |
| Coquina Beach | Family-friendly beach with a wide sandy shore and amenities for a perfect beach day. Great for tourists with kids or those seeking outdoor fun. | Coquina Beach, Coquina Beach Market, Fishing from the pier, Walking trails, Sunset viewing spots |
| Tampa Bay Area | Nearby metropolitan area that combines urban attractions with coastal fun. An option for guests who want both city life and beach relaxation. | Busch Gardens, Tampa Riverwalk, The Florida Aquarium, Ybor City, Tampa Bay History Center |
| Siesta Key | Famous for its powdery white sand beaches and vibrant nightlife. Ideal for younger travelers or families looking for a fun beach experience close to Anna Maria. | Siesta Beach, Siesta Key Village, Turtle Beach, Stand-Up Paddleboarding, Snorkeling |
| Sarasota | Cultural hub with art galleries, theaters, and beautiful beaches. Attracts tourists interested in art, culture, and leisure activities. | The Ringling Museum, Marie Selby Botanical Gardens, Sarasota Jungle Gardens, Lido Key Beach, St. Armands Circle |
Understanding Airbnb License Requirements & STR Laws in Anna Maria island (2026)
While Anna Maria island, Florida, United States currently shows low STR regulations, specific Airbnb license requirements might still exist or change. Always verify the latest short term rental regulations and Airbnb license requirements directly with local government authorities for Anna Maria island to ensure full compliance before hosting.
(Source: AirROI data, 2026, based on 0% licensed listings)
Top Performing Airbnb Properties in Anna Maria island (2026)
Benchmark your potential! Explore examples of top-performing Airbnb properties in Anna Maria islandbased on Trailing Twelve Month (TTM) revenue. Analyze their characteristics, revenue, occupancy rate, and ADR to understand what drives success in this market.

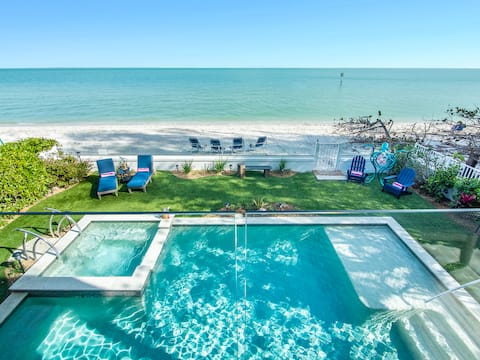
Luxury Private Pool/Spa, Rooftop, & Game Room!
Entire Place • 4 bedrooms

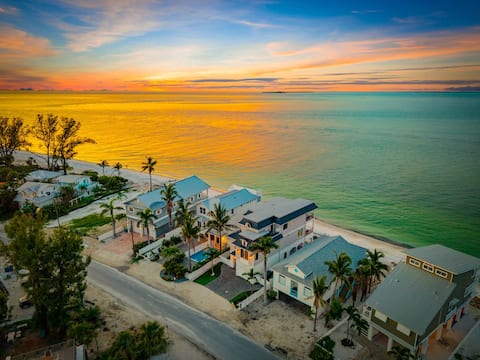
Kays Landing | Steps From Beach + Heated Pool/Spa
Entire Place • 6 bedrooms

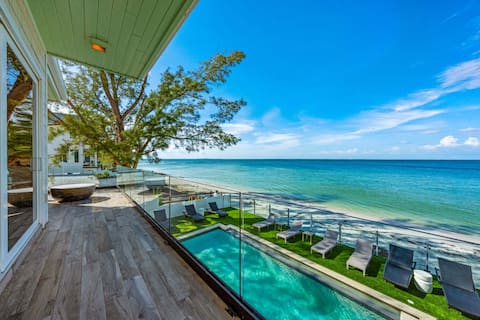
Luna Sea | Anna Maria Luxury Home Steps to Beach!
Entire Place • 5 bedrooms
No Tan Lines by Beach Boutique Rentals
Entire Place • 4 bedrooms
Serendipity Two
Entire Place • 4 bedrooms
Cloud 9 - BeachFront Splendor
Entire Place • 5 bedrooms
Note: Performance varies based on location, size, amenities, seasonality, and management quality. Data reflects the past 12 months.
Top Performing Airbnb Hosts in Anna Maria island (2026)
Learn from the best! This table showcases top-performing Airbnb hosts in Anna Maria island based on the number of properties managed and estimated total revenue over the past year. Analyze their scale and performance metrics.
| Host Name | Properties | Grossing Revenue | Stay Reviews | Avg Rating |
|---|---|---|---|---|
| AMI Locals And AMI Accommodati | 134 | $9,723,400 | 1655 | 4.68/5.0 |
| Sato Real Estate | 77 | $6,942,188 | 687 | 4.76/5.0 |
| Anna Maria Life | 58 | $5,608,788 | 383 | 4.83/5.0 |
| Beach Boutique Rentals | 26 | $4,517,682 | 1085 | 4.95/5.0 |
| Serendipity Anna Maria | 9 | $3,332,731 | 526 | 4.90/5.0 |
| The Cottages On The Key | 6 | $2,943,825 | 38 | 4.82/5.0 |
| Anna Maria Vacations | 30 | $2,896,251 | 384 | 4.65/5.0 |
| Duncan | 34 | $2,145,477 | 439 | 4.85/5.0 |
| Once Upon A Beach | 18 | $1,691,282 | 333 | 4.91/5.0 |
| Salty Mermaid Real Estate | 15 | $1,332,515 | 407 | 4.83/5.0 |
Analyzing the strategies of top hosts, such as their property selection, pricing, and guest communication, can offer valuable lessons for optimizing your own Airbnb operations in Anna Maria island.
Dive Deeper: Advanced Anna Maria island STR Market Data (2026)
Ready to unlock more insights? AirROI provides access to advanced metrics and comprehensive Airbnb data for Anna Maria island. Explore detailed analytics beyond this report to refine your investment strategy, optimize pricing, and maximize your vacation rental profits.
Explore Advanced MetricsAnna Maria island Short-Term Rental Market Composition (2026): Property & Room Types
Room Type Distribution
Property Type Distribution
Market Composition Insights for Anna Maria island
- The Anna Maria island Airbnb market composition is heavily skewed towards Entire Home/Apt listings, which make up 99.1% of the 587 active rentals. This indicates strong guest preference for privacy and space.
- Looking at the property type distribution in Anna Maria island, House properties are the most common (90.1%), reflecting the local real estate landscape.
- Houses represent a significant 90.1% portion, catering likely to families or larger groups.
- Smaller segments like hotel/boutique, outdoor/unique, others (combined 1.5%) offer potential for unique stay experiences.
Anna Maria island Airbnb Room Capacity Analysis (2026): Bedroom Distribution
Distribution of Listings by Number of Bedrooms
Room Capacity Insights for Anna Maria island
- The dominant room capacity in Anna Maria island is 3 bedrooms listings, making up 33% of the market. This suggests a strong demand for properties suitable for families or small groups.
- Together, 3 bedrooms and 4 bedrooms properties represent 62.6% of the active Airbnb listings in Anna Maria island, indicating a high concentration in these sizes.
- A significant 75.0% of listings offer 3+ bedrooms, catering to larger groups and families seeking more space in Anna Maria island.
Anna Maria island Vacation Rental Guest Capacity Trends (2026)
Distribution of Listings by Guest Capacity
Guest Capacity Insights for Anna Maria island
- The most common guest capacity trend in Anna Maria island vacation rentals is listings accommodating 8+ guests (57.6%). This suggests the primary traveler segment is likely larger groups.
- Properties designed for 8+ guests and 6 guests dominate the Anna Maria island STR market, accounting for 81.1% of listings.
- 82.5% of properties accommodate 6+ guests, serving the market segment for larger families or group travel in Anna Maria island.
- On average, properties in Anna Maria island are equipped to host 6.8 guests.
Anna Maria island Airbnb Booking Patterns (2026): Available vs. Booked Days
Available Days Distribution
Booked Days Distribution
Booking Pattern Insights for Anna Maria island
- The most common availability pattern in Anna Maria island falls within the 271-366 days range, representing 46.7% of listings. This suggests many properties have significant open periods on their calendars.
- Approximately 78.9% of listings show high availability (181+ days open annually), indicating potential for increased bookings or specific owner usage patterns.
- For booked days, the 91-180 days range is most frequent in Anna Maria island (32.7%), reflecting common guest stay durations or potential owner blocking patterns.
- A notable 22.0% of properties secure long booking periods (181+ days booked per year), highlighting successful long-term rental strategies or significant owner usage.
Anna Maria island Airbnb Minimum Stay Requirements Analysis
Distribution of Listings by Minimum Night Requirement
1 Night
9 listings
1.5% of total
2 Nights
15 listings
2.6% of total
3 Nights
21 listings
3.6% of total
4-6 Nights
184 listings
31.3% of total
7-29 Nights
21 listings
3.6% of total
30+ Nights
337 listings
57.4% of total
Key Insights
- The most prevalent minimum stay requirement in Anna Maria island is 30+ Nights, adopted by 57.4% of listings. This highlights the market's preference for longer commitments.
- Very short stays (1-2 nights) are less common (4.1%), suggesting hosts prefer slightly longer bookings to optimize turnover.
- A significant segment (57.4%) caters to monthly stays (30+ nights) in Anna Maria island, pointing to opportunities in the extended-stay market.
Recommendations
- Align with the market by considering a 30+ Nights minimum stay, as 57.4% of Anna Maria island hosts use this setting.
- If feasible, allowing 1-night stays, especially midweek or during low season, could capture last-minute bookings, as only 1.5% currently do.
- Explore offering discounts for stays of 30+ nights to attract the 57.4% of the market seeking extended stays.
- Adjust minimum nights based on seasonality – potentially shorter during low season and longer during peak demand periods in Anna Maria island.
Anna Maria island Airbnb Cancellation Policy Trends Analysis (2026)
Limited
9 listings
1.5% of total
Super Strict 30 Days
245 listings
42% of total
Super Strict 60 Days
107 listings
18.3% of total
Flexible
2 listings
0.3% of total
Moderate
56 listings
9.6% of total
Firm
83 listings
14.2% of total
Strict
82 listings
14% of total
Cancellation Policy Insights for Anna Maria island
- The prevailing Airbnb cancellation policy trend in Anna Maria island is Super Strict 30 Days, used by 42% of listings.
- There's a relatively balanced mix between guest-friendly (9.9%) and stricter (28.2%) policies, offering choices for different guest needs.
Recommendations for Hosts
- Consider adopting a Super Strict 30 Days policy to align with the 42% market standard in Anna Maria island.
- Using a Strict policy might deter some guests, as only 14% of listings use it. Evaluate if potential revenue protection outweighs possible lower booking rates.
- Regularly review your cancellation policy against competitors and market demand shifts in Anna Maria island.
Anna Maria island STR Booking Lead Time Analysis (2026)
Average Booking Lead Time by Month
Booking Lead Time Insights for Anna Maria island
- The overall average booking lead time for vacation rentals in Anna Maria island is 96 days.
- Guests book furthest in advance for stays during April (average 117 days), likely coinciding with peak travel demand or local events.
- The shortest booking windows occur for stays in August (average 67 days), indicating more last-minute travel plans during this time.
- Seasonally, Spring (110 days avg.) sees the longest lead times, while Summer (70 days avg.) has the shortest, reflecting typical travel planning cycles.
Recommendations for Hosts
- Use the overall average lead time (96 days) as a baseline for your pricing and availability strategy in Anna Maria island.
- For April stays, consider implementing length-of-stay discounts or slightly higher rates for bookings made less than 117 days out to capitalize on advance planning.
- Target marketing efforts for the Spring season well in advance (at least 110 days) to capture early planners.
- Monitor your own booking lead times against these Anna Maria island averages to identify opportunities for dynamic pricing adjustments.
Popular & Essential Airbnb Amenities in Anna Maria island (2026)
Amenity Prevalence
Amenity Insights for Anna Maria island
- Essential amenities in Anna Maria island that guests expect include: Air conditioning, Smoke alarm, Wifi, TV, Kitchen, Hair dryer, Washer, Refrigerator, Free parking on premises, Dryer. Lacking these (any) could significantly impact bookings.
Recommendations for Hosts
- Ensure your listing includes all essential amenities for Anna Maria island: Air conditioning, Smoke alarm, Wifi, TV, Kitchen, Hair dryer, Washer, Refrigerator, Free parking on premises, Dryer.
- Prioritize adding missing essentials: Smoke alarm, Wifi, TV, Kitchen, Hair dryer, Washer, Refrigerator, Free parking on premises, Dryer.
- Highlight unique or less common amenities you offer (e.g., hot tub, dedicated workspace, EV charger) in your listing description and photos.
- Regularly check competitor amenities in Anna Maria island to stay competitive.
Anna Maria island Airbnb Guest Demographics & Profile Analysis (2026)
Guest Profile Summary for Anna Maria island
- The typical guest profile for Airbnb in Anna Maria island consists of primarily domestic travelers (95%), often arriving from nearby Tampa, typically belonging to the Post-2000s (Gen Z/Alpha) group (50%), primarily speaking English or Spanish.
- Domestic travelers account for 95.0% of guests.
- Key international markets include United States (95%) and United Kingdom (1.8%).
- Top languages spoken are English (69.3%) followed by Spanish (21.3%).
- A significant demographic segment is the Post-2000s (Gen Z/Alpha) group, representing 50% of guests.
Recommendations for Hosts
- Target domestic marketing efforts towards travelers from Tampa and Orlando.
- Tailor amenities and listing descriptions to appeal to the dominant Post-2000s (Gen Z/Alpha) demographic (e.g., highlight fast WiFi, smart home features, local guides).
- Highlight unique local experiences or amenities relevant to the primary guest profile.
- Consider seasonal promotions aligned with peak travel times for key origin markets.
Nearby Short-Term Rental Market Comparison
How does the Anna Maria island Airbnb market stack up against its neighbors? Compare key performance metrics like average monthly revenue, ADR, and occupancy rates in surrounding areas to understand the broader regional STR landscape.
| Market | Active Properties | Monthly Revenue | Daily Rate | Avg. Occupancy |
|---|---|---|---|---|
| Anna Maria | 56 | $6,434 | $692.96 | 52% |
| Reunion | 12 | $6,321 | $580.45 | 44% |
| Boca Grande | 31 | $6,128 | $787.07 | 37% |
| Indian Rocks Beach | 842 | $5,560 | $419.63 | 49% |
| Captiva | 291 | $5,443 | $667.40 | 36% |
| Siesta Key | 1,175 | $5,206 | $518.91 | 42% |
| Belleair Beach | 94 | $5,086 | $339.65 | 53% |
| Bradenton Beach | 122 | $4,977 | $507.12 | 42% |
| Thonotosassa | 17 | $4,309 | $347.75 | 50% |
| Seminole | 519 | $4,223 | $316.69 | 52% |