Sussex County Airbnb Market Analysis 2026: Short Term Rental Data & Vacation Rental Statistics in Delaware, United States
Is Airbnb profitable in Sussex County in 2026? Explore comprehensive Airbnb analytics for Sussex County, Delaware, United States to uncover income potential. This 2026 STR market report for Sussex County, based on AirROI data from February 2025 to January 2026, reveals key trends in the niche market of 56 active listings.
Whether you're considering an Airbnb investment in Sussex County, optimizing your existing vacation rental, or exploring rental arbitrage opportunities, understanding the Sussex County Airbnb data is crucial. Leveraging the low regulation environment is key to maximizing your short term rental income potential. Let's dive into the specifics.
Key Sussex County Airbnb Performance Metrics Overview
Monthly Airbnb Revenue Variations & Income Potential in Sussex County (2026)
Understanding the monthly revenue variations for Airbnb listings in Sussex County is key to maximizing your short term rental income potential. Seasonality significantly impacts earnings. Our analysis, based on data from the past 12 months, shows that the peak revenue month for STRs in Sussex County is typically July, while February often presents the lowest earnings, highlighting opportunities for strategic pricing adjustments during shoulder and low seasons. Explore the typical Airbnb income in Sussex County across different performance tiers:
- Best-in-class properties (Top 10%) achieve $4,300+ monthly, often utilizing dynamic pricing and superior guest experiences.
- Strong performing properties (Top 25%) earn $3,250 or more, indicating effective management and desirable locations/amenities.
- Typical properties (Median) generate around $1,715 per month, representing the average market performance.
- Entry-level properties (Bottom 25%) see earnings around $990, often with potential for optimization.
Average Monthly Airbnb Earnings Trend in Sussex County
Sussex County Airbnb Occupancy Rate Trends (2026)
Maximize your bookings by understanding the Sussex County STR occupancy trends. Seasonal demand shifts significantly influence how often properties are booked. Typically, Julysees the highest demand (peak season occupancy), while December experiences the lowest (low season). Effective strategies, like adjusting minimum stays or offering promotions, can boost occupancy during slower periods. Here's how different property tiers perform in Sussex County:
- Best-in-class properties (Top 10%) achieve 50%+ occupancy, indicating high desirability and potentially optimized availability.
- Strong performing properties (Top 25%) maintain 37% or higher occupancy, suggesting good market fit and guest satisfaction.
- Typical properties (Median) have an occupancy rate around 20%.
- Entry-level properties (Bottom 25%) average 10% occupancy, potentially facing higher vacancy.
Average Monthly Occupancy Rate Trend in Sussex County
Average Daily Rate (ADR) Airbnb Trends in Sussex County (2026)
Effective short term rental pricing strategy in Sussex County involves understanding monthly ADR fluctuations. The Average Daily Rate (ADR) for Airbnb in Sussex County typically peaks in August and dips lowest during February. Leveraging Airbnb dynamic pricing tools or strategies based on this seasonality can significantly boost revenue. Here's a look at the typical nightly rates achieved:
- Best-in-class properties (Top 10%) command rates of $563+ per night, often due to premium features or locations.
- Strong performing properties (Top 25%) achieve nightly rates of $422 or more.
- Typical properties (Median) charge around $311 per night.
- Entry-level properties (Bottom 25%) earn around $232 per night.
Average Daily Rate (ADR) Trend by Month in Sussex County
Get Live Sussex County Market Intelligence 👇

Explore Real-time Analytics
Airbnb Seasonality Analysis & Trends in Sussex County (2026)
Peak Season (July, August, June)
- Revenue averages $4,850 per month
- Occupancy rates average 42.6%
- Daily rates average $446
Shoulder Season
- Revenue averages $1,664 per month
- Occupancy maintains around 22.1%
- Daily rates hold near $325
Low Season (February, March, December)
- Revenue drops to average $1,008 per month
- Occupancy decreases to average 13.8%
- Daily rates adjust to average $307
Seasonality Insights for Sussex County
- The Airbnb seasonality in Sussex County shows highly seasonal trends requiring careful strategy. While the sections above show seasonal averages, it's also insightful to look at the extremes:
- During the high season, the absolute peak month showcases Sussex County's highest earning potential, with monthly revenues capable of climbing to $5,853, occupancy reaching a high of 48.2%, and ADRs peaking at $469.
- Conversely, the slowest single month of the year, typically falling within the low season, marks the market's lowest point. In this month, revenue might dip to $871, occupancy could drop to 10.5%, and ADRs may adjust down to $281.
- Understanding both the seasonal averages and these monthly peaks and troughs in revenue, occupancy, and ADR is crucial for maximizing your Airbnb profit potential in Sussex County.
Seasonal Strategies for Maximizing Profit
- Peak Season: Maximize revenue through premium pricing and potentially longer minimum stays. Ensure high availability.
- Low Season: Offer competitive pricing, special promotions (e.g., extended stay discounts), and flexible cancellation policies. Target off-season travelers like remote workers or budget-conscious guests.
- Shoulder Seasons: Implement dynamic pricing that balances peak and low rates. Target weekend travelers or specific events. Offer slightly more flexible terms than peak season.
- Regularly analyze your own performance against these Sussex County seasonality benchmarks and adjust your pricing and availability strategy accordingly.
Best Areas for Airbnb Investment in Sussex County (2026)
Exploring the top neighborhoods for short-term rentals in Sussex County? This section highlights key areas, outlining why they are attractive for hosts and guests, along with notable local attractions. Consider these locations based on your target guest profile and investment strategy.
| Neighborhood / Area | Why Host Here? (Target Guests & Appeal) | Key Attractions & Landmarks |
|---|---|---|
| Rehoboth Beach | Popular seaside resort town known for its beautiful beaches, boardwalk, and vibrant nightlife. Attracts families and beachgoers during the summer months, making it a prime location for vacation rentals. | Rehoboth Beach Boardwalk, Funland, Rehoboth Beach, Cape Henlopen State Park, Jungle Jim's Water Park |
| Bethany Beach | Charming small beach town with a family-friendly atmosphere. Known for its peaceful beaches, quaint shopping, and outdoor activities, making it appealing for families and couples. | Bethany Beach Boardwalk, Bethany Beach Nature Center, South Bethany Beach, Fresh Pond State Park |
| Lewes | Historic town with rich heritage and close proximity to beaches. Offers a quaint downtown area and is known for its scenic beauty, appealing to those looking for a more relaxed beach experience. | Cape May-Lewes Ferry, Lewes Historical Society, Cape Henlopen State Park, Lewes Beach, Zwaanendael Museum |
| Fenwick Island | Quiet beach community ideal for families and those looking for a more laid-back vacation. Offers easy access to both ocean and bay activities. | Fenwick Island State Park, Thunder Lagoon Waterpark, Bayside Resort Golf Club |
| Laurel | A small town with charm, offering a mix of natural beauty and local culture. Attractive for those seeking more affordable vacation rentals away from the busy beach towns. | Laurel Train Depot, Trap Pond State Park, Cypress Swamp, Dagsboro |
| Milford | A quaint, historic town along the Mispillion River, known for its charming downtown and local businesses. Offers a unique experience with potential for growth in tourism. | Milford Museum, Mispillion Riverwalk, Historical Society of Milford |
| Dewey Beach | Known for its lively beach atmosphere and nightlife, making it popular among younger crowds. Ideal for investors looking to attract party-goers and summer vacationers. | Dewey Beach, Dewey Beach Lifesaving Station Museum, Starboard |
| Selbyville | A quiet town close to the beach yet away from the hustle and bustle. A great option for those seeking peace while still being close to attractions. | Bayside Resort Golf Club, Assawoman Bay, Local dining options |
Understanding Airbnb License Requirements & STR Laws in Sussex County (2026)
While Sussex County, Delaware, United States currently shows low STR regulations, specific Airbnb license requirements might still exist or change. Always verify the latest short term rental regulations and Airbnb license requirements directly with local government authorities for Sussex County to ensure full compliance before hosting.
(Source: AirROI data, 2026, finding no licensed listings among those analyzed)
Top Performing Airbnb Properties in Sussex County (2026)
Benchmark your potential! Explore examples of top-performing Airbnb properties in Sussex Countybased on Trailing Twelve Month (TTM) revenue. Analyze their characteristics, revenue, occupancy rate, and ADR to understand what drives success in this market.
Rehoboth Beach Vacation Rentals, New 7BR Luxury Be
Entire Place • 7 bedrooms
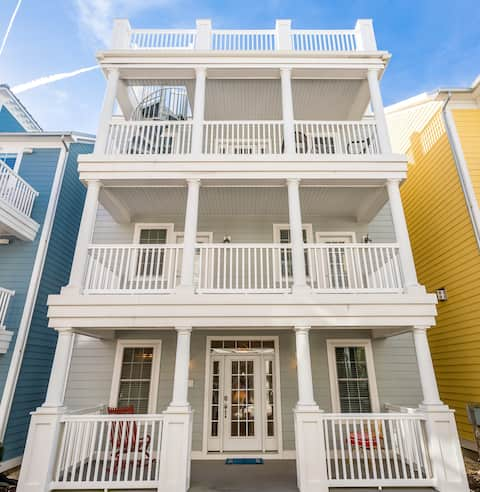
Beautiful 3 Story Ocean-Block Home for Rent
Entire Place • 5 bedrooms
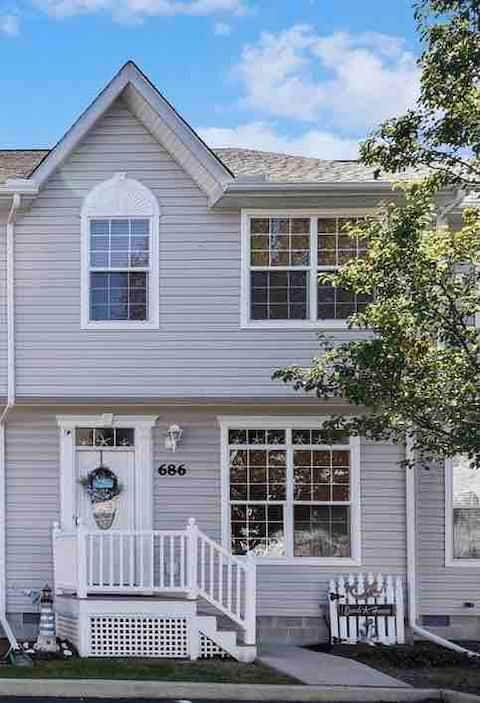
Starfish Wish Bethany Beach Rental
Entire Place • 3 bedrooms

Beach House on bay with dock
Entire Place • 3 bedrooms
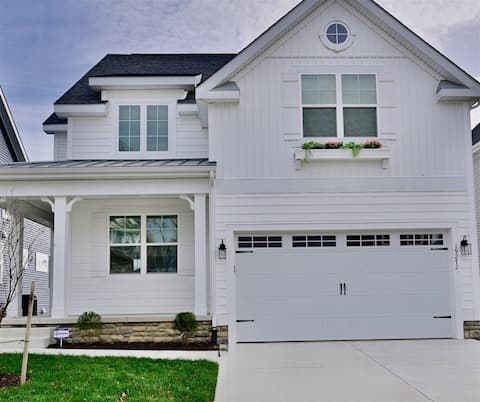
Private Cottage * 1 bedroom+loft * Rehoboth Beach
Entire Place • 1 bedroom
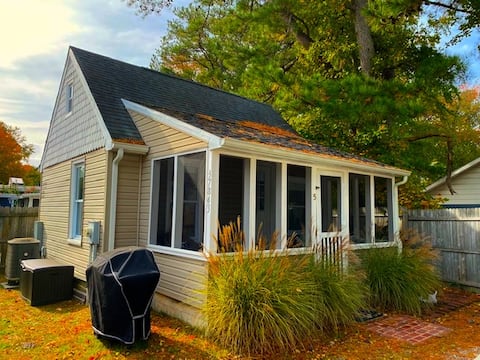
NEW! Pet-Friendly! Large 3-bedroom, 2.5 bath home!
Entire Place • 3 bedrooms
Note: Performance varies based on location, size, amenities, seasonality, and management quality. Data reflects the past 12 months.
Top Performing Airbnb Hosts in Sussex County (2026)
Learn from the best! This table showcases top-performing Airbnb hosts in Sussex County based on the number of properties managed and estimated total revenue over the past year. Analyze their scale and performance metrics.
| Host Name | Properties | Grossing Revenue | Stay Reviews | Avg Rating |
|---|---|---|---|---|
| Steve | 3 | $88,292 | 19 | 4.80/5.0 |
| Vacasa Delaware | 19 | $81,066 | 249 | 4.50/5.0 |
| Vacasa Bethany Beach | 11 | $60,478 | 93 | 4.67/5.0 |
| Kirsten | 1 | $37,757 | 6 | 5.00/5.0 |
| Chris | 1 | $37,678 | 50 | 4.90/5.0 |
| Pamela | 1 | $36,264 | 17 | 4.94/5.0 |
| Cleopatra | 1 | $32,700 | 132 | 4.97/5.0 |
| Robby | 1 | $32,230 | 8 | 5.00/5.0 |
| DEL 302 Management | 1 | $29,867 | 10 | 5.00/5.0 |
| Caroline | 1 | $28,965 | 197 | 4.92/5.0 |
Analyzing the strategies of top hosts, such as their property selection, pricing, and guest communication, can offer valuable lessons for optimizing your own Airbnb operations in Sussex County.
Dive Deeper: Advanced Sussex County STR Market Data (2026)
Ready to unlock more insights? AirROI provides access to advanced metrics and comprehensive Airbnb data for Sussex County. Explore detailed analytics beyond this report to refine your investment strategy, optimize pricing, and maximize your vacation rental profits.
Explore Advanced MetricsSussex County Short-Term Rental Market Composition (2026): Property & Room Types
Room Type Distribution
Property Type Distribution
Market Composition Insights for Sussex County
- The Sussex County Airbnb market composition is heavily skewed towards Entire Home/Apt listings, which make up 100% of the 56 active rentals. This indicates strong guest preference for privacy and space.
- Looking at the property type distribution in Sussex County, Apartment/Condo properties are the most common (69.6%), reflecting the local real estate landscape.
- Houses represent a significant 28.6% portion, catering likely to families or larger groups.
- Smaller segments like outdoor/unique (combined 1.8%) offer potential for unique stay experiences.
Sussex County Airbnb Room Capacity Analysis (2026): Bedroom Distribution
Distribution of Listings by Number of Bedrooms
Room Capacity Insights for Sussex County
- The dominant room capacity in Sussex County is 3 bedrooms listings, making up 33.9% of the market. This suggests a strong demand for properties suitable for families or small groups.
- Together, 3 bedrooms and 2 bedrooms properties represent 66.0% of the active Airbnb listings in Sussex County, indicating a high concentration in these sizes.
- A significant 44.6% of listings offer 3+ bedrooms, catering to larger groups and families seeking more space in Sussex County.
Sussex County Vacation Rental Guest Capacity Trends (2026)
Distribution of Listings by Guest Capacity
Guest Capacity Insights for Sussex County
- The most common guest capacity trend in Sussex County vacation rentals is listings accommodating 8+ guests (48.2%). This suggests the primary traveler segment is likely larger groups.
- Properties designed for 8+ guests and 6 guests dominate the Sussex County STR market, accounting for 69.6% of listings.
- 75.0% of properties accommodate 6+ guests, serving the market segment for larger families or group travel in Sussex County.
- On average, properties in Sussex County are equipped to host 6.4 guests.
Sussex County Airbnb Booking Patterns (2026): Available vs. Booked Days
Available Days Distribution
Booked Days Distribution
Booking Pattern Insights for Sussex County
- The most common availability pattern in Sussex County falls within the 271-366 days range, representing 80.4% of listings. This suggests many properties have significant open periods on their calendars.
- Approximately 100.0% of listings show high availability (181+ days open annually), indicating potential for increased bookings or specific owner usage patterns.
- For booked days, the 1-30 days range is most frequent in Sussex County (62.5%), reflecting common guest stay durations or potential owner blocking patterns.
Sussex County Airbnb Minimum Stay Requirements Analysis
Distribution of Listings by Minimum Night Requirement
2 Nights
17 listings
30.4% of total
3 Nights
13 listings
23.2% of total
4-6 Nights
8 listings
14.3% of total
7-29 Nights
4 listings
7.1% of total
30+ Nights
14 listings
25% of total
Key Insights
- The most prevalent minimum stay requirement in Sussex County is 2 Nights, adopted by 30.4% of listings. This highlights the market's preference for shorter, flexible bookings.
- A significant segment (25%) caters to monthly stays (30+ nights) in Sussex County, pointing to opportunities in the extended-stay market.
Recommendations
- Align with the market by considering a 2 Nights minimum stay, as 30.4% of Sussex County hosts use this setting.
- A 2-night minimum appears standard (30.4%). Consider this for weekends or peak periods.
- Explore offering discounts for stays of 30+ nights to attract the 25% of the market seeking extended stays.
- Adjust minimum nights based on seasonality – potentially shorter during low season and longer during peak demand periods in Sussex County.
Sussex County Airbnb Cancellation Policy Trends Analysis (2026)
Super Strict 30 Days
1 listings
1.8% of total
Super Strict 60 Days
37 listings
66.1% of total
Flexible
1 listings
1.8% of total
Moderate
2 listings
3.6% of total
Firm
10 listings
17.9% of total
Strict
5 listings
8.9% of total
Cancellation Policy Insights for Sussex County
- The prevailing Airbnb cancellation policy trend in Sussex County is Super Strict 60 Days, used by 66.1% of listings.
- There's a relatively balanced mix between guest-friendly (5.4%) and stricter (26.8%) policies, offering choices for different guest needs.
- Strict cancellation policies are quite rare (8.9%), potentially making listings with this policy less competitive unless justified by high demand or property type.
Recommendations for Hosts
- Consider adopting a Super Strict 60 Days policy to align with the 66.1% market standard in Sussex County.
- Using a Strict policy might deter some guests, as only 8.9% of listings use it. Evaluate if potential revenue protection outweighs possible lower booking rates.
- Regularly review your cancellation policy against competitors and market demand shifts in Sussex County.
Sussex County STR Booking Lead Time Analysis (2026)
Average Booking Lead Time by Month
Booking Lead Time Insights for Sussex County
- The overall average booking lead time for vacation rentals in Sussex County is 61 days.
- Guests book furthest in advance for stays during July (average 94 days), likely coinciding with peak travel demand or local events.
- The shortest booking windows occur for stays in January (average 7 days), indicating more last-minute travel plans during this time.
- Seasonally, Summer (83 days avg.) sees the longest lead times, while Winter (11 days avg.) has the shortest, reflecting typical travel planning cycles.
Recommendations for Hosts
- Use the overall average lead time (61 days) as a baseline for your pricing and availability strategy in Sussex County.
- For July stays, consider implementing length-of-stay discounts or slightly higher rates for bookings made less than 94 days out to capitalize on advance planning.
- During January, focus on last-minute booking availability and promotions, as guests book with very short notice (7 days avg.).
- Target marketing efforts for the Summer season well in advance (at least 83 days) to capture early planners.
- Monitor your own booking lead times against these Sussex County averages to identify opportunities for dynamic pricing adjustments.
Popular & Essential Airbnb Amenities in Sussex County (2026)
Amenity Prevalence
Amenity Insights for Sussex County
- Essential amenities in Sussex County that guests expect include: Smoke alarm, TV, Wifi, Air conditioning, Kitchen, Washer, Dishes and silverware, Dryer, Hot water. Lacking these (any) could significantly impact bookings.
- Popular amenities like Refrigerator are common but not universal. Offering these can provide a competitive edge.
Recommendations for Hosts
- Ensure your listing includes all essential amenities for Sussex County: Smoke alarm, TV, Wifi, Air conditioning, Kitchen, Washer, Dishes and silverware, Dryer, Hot water.
- Prioritize adding missing essentials: Kitchen, Washer, Dishes and silverware, Dryer, Hot water.
- Consider adding popular differentiators like Refrigerator to increase appeal.
- Highlight unique or less common amenities you offer (e.g., hot tub, dedicated workspace, EV charger) in your listing description and photos.
- Regularly check competitor amenities in Sussex County to stay competitive.
Sussex County Airbnb Guest Demographics & Profile Analysis (2026)
Guest Profile Summary for Sussex County
- The typical guest profile for Airbnb in Sussex County consists of primarily domestic travelers (93%), often arriving from nearby Baltimore, typically belonging to the Post-2000s (Gen Z/Alpha) group (50%), primarily speaking English or Spanish.
- Domestic travelers account for 92.5% of guests.
- Key international markets include United States (92.5%) and DC (4.8%).
- Top languages spoken are English (72.9%) followed by Spanish (13.6%).
- A significant demographic segment is the Post-2000s (Gen Z/Alpha) group, representing 50% of guests.
Recommendations for Hosts
- Target domestic marketing efforts towards travelers from Baltimore and Washington.
- Tailor amenities and listing descriptions to appeal to the dominant Post-2000s (Gen Z/Alpha) demographic (e.g., highlight fast WiFi, smart home features, local guides).
- Highlight unique local experiences or amenities relevant to the primary guest profile.
- Consider seasonal promotions aligned with peak travel times for key origin markets.
Nearby Short-Term Rental Market Comparison
How does the Sussex County Airbnb market stack up against its neighbors? Compare key performance metrics like average monthly revenue, ADR, and occupancy rates in surrounding areas to understand the broader regional STR landscape.
| Market | Active Properties | Monthly Revenue | Daily Rate | Avg. Occupancy |
|---|---|---|---|---|
| Centreville | 17 | $6,298 | $565.66 | 45% |
| Mayo | 13 | $5,915 | $447.58 | 51% |
| Cape May Point | 23 | $5,479 | $542.19 | 46% |
| Stone Harbor | 42 | $5,467 | $785.22 | 39% |
| Stevensville | 80 | $5,412 | $556.79 | 41% |
| Weems | 11 | $5,077 | $417.22 | 47% |
| Lower Windsor Township | 14 | $5,062 | $428.71 | 45% |
| Arundel on the Bay | 29 | $5,043 | $486.96 | 40% |
| Cape May | 334 | $5,029 | $553.79 | 42% |
| Surf City | 47 | $5,004 | $715.29 | 44% |