Bowers Airbnb Market Analysis 2026: Short Term Rental Data & Vacation Rental Statistics in Delaware, United States
Is Airbnb profitable in Bowers in 2026? Explore comprehensive Airbnb analytics for Bowers, Delaware, United States to uncover income potential. This 2026 STR market report for Bowers, based on AirROI data from February 2025 to January 2026, reveals key trends in the niche market of 19 active listings.
Whether you're considering an Airbnb investment in Bowers, optimizing your existing vacation rental, or exploring rental arbitrage opportunities, understanding the Bowers Airbnb data is crucial. Leveraging the low regulation environment is key to maximizing your short term rental income potential. Let's dive into the specifics.
Key Bowers Airbnb Performance Metrics Overview
Monthly Airbnb Revenue Variations & Income Potential in Bowers (2026)
Understanding the monthly revenue variations for Airbnb listings in Bowers is key to maximizing your short term rental income potential. Seasonality significantly impacts earnings. Our analysis, based on data from the past 12 months, shows that the peak revenue month for STRs in Bowers is typically July, while January often presents the lowest earnings, highlighting opportunities for strategic pricing adjustments during shoulder and low seasons. Explore the typical Airbnb income in Bowers across different performance tiers:
- Best-in-class properties (Top 10%) achieve $8,212+ monthly, often utilizing dynamic pricing and superior guest experiences.
- Strong performing properties (Top 25%) earn $5,130 or more, indicating effective management and desirable locations/amenities.
- Typical properties (Median) generate around $3,314 per month, representing the average market performance.
- Entry-level properties (Bottom 25%) see earnings around $1,802, often with potential for optimization.
Average Monthly Airbnb Earnings Trend in Bowers
Bowers Airbnb Occupancy Rate Trends (2026)
Maximize your bookings by understanding the Bowers STR occupancy trends. Seasonal demand shifts significantly influence how often properties are booked. Typically, Julysees the highest demand (peak season occupancy), while January experiences the lowest (low season). Effective strategies, like adjusting minimum stays or offering promotions, can boost occupancy during slower periods. Here's how different property tiers perform in Bowers:
- Best-in-class properties (Top 10%) achieve 70%+ occupancy, indicating high desirability and potentially optimized availability.
- Strong performing properties (Top 25%) maintain 51% or higher occupancy, suggesting good market fit and guest satisfaction.
- Typical properties (Median) have an occupancy rate around 37%.
- Entry-level properties (Bottom 25%) average 24% occupancy, potentially facing higher vacancy.
Average Monthly Occupancy Rate Trend in Bowers
Average Daily Rate (ADR) Airbnb Trends in Bowers (2026)
Effective short term rental pricing strategy in Bowers involves understanding monthly ADR fluctuations. The Average Daily Rate (ADR) for Airbnb in Bowers typically peaks in August and dips lowest during April. Leveraging Airbnb dynamic pricing tools or strategies based on this seasonality can significantly boost revenue. Here's a look at the typical nightly rates achieved:
- Best-in-class properties (Top 10%) command rates of $475+ per night, often due to premium features or locations.
- Strong performing properties (Top 25%) achieve nightly rates of $347 or more.
- Typical properties (Median) charge around $245 per night.
- Entry-level properties (Bottom 25%) earn around $192 per night.
Average Daily Rate (ADR) Trend by Month in Bowers
Get Live Bowers Market Intelligence 👇

Explore Real-time Analytics
Airbnb Seasonality Analysis & Trends in Bowers (2026)
Peak Season (July, June, August)
- Revenue averages $6,542 per month
- Occupancy rates average 62.9%
- Daily rates average $320
Shoulder Season
- Revenue averages $3,283 per month
- Occupancy maintains around 35.4%
- Daily rates hold near $299
Low Season (January, April, December)
- Revenue drops to average $2,487 per month
- Occupancy decreases to average 23.8%
- Daily rates adjust to average $303
Seasonality Insights for Bowers
- The Airbnb seasonality in Bowers shows highly seasonal trends requiring careful strategy. While the sections above show seasonal averages, it's also insightful to look at the extremes:
- During the high season, the absolute peak month showcases Bowers's highest earning potential, with monthly revenues capable of climbing to $7,340, occupancy reaching a high of 69.1%, and ADRs peaking at $327.
- Conversely, the slowest single month of the year, typically falling within the low season, marks the market's lowest point. In this month, revenue might dip to $1,862, occupancy could drop to 15.3%, and ADRs may adjust down to $277.
- Understanding both the seasonal averages and these monthly peaks and troughs in revenue, occupancy, and ADR is crucial for maximizing your Airbnb profit potential in Bowers.
Seasonal Strategies for Maximizing Profit
- Peak Season: Maximize revenue through premium pricing and potentially longer minimum stays. Ensure high availability.
- Low Season: Offer competitive pricing, special promotions (e.g., extended stay discounts), and flexible cancellation policies. Target off-season travelers like remote workers or budget-conscious guests.
- Shoulder Seasons: Implement dynamic pricing that balances peak and low rates. Target weekend travelers or specific events. Offer slightly more flexible terms than peak season.
- Regularly analyze your own performance against these Bowers seasonality benchmarks and adjust your pricing and availability strategy accordingly.
Best Areas for Airbnb Investment in Bowers (2026)
Exploring the top neighborhoods for short-term rentals in Bowers? This section highlights key areas, outlining why they are attractive for hosts and guests, along with notable local attractions. Consider these locations based on your target guest profile and investment strategy.
| Neighborhood / Area | Why Host Here? (Target Guests & Appeal) | Key Attractions & Landmarks |
|---|---|---|
| Rehoboth Beach | A popular coastal town known for its stunning beaches, boardwalk, and vibrant summer events. Ideal for family vacations and beach-goers looking for a fun escape. | Rehoboth Beach Boardwalk, Funland Amusement Park, Rehoboth Beach State Park, Jungle Jim's, Cape Henlopen State Park |
| Bethany Beach | Known for its relaxed family-friendly atmosphere and beautiful beaches. Attracts visitors looking for a peaceful getaway with plenty of outdoor activities. | Bethany Beach Boardwalk, Bethany Beach Nature Center, Freeman Stage, John West Park, Gordons Pond State Park |
| Dewey Beach | A lively beach town famous for its nightlife, water sports, and music festivals. A hotspot for younger crowds and those seeking a vibrant beach scene. | Dewey Beach, Bottle & Cork, Mama Mia's, Marina District, Rehoboth Bay |
| Lewes | A charming historic town offering a mix of history and scenic beaches. Popular with those interested in history, shopping, and quiet beach experiences. | Cape May-Lewes Ferry, Lewes Beach, Delaware Breakwater Lighthouse, Zwaanendael Museum, Dogfish Head Craft Brewery |
| Milford | A quaint town with community charm, close to both beaches and nature parks. Great for visitors looking for a balance of outdoor activities and small-town feel. | Mispillion Riverwalk, Milford Museum, Bombay Hook National Wildlife Refuge, Silver Lake Park, Local shops and restaurants |
| Fenwick Island | A quieter coastal area perfect for families looking to relax and enjoy the beach without the crowded atmosphere of other beach towns. | Fenwick Island State Park, Thunder Lagoon Waterpark, Fenwick Boardwalk, Local seafood restaurants, Water sports activities |
| Newark | A vibrant college town with a mix of history and youthful energy, attracting visitors for events, sports, and university activities. | University of Delaware, Newark History Museum, Pencader Heritage Area, White Clay Creek State Park, Local eateries and bars |
| Smyrna | A small town with a growing community and proximity to both Wilmington and the beaches, making it a unique lodging option for diverse travelers. | Smyrna Rest Area, Second Street Players, Smyrna Historical Society, Local parks and recreation areas, Craft breweries nearby |
Understanding Airbnb License Requirements & STR Laws in Bowers (2026)
While Bowers, Delaware, United States currently shows low STR regulations, specific Airbnb license requirements might still exist or change. Always verify the latest short term rental regulations and Airbnb license requirements directly with local government authorities for Bowers to ensure full compliance before hosting.
(Source: AirROI data, 2026, finding no licensed listings among those analyzed)
Top Performing Airbnb Properties in Bowers (2026)
Benchmark your potential! Explore examples of top-performing Airbnb properties in Bowersbased on Trailing Twelve Month (TTM) revenue. Analyze their characteristics, revenue, occupancy rate, and ADR to understand what drives success in this market.

Luxury Stay EV Charger~ DE Turf~Dover Raceway~ABB
Entire Place • 3 bedrooms

Bowers Retreat - Sleeps 10 - Steps to beach & bars
Entire Place • 3 bedrooms
Escape to Bowers Beach (Near Dover and DE Turf)
Entire Place • 4 bedrooms

Serene Setting in Bowers Beach
Entire Place • 4 bedrooms
The Lazy Seagull. Minutes to DE Turf fields.
Entire Place • 4 bedrooms
Bowers Beach - pets ok - low cleaning fee
Entire Place • 2 bedrooms
Note: Performance varies based on location, size, amenities, seasonality, and management quality. Data reflects the past 12 months.
Top Performing Airbnb Hosts in Bowers (2026)
Learn from the best! This table showcases top-performing Airbnb hosts in Bowers based on the number of properties managed and estimated total revenue over the past year. Analyze their scale and performance metrics.
| Host Name | Properties | Grossing Revenue | Stay Reviews | Avg Rating |
|---|---|---|---|---|
| Diana | 1 | $102,606 | 25 | 5.00/5.0 |
| Scott | 1 | $73,736 | 56 | 4.93/5.0 |
| Maria | 1 | $59,384 | 23 | 4.96/5.0 |
| Kristen | 1 | $57,722 | 26 | 4.96/5.0 |
| Brenda | 1 | $47,936 | 53 | 4.83/5.0 |
| Joe | 2 | $47,631 | 117 | 4.83/5.0 |
| Tara | 1 | $40,806 | 342 | 4.92/5.0 |
| Evolve | 1 | $39,667 | 22 | 4.68/5.0 |
| Sierra | 1 | $36,979 | 71 | 4.93/5.0 |
| Joan Eve Cassidy | 1 | $36,833 | 74 | 4.96/5.0 |
Analyzing the strategies of top hosts, such as their property selection, pricing, and guest communication, can offer valuable lessons for optimizing your own Airbnb operations in Bowers.
Dive Deeper: Advanced Bowers STR Market Data (2026)
Ready to unlock more insights? AirROI provides access to advanced metrics and comprehensive Airbnb data for Bowers. Explore detailed analytics beyond this report to refine your investment strategy, optimize pricing, and maximize your vacation rental profits.
Explore Advanced MetricsBowers Short-Term Rental Market Composition (2026): Property & Room Types
Room Type Distribution
Property Type Distribution
Market Composition Insights for Bowers
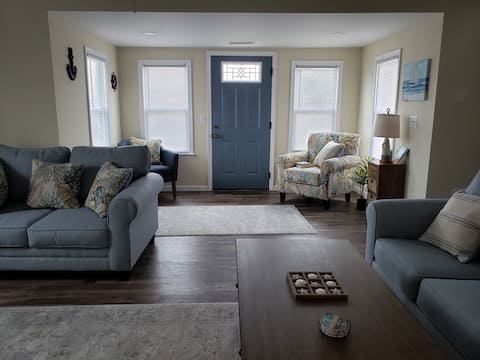
- The Bowers Airbnb market composition is heavily skewed towards Entire Home/Apt listings, which make up 100% of the 19 active rentals. This indicates strong guest preference for privacy and space.
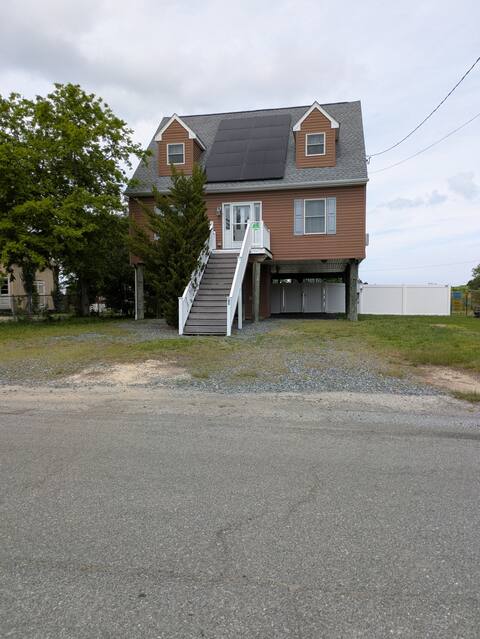
- Looking at the property type distribution in Bowers, House properties are the most common (100%), reflecting the local real estate landscape.
- Houses represent a significant 100% portion, catering likely to families or larger groups.
Bowers Airbnb Room Capacity Analysis (2026): Bedroom Distribution
Distribution of Listings by Number of Bedrooms
Room Capacity Insights for Bowers
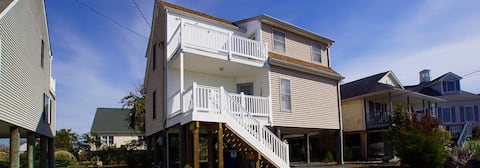
- The dominant room capacity in Bowers is 3 bedrooms listings, making up 42.1% of the market. This suggests a strong demand for properties suitable for families or small groups.
- Together, 3 bedrooms and 4 bedrooms properties represent 68.4% of the active Airbnb listings in Bowers, indicating a high concentration in these sizes.
- A significant 68.4% of listings offer 3+ bedrooms, catering to larger groups and families seeking more space in Bowers.
Bowers Vacation Rental Guest Capacity Trends (2026)
Distribution of Listings by Guest Capacity
Guest Capacity Insights for Bowers
- The most common guest capacity trend in Bowers vacation rentals is listings accommodating 8+ guests (73.7%). This suggests the primary traveler segment is likely larger groups.
- Properties designed for 8+ guests and 4 guests dominate the Bowers STR market, accounting for 84.2% of listings.
- 84.2% of properties accommodate 6+ guests, serving the market segment for larger families or group travel in Bowers.
- On average, properties in Bowers are equipped to host 7.1 guests.
Bowers Airbnb Booking Patterns (2026): Available vs. Booked Days
Available Days Distribution
Booked Days Distribution
Booking Pattern Insights for Bowers
- The most common availability pattern in Bowers falls within the 181-270 days range, representing 68.4% of listings. This suggests many properties have significant open periods on their calendars.
- Approximately 94.7% of listings show high availability (181+ days open annually), indicating potential for increased bookings or specific owner usage patterns.
- For booked days, the 91-180 days range is most frequent in Bowers (63.2%), reflecting common guest stay durations or potential owner blocking patterns.
- A notable 10.5% of properties secure long booking periods (181+ days booked per year), highlighting successful long-term rental strategies or significant owner usage.
Bowers Airbnb Minimum Stay Requirements Analysis
Distribution of Listings by Minimum Night Requirement
1 Night
3 listings
15.8% of total
2 Nights
8 listings
42.1% of total
3 Nights
3 listings
15.8% of total
7-29 Nights
1 listings
5.3% of total
30+ Nights
4 listings
21.1% of total
Key Insights
- The most prevalent minimum stay requirement in Bowers is 2 Nights, adopted by 42.1% of listings. This highlights the market's preference for shorter, flexible bookings.
- A significant segment (21.1%) caters to monthly stays (30+ nights) in Bowers, pointing to opportunities in the extended-stay market.
Recommendations
- Align with the market by considering a 2 Nights minimum stay, as 42.1% of Bowers hosts use this setting.
- If feasible, allowing 1-night stays, especially midweek or during low season, could capture last-minute bookings, as only 15.8% currently do.
- A 2-night minimum appears standard (42.1%). Consider this for weekends or peak periods.
- Explore offering discounts for stays of 30+ nights to attract the 21.1% of the market seeking extended stays.
- Adjust minimum nights based on seasonality – potentially shorter during low season and longer during peak demand periods in Bowers.
Bowers Airbnb Cancellation Policy Trends Analysis (2026)
Flexible
7 listings
36.8% of total
Moderate
3 listings
15.8% of total
Firm
7 listings
36.8% of total
Strict
2 listings
10.5% of total
Cancellation Policy Insights for Bowers
- The prevailing Airbnb cancellation policy trend in Bowers is Flexible, used by 36.8% of listings.
- There's a relatively balanced mix between guest-friendly (52.6%) and stricter (47.3%) policies, offering choices for different guest needs.
Recommendations for Hosts
- Consider adopting a Flexible policy to align with the 36.8% market standard in Bowers.
- Using a Strict policy might deter some guests, as only 10.5% of listings use it. Evaluate if potential revenue protection outweighs possible lower booking rates.
- Regularly review your cancellation policy against competitors and market demand shifts in Bowers.
Bowers STR Booking Lead Time Analysis (2026)
Average Booking Lead Time by Month
Booking Lead Time Insights for Bowers
- The overall average booking lead time for vacation rentals in Bowers is 58 days.
- Guests book furthest in advance for stays during July (average 114 days), likely coinciding with peak travel demand or local events.
- The shortest booking windows occur for stays in January (average 11 days), indicating more last-minute travel plans during this time.
- Seasonally, Summer (92 days avg.) sees the longest lead times, while Winter (19 days avg.) has the shortest, reflecting typical travel planning cycles.
Recommendations for Hosts
- Use the overall average lead time (58 days) as a baseline for your pricing and availability strategy in Bowers.
- For July stays, consider implementing length-of-stay discounts or slightly higher rates for bookings made less than 114 days out to capitalize on advance planning.
- During January, focus on last-minute booking availability and promotions, as guests book with very short notice (11 days avg.).
- Target marketing efforts for the Summer season well in advance (at least 92 days) to capture early planners.
- Monitor your own booking lead times against these Bowers averages to identify opportunities for dynamic pricing adjustments.
Popular & Essential Airbnb Amenities in Bowers (2026)
Amenity Prevalence
Amenity Insights for Bowers
- Essential amenities in Bowers that guests expect include: Heating, Dryer, Air conditioning, Fire extinguisher, Washer, Wifi, Smoke alarm, Hot water, Free parking on premises. Lacking these (any) could significantly impact bookings.
- Popular amenities like Kitchen are common but not universal. Offering these can provide a competitive edge.
Recommendations for Hosts
- Ensure your listing includes all essential amenities for Bowers: Heating, Dryer, Air conditioning, Fire extinguisher, Washer, Wifi, Smoke alarm, Hot water, Free parking on premises.
- Consider adding popular differentiators like Kitchen to increase appeal.
- Highlight unique or less common amenities you offer (e.g., hot tub, dedicated workspace, EV charger) in your listing description and photos.
- Regularly check competitor amenities in Bowers to stay competitive.
Bowers Airbnb Guest Demographics & Profile Analysis (2026)
Guest Profile Summary for Bowers
- The typical guest profile for Airbnb in Bowers consists of primarily domestic travelers (97%), often arriving from nearby Dallas, typically belonging to the Post-2000s (Gen Z/Alpha) group (50%), primarily speaking English or Spanish.
- Domestic travelers account for 97.1% of guests.
- Key international markets include United States (97.1%) and Canada (1%).
- Top languages spoken are English (82.4%) followed by Spanish (5.9%).
- A significant demographic segment is the Post-2000s (Gen Z/Alpha) group, representing 50% of guests.
Recommendations for Hosts
- Target domestic marketing efforts towards travelers from Dallas and Jupiter.
- Tailor amenities and listing descriptions to appeal to the dominant Post-2000s (Gen Z/Alpha) demographic (e.g., highlight fast WiFi, smart home features, local guides).
- Highlight unique local experiences or amenities relevant to the primary guest profile.
- Consider seasonal promotions aligned with peak travel times for key origin markets.
Nearby Short-Term Rental Market Comparison
How does the Bowers Airbnb market stack up against its neighbors? Compare key performance metrics like average monthly revenue, ADR, and occupancy rates in surrounding areas to understand the broader regional STR landscape.
| Market | Active Properties | Monthly Revenue | Daily Rate | Avg. Occupancy |
|---|---|---|---|---|
| Polk Township | 15 | $6,974 | $520.26 | 38% |
| Centreville | 17 | $6,298 | $565.66 | 45% |
| Mayo | 13 | $5,915 | $447.58 | 51% |
| Spring Lake Heights | 16 | $5,785 | $725.20 | 40% |
| Hilltown Township | 11 | $5,557 | $578.96 | 40% |
| Hellam Township | 24 | $5,496 | $386.69 | 45% |
| Cape May Point | 23 | $5,479 | $542.19 | 46% |
| Stone Harbor | 42 | $5,467 | $785.22 | 39% |
| Stevensville | 80 | $5,412 | $556.79 | 41% |
| Neptune City | 12 | $5,299 | $531.14 | 45% |