Bethany Beach Airbnb Market Analysis 2026: Short Term Rental Data & Vacation Rental Statistics in Delaware, United States
Is Airbnb profitable in Bethany Beach in 2026? Explore comprehensive Airbnb analytics for Bethany Beach, Delaware, United States to uncover income potential. This 2026 STR market report for Bethany Beach, based on AirROI data from February 2025 to January 2026, reveals key trends in the market of 442 active listings.
Whether you're considering an Airbnb investment in Bethany Beach, optimizing your existing vacation rental, or exploring rental arbitrage opportunities, understanding the Bethany Beach Airbnb data is crucial. Leveraging the low regulation environment is key to maximizing your short term rental income potential. Let's dive into the specifics.
Key Bethany Beach Airbnb Performance Metrics Overview
Monthly Airbnb Revenue Variations & Income Potential in Bethany Beach (2026)
Understanding the monthly revenue variations for Airbnb listings in Bethany Beach is key to maximizing your short term rental income potential. Seasonality significantly impacts earnings. Our analysis, based on data from the past 12 months, shows that the peak revenue month for STRs in Bethany Beach is typically July, while February often presents the lowest earnings, highlighting opportunities for strategic pricing adjustments during shoulder and low seasons. Explore the typical Airbnb income in Bethany Beach across different performance tiers:
- Best-in-class properties (Top 10%) achieve $9,028+ monthly, often utilizing dynamic pricing and superior guest experiences.
- Strong performing properties (Top 25%) earn $5,624 or more, indicating effective management and desirable locations/amenities.
- Typical properties (Median) generate around $3,086 per month, representing the average market performance.
- Entry-level properties (Bottom 25%) see earnings around $1,367, often with potential for optimization.
Average Monthly Airbnb Earnings Trend in Bethany Beach
Bethany Beach Airbnb Occupancy Rate Trends (2026)
Maximize your bookings by understanding the Bethany Beach STR occupancy trends. Seasonal demand shifts significantly influence how often properties are booked. Typically, Augustsees the highest demand (peak season occupancy), while January experiences the lowest (low season). Effective strategies, like adjusting minimum stays or offering promotions, can boost occupancy during slower periods. Here's how different property tiers perform in Bethany Beach:
- Best-in-class properties (Top 10%) achieve 61%+ occupancy, indicating high desirability and potentially optimized availability.
- Strong performing properties (Top 25%) maintain 44% or higher occupancy, suggesting good market fit and guest satisfaction.
- Typical properties (Median) have an occupancy rate around 24%.
- Entry-level properties (Bottom 25%) average 12% occupancy, potentially facing higher vacancy.
Average Monthly Occupancy Rate Trend in Bethany Beach
Average Daily Rate (ADR) Airbnb Trends in Bethany Beach (2026)
Effective short term rental pricing strategy in Bethany Beach involves understanding monthly ADR fluctuations. The Average Daily Rate (ADR) for Airbnb in Bethany Beach typically peaks in July and dips lowest during March. Leveraging Airbnb dynamic pricing tools or strategies based on this seasonality can significantly boost revenue. Here's a look at the typical nightly rates achieved:
- Best-in-class properties (Top 10%) command rates of $735+ per night, often due to premium features or locations.
- Strong performing properties (Top 25%) achieve nightly rates of $509 or more.
- Typical properties (Median) charge around $354 per night.
- Entry-level properties (Bottom 25%) earn around $263 per night.
Average Daily Rate (ADR) Trend by Month in Bethany Beach
Get Live Bethany Beach Market Intelligence 👇

Explore Real-time Analytics
Airbnb Seasonality Analysis & Trends in Bethany Beach (2026)
Peak Season (July, August, June)
- Revenue averages $8,534 per month
- Occupancy rates average 48.4%
- Daily rates average $502
Shoulder Season
- Revenue averages $3,303 per month
- Occupancy maintains around 25.8%
- Daily rates hold near $408
Low Season (January, February, March)
- Revenue drops to average $1,806 per month
- Occupancy decreases to average 18.2%
- Daily rates adjust to average $386
Seasonality Insights for Bethany Beach
- The Airbnb seasonality in Bethany Beach shows highly seasonal trends requiring careful strategy. While the sections above show seasonal averages, it's also insightful to look at the extremes:
- During the high season, the absolute peak month showcases Bethany Beach's highest earning potential, with monthly revenues capable of climbing to $9,515, occupancy reaching a high of 50.7%, and ADRs peaking at $514.
- Conversely, the slowest single month of the year, typically falling within the low season, marks the market's lowest point. In this month, revenue might dip to $1,600, occupancy could drop to 13.8%, and ADRs may adjust down to $368.
- Understanding both the seasonal averages and these monthly peaks and troughs in revenue, occupancy, and ADR is crucial for maximizing your Airbnb profit potential in Bethany Beach.
Seasonal Strategies for Maximizing Profit
- Peak Season: Maximize revenue through premium pricing and potentially longer minimum stays. Ensure high availability.
- Low Season: Offer competitive pricing, special promotions (e.g., extended stay discounts), and flexible cancellation policies. Target off-season travelers like remote workers or budget-conscious guests.
- Shoulder Seasons: Implement dynamic pricing that balances peak and low rates. Target weekend travelers or specific events. Offer slightly more flexible terms than peak season.
- Regularly analyze your own performance against these Bethany Beach seasonality benchmarks and adjust your pricing and availability strategy accordingly.
Best Areas for Airbnb Investment in Bethany Beach (2026)
Exploring the top neighborhoods for short-term rentals in Bethany Beach? This section highlights key areas, outlining why they are attractive for hosts and guests, along with notable local attractions. Consider these locations based on your target guest profile and investment strategy.
| Neighborhood / Area | Why Host Here? (Target Guests & Appeal) | Key Attractions & Landmarks |
|---|---|---|
| North Bethany | A quieter, family-friendly area located north of Bethany Beach, offering access to pristine beaches and a peaceful atmosphere. Ideal for families looking for a relaxing vacation spot. | Bethany Beach, North Bethany Beach, Holts Landing State Park, Sea Colony, Bethany Beach Nature Center, Fresh Pond State Park |
| Bethany Beach | The main beach area known for its beautiful boardwalk, restaurants, and shops. This is the heart of the town and a favorite for tourists looking for convenience and fun activities. | Bethany Beach Boardwalk, Bethany Beachопп Park, Old Salt Seafood Market, Grotto Pizza, Delaware Seashore State Park, Salt Pond |
| South Bethany | A serene beach community that offers a more relaxed pace and beautiful surroundings. Great for those seeking a tranquil getaway while still being close to the liveliness of Bethany Beach. | Fenwick Island State Park, South Bethany Beach, Walk to the beach, Local shops and eateries, Kayaking and paddle boarding opportunities |
| Fenwick Island | Located just south of Bethany Beach, Fenwick Island boasts beautiful beaches and a family-friendly atmosphere. It's a great option for vacationers and renters alike. | Fenwick Island Lighthouse, Fenwick Island State Park, Bear Trap Dunes Golf Club, Local dining spots, Nearby water activities |
| Maryland Line | Access to various water activities, this area is popular for those looking to rent boats and enjoy outdoor sports. Great for adventurous guests. | Assateague Island, Water sports, Local fishing spots, Eco-tours, Fishing piers |
| Ocean View | A quiet residential community with easy access to various amenities and attractions, perfect for families and larger groups. | Golf courses, Ocean View Beach Club, Local parks, Nearby seafood markets, Kayaking |
| Sea Colony | A large resort community offering a wide range of amenities, including pools, walking trails, and beach access, making it a prime investment area for rentals. | Sea Colony Beach, Indoor amenities, Tennis courts, Local restaurants, Bike trails |
| Dagsboro | A charming and historical town located inland, offering unique local experiences and access to beaches while being away from the busy tourist scene. | Dagsboro Historical Society, Local farms, Small shops, Nature trails, Historic sites |
Understanding Airbnb License Requirements & STR Laws in Bethany Beach (2026)
While Bethany Beach, Delaware, United States currently shows low STR regulations, specific Airbnb license requirements might still exist or change. Always verify the latest short term rental regulations and Airbnb license requirements directly with local government authorities for Bethany Beach to ensure full compliance before hosting.
(Source: AirROI data, 2026, finding no licensed listings among those analyzed)
Top Performing Airbnb Properties in Bethany Beach (2026)
Benchmark your potential! Explore examples of top-performing Airbnb properties in Bethany Beachbased on Trailing Twelve Month (TTM) revenue. Analyze their characteristics, revenue, occupancy rate, and ADR to understand what drives success in this market.

Bethany Beach Breakaway | Beach Access & Hot Tub!
Entire Place • 5 bedrooms
<2 blocks to Bethany Beach, short walk to downtown
Entire Place • 6 bedrooms

Steps to Shore: Spacious Bethany Beach Retreat
Entire Place • 5 bedrooms
11 Bedroom house, ocean block!
Entire Place • 11 bedrooms
Balmy Waves Sur Mer Atlantic Watergate Oceanfront
Entire Place • 4 bedrooms

Family Home Steps to Private Beach
Entire Place • 5 bedrooms
Note: Performance varies based on location, size, amenities, seasonality, and management quality. Data reflects the past 12 months.
Top Performing Airbnb Hosts in Bethany Beach (2026)
Learn from the best! This table showcases top-performing Airbnb hosts in Bethany Beach based on the number of properties managed and estimated total revenue over the past year. Analyze their scale and performance metrics.
| Host Name | Properties | Grossing Revenue | Stay Reviews | Avg Rating |
|---|---|---|---|---|
| Vacasa Delaware | 124 | $752,959 | 1367 | 4.48/5.0 |
| 1st Choice Properties | 16 | $568,725 | 51 | 4.91/5.0 |
| Evolve | 10 | $500,896 | 206 | 4.72/5.0 |
| Vacasa Delaware | 34 | $337,205 | 348 | 4.35/5.0 |
| Vacasa Bethany Beach | 47 | $333,306 | 593 | 4.64/5.0 |
| Landon | 1 | $278,998 | 47 | 4.85/5.0 |
| Kristen | 5 | $231,099 | 221 | 4.79/5.0 |
| William | 1 | $215,399 | 67 | 4.91/5.0 |
| Karen | 4 | $184,634 | 194 | 4.92/5.0 |
| Hamid | 1 | $166,789 | 5 | 5.00/5.0 |
Analyzing the strategies of top hosts, such as their property selection, pricing, and guest communication, can offer valuable lessons for optimizing your own Airbnb operations in Bethany Beach.
Dive Deeper: Advanced Bethany Beach STR Market Data (2026)
Ready to unlock more insights? AirROI provides access to advanced metrics and comprehensive Airbnb data for Bethany Beach. Explore detailed analytics beyond this report to refine your investment strategy, optimize pricing, and maximize your vacation rental profits.
Explore Advanced MetricsBethany Beach Short-Term Rental Market Composition (2026): Property & Room Types
Room Type Distribution
Property Type Distribution
Market Composition Insights for Bethany Beach
- The Bethany Beach Airbnb market composition is heavily skewed towards Entire Home/Apt listings, which make up 99.8% of the 442 active rentals. This indicates strong guest preference for privacy and space.
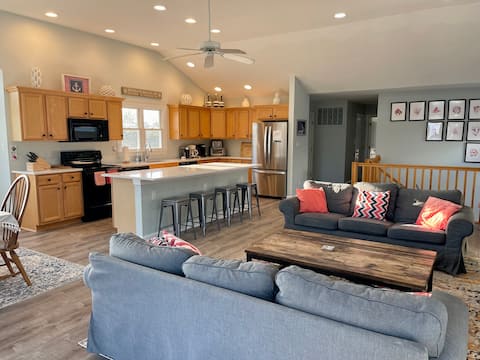
- Looking at the property type distribution in Bethany Beach, House properties are the most common (58.8%), reflecting the local real estate landscape.
- Houses represent a significant 58.8% portion, catering likely to families or larger groups.
Bethany Beach Airbnb Room Capacity Analysis (2026): Bedroom Distribution
Distribution of Listings by Number of Bedrooms
Room Capacity Insights for Bethany Beach
- The dominant room capacity in Bethany Beach is 3 bedrooms listings, making up 35.5% of the market. This suggests a strong demand for properties suitable for families or small groups.
- Together, 3 bedrooms and 2 bedrooms properties represent 58.1% of the active Airbnb listings in Bethany Beach, indicating a high concentration in these sizes.
- A significant 69.9% of listings offer 3+ bedrooms, catering to larger groups and families seeking more space in Bethany Beach.
Bethany Beach Vacation Rental Guest Capacity Trends (2026)
Distribution of Listings by Guest Capacity
Guest Capacity Insights for Bethany Beach
- The most common guest capacity trend in Bethany Beach vacation rentals is listings accommodating 8+ guests (62.4%). This suggests the primary traveler segment is likely larger groups.
- Properties designed for 8+ guests and 6 guests dominate the Bethany Beach STR market, accounting for 85.5% of listings.
- 89.3% of properties accommodate 6+ guests, serving the market segment for larger families or group travel in Bethany Beach.
- On average, properties in Bethany Beach are equipped to host 7.1 guests.
Bethany Beach Airbnb Booking Patterns (2026): Available vs. Booked Days
Available Days Distribution
Booked Days Distribution
Booking Pattern Insights for Bethany Beach
- The most common availability pattern in Bethany Beach falls within the 271-366 days range, representing 76.7% of listings. This suggests many properties have significant open periods on their calendars.
- Approximately 97.3% of listings show high availability (181+ days open annually), indicating potential for increased bookings or specific owner usage patterns.
- For booked days, the 1-30 days range is most frequent in Bethany Beach (45.7%), reflecting common guest stay durations or potential owner blocking patterns.
- A notable 3.4% of properties secure long booking periods (181+ days booked per year), highlighting successful long-term rental strategies or significant owner usage.
Bethany Beach Airbnb Minimum Stay Requirements Analysis
Distribution of Listings by Minimum Night Requirement
1 Night
6 listings
1.4% of total
2 Nights
90 listings
20.4% of total
3 Nights
77 listings
17.4% of total
4-6 Nights
53 listings
12% of total
7-29 Nights
35 listings
7.9% of total
30+ Nights
181 listings
41% of total
Key Insights
- The most prevalent minimum stay requirement in Bethany Beach is 30+ Nights, adopted by 41% of listings. This highlights the market's preference for longer commitments.
- A significant segment (41%) caters to monthly stays (30+ nights) in Bethany Beach, pointing to opportunities in the extended-stay market.
Recommendations
- Align with the market by considering a 30+ Nights minimum stay, as 41% of Bethany Beach hosts use this setting.
- If feasible, allowing 1-night stays, especially midweek or during low season, could capture last-minute bookings, as only 1.4% currently do.
- Explore offering discounts for stays of 30+ nights to attract the 41% of the market seeking extended stays.
- Adjust minimum nights based on seasonality – potentially shorter during low season and longer during peak demand periods in Bethany Beach.
Bethany Beach Airbnb Cancellation Policy Trends Analysis (2026)
Limited
1 listings
0.2% of total
Super Strict 30 Days
9 listings
2% of total
Super Strict 60 Days
224 listings
50.7% of total
Flexible
15 listings
3.4% of total
Moderate
19 listings
4.3% of total
Firm
100 listings
22.6% of total
Strict
74 listings
16.7% of total
Cancellation Policy Insights for Bethany Beach
- The prevailing Airbnb cancellation policy trend in Bethany Beach is Super Strict 60 Days, used by 50.7% of listings.
- There's a relatively balanced mix between guest-friendly (7.7%) and stricter (39.3%) policies, offering choices for different guest needs.
Recommendations for Hosts
- Consider adopting a Super Strict 60 Days policy to align with the 50.7% market standard in Bethany Beach.
- Regularly review your cancellation policy against competitors and market demand shifts in Bethany Beach.
Bethany Beach STR Booking Lead Time Analysis (2026)
Average Booking Lead Time by Month
Booking Lead Time Insights for Bethany Beach
- The overall average booking lead time for vacation rentals in Bethany Beach is 74 days.
- Guests book furthest in advance for stays during July (average 118 days), likely coinciding with peak travel demand or local events.
- The shortest booking windows occur for stays in February (average 26 days), indicating more last-minute travel plans during this time.
- Seasonally, Summer (108 days avg.) sees the longest lead times, while Winter (30 days avg.) has the shortest, reflecting typical travel planning cycles.
Recommendations for Hosts
- Use the overall average lead time (74 days) as a baseline for your pricing and availability strategy in Bethany Beach.
- For July stays, consider implementing length-of-stay discounts or slightly higher rates for bookings made less than 118 days out to capitalize on advance planning.
- Target marketing efforts for the Summer season well in advance (at least 108 days) to capture early planners.
- Monitor your own booking lead times against these Bethany Beach averages to identify opportunities for dynamic pricing adjustments.
Popular & Essential Airbnb Amenities in Bethany Beach (2026)
Amenity Prevalence
Amenity Insights for Bethany Beach
- Essential amenities in Bethany Beach that guests expect include: Air conditioning, Smoke alarm, Kitchen, TV, Wifi, Heating, Washer, Dryer, Refrigerator, Microwave. Lacking these (any) could significantly impact bookings.
Recommendations for Hosts
- Ensure your listing includes all essential amenities for Bethany Beach: Air conditioning, Smoke alarm, Kitchen, TV, Wifi, Heating, Washer, Dryer, Refrigerator, Microwave.
- Prioritize adding missing essentials: Smoke alarm, Kitchen, TV, Wifi, Heating, Washer, Dryer, Refrigerator, Microwave.
- Highlight unique or less common amenities you offer (e.g., hot tub, dedicated workspace, EV charger) in your listing description and photos.
- Regularly check competitor amenities in Bethany Beach to stay competitive.
Bethany Beach Airbnb Guest Demographics & Profile Analysis (2026)
Guest Profile Summary for Bethany Beach
- The typical guest profile for Airbnb in Bethany Beach consists of primarily domestic travelers (91%), often arriving from nearby Washington, typically belonging to the Post-2000s (Gen Z/Alpha) group (50%), primarily speaking English or Spanish.
- Domestic travelers account for 91.4% of guests.
- Key international markets include United States (91.4%) and DC (7.2%).
- Top languages spoken are English (72.8%) followed by Spanish (12%).
- A significant demographic segment is the Post-2000s (Gen Z/Alpha) group, representing 50% of guests.
Recommendations for Hosts
- Target domestic marketing efforts towards travelers from Washington and Baltimore.
- Tailor amenities and listing descriptions to appeal to the dominant Post-2000s (Gen Z/Alpha) demographic (e.g., highlight fast WiFi, smart home features, local guides).
- Highlight unique local experiences or amenities relevant to the primary guest profile.
- Consider seasonal promotions aligned with peak travel times for key origin markets.
Nearby Short-Term Rental Market Comparison
How does the Bethany Beach Airbnb market stack up against its neighbors? Compare key performance metrics like average monthly revenue, ADR, and occupancy rates in surrounding areas to understand the broader regional STR landscape.
| Market | Active Properties | Monthly Revenue | Daily Rate | Avg. Occupancy |
|---|---|---|---|---|
| Centreville | 17 | $6,298 | $565.66 | 45% |
| Mayo | 13 | $5,915 | $447.58 | 51% |
| Cape May Point | 23 | $5,479 | $542.19 | 46% |
| Stone Harbor | 42 | $5,467 | $785.22 | 39% |
| Stevensville | 80 | $5,412 | $556.79 | 41% |
| Weems | 11 | $5,077 | $417.22 | 47% |
| Lower Windsor Township | 14 | $5,062 | $428.71 | 45% |
| Arundel on the Bay | 29 | $5,043 | $486.96 | 40% |
| Cape May | 334 | $5,029 | $553.79 | 42% |
| Surf City | 47 | $5,004 | $715.29 | 44% |