Zuni Airbnb Market Analysis 2026: Short Term Rental Data & Vacation Rental Statistics in Colorado, United States
Is Airbnb profitable in Zuni in 2026? Explore comprehensive Airbnb analytics for Zuni, Colorado, United States to uncover income potential. This 2026 STR market report for Zuni, based on AirROI data from February 2025 to January 2026, reveals key trends in the niche market of 119 active listings.
Whether you're considering an Airbnb investment in Zuni, optimizing your existing vacation rental, or exploring rental arbitrage opportunities, understanding the Zuni Airbnb data is crucial. Leveraging the low regulation environment is key to maximizing your short term rental income potential. Let's dive into the specifics.
Key Zuni Airbnb Performance Metrics Overview
Monthly Airbnb Revenue Variations & Income Potential in Zuni (2026)
Understanding the monthly revenue variations for Airbnb listings in Zuni is key to maximizing your short term rental income potential. Seasonality significantly impacts earnings. Our analysis, based on data from the past 12 months, shows that the peak revenue month for STRs in Zuni is typically July, while February often presents the lowest earnings, highlighting opportunities for strategic pricing adjustments during shoulder and low seasons. Explore the typical Airbnb income in Zuni across different performance tiers:
- Best-in-class properties (Top 10%) achieve $9,825+ monthly, often utilizing dynamic pricing and superior guest experiences.
- Strong performing properties (Top 25%) earn $6,640 or more, indicating effective management and desirable locations/amenities.
- Typical properties (Median) generate around $4,070 per month, representing the average market performance.
- Entry-level properties (Bottom 25%) see earnings around $2,443, often with potential for optimization.
Average Monthly Airbnb Earnings Trend in Zuni
Zuni Airbnb Occupancy Rate Trends (2026)
Maximize your bookings by understanding the Zuni STR occupancy trends. Seasonal demand shifts significantly influence how often properties are booked. Typically, Julysees the highest demand (peak season occupancy), while January experiences the lowest (low season). Effective strategies, like adjusting minimum stays or offering promotions, can boost occupancy during slower periods. Here's how different property tiers perform in Zuni:
- Best-in-class properties (Top 10%) achieve 86%+ occupancy, indicating high desirability and potentially optimized availability.
- Strong performing properties (Top 25%) maintain 73% or higher occupancy, suggesting good market fit and guest satisfaction.
- Typical properties (Median) have an occupancy rate around 58%.
- Entry-level properties (Bottom 25%) average 39% occupancy, potentially facing higher vacancy.
Average Monthly Occupancy Rate Trend in Zuni
Average Daily Rate (ADR) Airbnb Trends in Zuni (2026)
Effective short term rental pricing strategy in Zuni involves understanding monthly ADR fluctuations. The Average Daily Rate (ADR) for Airbnb in Zuni typically peaks in December and dips lowest during February. Leveraging Airbnb dynamic pricing tools or strategies based on this seasonality can significantly boost revenue. Here's a look at the typical nightly rates achieved:
- Best-in-class properties (Top 10%) command rates of $539+ per night, often due to premium features or locations.
- Strong performing properties (Top 25%) achieve nightly rates of $349 or more.
- Typical properties (Median) charge around $217 per night.
- Entry-level properties (Bottom 25%) earn around $143 per night.
Average Daily Rate (ADR) Trend by Month in Zuni
Get Live Zuni Market Intelligence 👇

Explore Real-time Analytics
Airbnb Seasonality Analysis & Trends in Zuni (2026)
Peak Season (July, June, August)
- Revenue averages $7,002 per month
- Occupancy rates average 66.9%
- Daily rates average $297
Shoulder Season
- Revenue averages $5,012 per month
- Occupancy maintains around 53.5%
- Daily rates hold near $288
Low Season (February, March, April)
- Revenue drops to average $3,426 per month
- Occupancy decreases to average 49.2%
- Daily rates adjust to average $227
Seasonality Insights for Zuni
- The Airbnb seasonality in Zuni shows highly seasonal trends requiring careful strategy. While the sections above show seasonal averages, it's also insightful to look at the extremes:
- During the high season, the absolute peak month showcases Zuni's highest earning potential, with monthly revenues capable of climbing to $7,298, occupancy reaching a high of 67.5%, and ADRs peaking at $328.
- Conversely, the slowest single month of the year, typically falling within the low season, marks the market's lowest point. In this month, revenue might dip to $3,187, occupancy could drop to 44.4%, and ADRs may adjust down to $221.
- Understanding both the seasonal averages and these monthly peaks and troughs in revenue, occupancy, and ADR is crucial for maximizing your Airbnb profit potential in Zuni.
Seasonal Strategies for Maximizing Profit
- Peak Season: Maximize revenue through premium pricing and potentially longer minimum stays. Ensure high availability.
- Low Season: Offer competitive pricing, special promotions (e.g., extended stay discounts), and flexible cancellation policies. Target off-season travelers like remote workers or budget-conscious guests.
- Shoulder Seasons: Implement dynamic pricing that balances peak and low rates. Target weekend travelers or specific events. Offer slightly more flexible terms than peak season.
- Regularly analyze your own performance against these Zuni seasonality benchmarks and adjust your pricing and availability strategy accordingly.
Best Areas for Airbnb Investment in Zuni (2026)
Exploring the top neighborhoods for short-term rentals in Zuni? This section highlights key areas, outlining why they are attractive for hosts and guests, along with notable local attractions. Consider these locations based on your target guest profile and investment strategy.
| Neighborhood / Area | Why Host Here? (Target Guests & Appeal) | Key Attractions & Landmarks |
|---|---|---|
| Zuni Mountain Area | Scenic mountain views and close proximity to outdoor activities such as hiking, skiing, and mountain biking. Ideal for nature enthusiasts looking for a peaceful retreat. | Zuni Mountains, Bluewater Lake State Park, Petrified Forest, El Malpais National Monument, Cibola National Forest |
| Zuni Pueblo | Rich in Native American culture and history, offering a unique experience for guests interested in local traditions and arts. Great for cultural tourism. | Zuni Cultural Center, Zuni Pueblo Art, Zuni Ceremonial Dances, Pueblo Heritage Center |
| Historic Route 66 | Famous road with a mix of history and nostalgia, attracting road trip travelers and tourists wanting to explore the legacy of Route 66. | Route 66 Museum, Historic Sites along Route 66, Local Diners and Shops |
| Acoma Sky City | Home to one of the oldest continuously inhabited communities in North America, providing breathtaking views and cultural experiences. | Acoma Pueblo, Sky City Cultural Center, Guided Tours of Sky City |
| Grants | Nearby town with amenities, restaurants, and access to the outdoors. A convenient location for travelers exploring the region. | El Malpais National Monument, Grants Mining Museum, Nearby hiking trails |
| Cibola National Forest | Ideal for travelers looking for outdoor adventures and camping. Offers diverse landscapes and tranquility in nature. | Hiking Trails, Camping Areas, Wildlife Watching |
| Havey’s Lake | Small lake area that provides opportunities for fishing and relaxation. Great for families and those seeking a quiet getaway. | Fishing, Picnic Areas, Nature Trails |
| Hiking Trails Near Zuni | Offers various scenic trails for hiking enthusiasts. Connects guests to the natural beauty of the Zuni mountains. | Zuni Mountain Trail, Elm Canyon Trail, Cedar Creek Trail |
Understanding Airbnb License Requirements & STR Laws in Zuni (2026)
While Zuni, Colorado, United States currently shows low STR regulations, specific Airbnb license requirements might still exist or change. Always verify the latest short term rental regulations and Airbnb license requirements directly with local government authorities for Zuni to ensure full compliance before hosting.
(Source: AirROI data, 2026, based on 1% licensed listings)
Top Performing Airbnb Properties in Zuni (2026)
Benchmark your potential! Explore examples of top-performing Airbnb properties in Zunibased on Trailing Twelve Month (TTM) revenue. Analyze their characteristics, revenue, occupancy rate, and ADR to understand what drives success in this market.
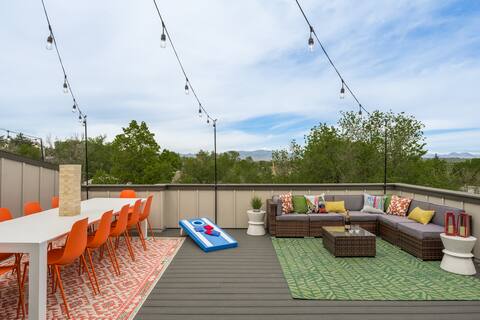
8 BR/10 BA/12 beds | 5,000 sqft | 2 Rooftop Decks
Entire Place • 8 bedrooms

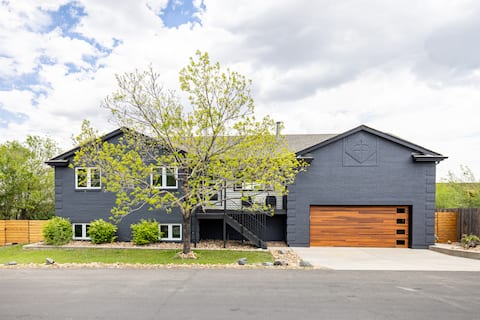
Minutes to Downtown DEN | Sleeps 16 | Red Rocks
Entire Place • 6 bedrooms
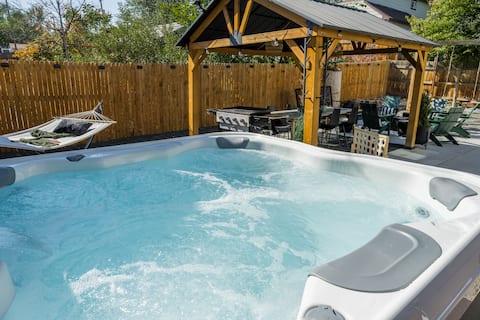
Lrg Home | Hot Tub | Bckyd Oasis | +Caboose Add-On
Entire Place • 7 bedrooms
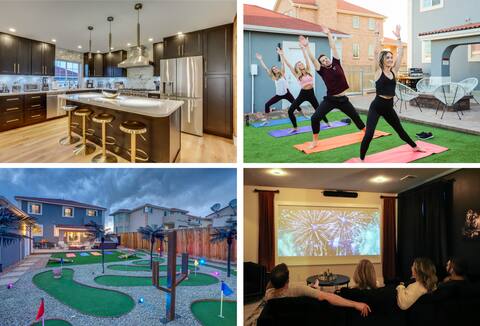
The Gatsby: Putt Putt | Fire Pit | Hot Tub
Entire Place • 4 bedrooms
Large Home Groups/Families, Sleeps 14, Two HotTubs
Entire Place • 7 bedrooms

Pop Art Pad! Movie/GameRm+Huge Yard, 10m to DT
Entire Place • 6 bedrooms
Note: Performance varies based on location, size, amenities, seasonality, and management quality. Data reflects the past 12 months.
Top Performing Airbnb Hosts in Zuni (2026)
Learn from the best! This table showcases top-performing Airbnb hosts in Zuni based on the number of properties managed and estimated total revenue over the past year. Analyze their scale and performance metrics.
| Host Name | Properties | Grossing Revenue | Stay Reviews | Avg Rating |
|---|---|---|---|---|
| Kyle Andrew | 9 | $827,137 | 411 | 4.89/5.0 |
| Amanda | 3 | $306,593 | 162 | 4.98/5.0 |
| Stefan And Bethany | 3 | $280,773 | 568 | 4.95/5.0 |
| Anna | 3 | $274,983 | 282 | 4.86/5.0 |
| Paxton | 2 | $211,347 | 190 | 4.97/5.0 |
| Brittney | 2 | $211,225 | 494 | 4.91/5.0 |
| AirSimplicity | 3 | $171,159 | 204 | 4.84/5.0 |
| Chris | 4 | $160,444 | 492 | 4.82/5.0 |
| Max | 1 | $159,740 | 58 | 4.84/5.0 |
| Jeff | 1 | $133,818 | 115 | 4.91/5.0 |
Analyzing the strategies of top hosts, such as their property selection, pricing, and guest communication, can offer valuable lessons for optimizing your own Airbnb operations in Zuni.
Dive Deeper: Advanced Zuni STR Market Data (2026)
Ready to unlock more insights? AirROI provides access to advanced metrics and comprehensive Airbnb data for Zuni. Explore detailed analytics beyond this report to refine your investment strategy, optimize pricing, and maximize your vacation rental profits.
Explore Advanced MetricsZuni Short-Term Rental Market Composition (2026): Property & Room Types
Room Type Distribution
Property Type Distribution
Market Composition Insights for Zuni
- The Zuni Airbnb market composition is heavily skewed towards Entire Home/Apt listings, which make up 91.6% of the 119 active rentals. This indicates strong guest preference for privacy and space.
- Looking at the property type distribution in Zuni, House properties are the most common (79%), reflecting the local real estate landscape.
- Houses represent a significant 79% portion, catering likely to families or larger groups.
- Smaller segments like hotel/boutique, others, unique stays, outdoor/unique (combined 8.4%) offer potential for unique stay experiences.
Zuni Airbnb Room Capacity Analysis (2026): Bedroom Distribution
Distribution of Listings by Number of Bedrooms
Room Capacity Insights for Zuni
- The dominant room capacity in Zuni is 2 bedrooms listings, making up 22.7% of the market. This suggests a strong demand for properties suitable for couples or solo travelers.
- Together, 2 bedrooms and 4 bedrooms properties represent 42.9% of the active Airbnb listings in Zuni, indicating a high concentration in these sizes.
- A significant 55.5% of listings offer 3+ bedrooms, catering to larger groups and families seeking more space in Zuni.
Zuni Vacation Rental Guest Capacity Trends (2026)
Distribution of Listings by Guest Capacity
Guest Capacity Insights for Zuni
- The most common guest capacity trend in Zuni vacation rentals is listings accommodating 8+ guests (48.7%). This suggests the primary traveler segment is likely larger groups.
- Properties designed for 8+ guests and 4 guests dominate the Zuni STR market, accounting for 60.5% of listings.
- 60.5% of properties accommodate 6+ guests, serving the market segment for larger families or group travel in Zuni.
- On average, properties in Zuni are equipped to host 5.8 guests.
Zuni Airbnb Booking Patterns (2026): Available vs. Booked Days
Available Days Distribution
Booked Days Distribution
Booking Pattern Insights for Zuni
- The most common availability pattern in Zuni falls within the 91-180 days range, representing 42% of listings. This suggests many properties have significant open periods on their calendars.
- Approximately 48.8% of listings show high availability (181+ days open annually), indicating potential for increased bookings or specific owner usage patterns.
- For booked days, the 181-270 days range is most frequent in Zuni (43.7%), reflecting common guest stay durations or potential owner blocking patterns.
- A notable 54.6% of properties secure long booking periods (181+ days booked per year), highlighting successful long-term rental strategies or significant owner usage.
Zuni Airbnb Minimum Stay Requirements Analysis
Distribution of Listings by Minimum Night Requirement
1 Night
19 listings
16% of total
2 Nights
40 listings
33.6% of total
3 Nights
10 listings
8.4% of total
7-29 Nights
5 listings
4.2% of total
30+ Nights
45 listings
37.8% of total
Key Insights
- The most prevalent minimum stay requirement in Zuni is 30+ Nights, adopted by 37.8% of listings. This highlights the market's preference for longer commitments.
- A significant segment (37.8%) caters to monthly stays (30+ nights) in Zuni, pointing to opportunities in the extended-stay market.
Recommendations
- Align with the market by considering a 30+ Nights minimum stay, as 37.8% of Zuni hosts use this setting.
- If feasible, allowing 1-night stays, especially midweek or during low season, could capture last-minute bookings, as only 16% currently do.
- A 2-night minimum appears standard (33.6%). Consider this for weekends or peak periods.
- Explore offering discounts for stays of 30+ nights to attract the 37.8% of the market seeking extended stays.
- Adjust minimum nights based on seasonality – potentially shorter during low season and longer during peak demand periods in Zuni.
Zuni Airbnb Cancellation Policy Trends Analysis (2026)
Super Strict 30 Days
3 listings
2.5% of total
Limited
1 listings
0.8% of total
Super Strict 60 Days
2 listings
1.7% of total
Flexible
7 listings
5.9% of total
Moderate
50 listings
42% of total
Firm
41 listings
34.5% of total
Strict
15 listings
12.6% of total
Cancellation Policy Insights for Zuni
- The prevailing Airbnb cancellation policy trend in Zuni is Moderate, used by 42% of listings.
- There's a relatively balanced mix between guest-friendly (47.9%) and stricter (47.1%) policies, offering choices for different guest needs.
Recommendations for Hosts
- Consider adopting a Moderate policy to align with the 42% market standard in Zuni.
- Using a Strict policy might deter some guests, as only 12.6% of listings use it. Evaluate if potential revenue protection outweighs possible lower booking rates.
- Regularly review your cancellation policy against competitors and market demand shifts in Zuni.
Zuni STR Booking Lead Time Analysis (2026)
Average Booking Lead Time by Month
Booking Lead Time Insights for Zuni
- The overall average booking lead time for vacation rentals in Zuni is 38 days.
- Guests book furthest in advance for stays during June (average 53 days), likely coinciding with peak travel demand or local events.
- The shortest booking windows occur for stays in February (average 22 days), indicating more last-minute travel plans during this time.
- Seasonally, Summer (50 days avg.) sees the longest lead times, while Spring (33 days avg.) has the shortest, reflecting typical travel planning cycles.
Recommendations for Hosts
- Use the overall average lead time (38 days) as a baseline for your pricing and availability strategy in Zuni.
- For June stays, consider implementing length-of-stay discounts or slightly higher rates for bookings made less than 53 days out to capitalize on advance planning.
- Target marketing efforts for the Summer season well in advance (at least 50 days) to capture early planners.
- Monitor your own booking lead times against these Zuni averages to identify opportunities for dynamic pricing adjustments.
Popular & Essential Airbnb Amenities in Zuni (2026)
Amenity Prevalence
Amenity Insights for Zuni
- Essential amenities in Zuni that guests expect include: Smoke alarm, Wifi, Carbon monoxide alarm, TV, Air conditioning, Hot water, Kitchen, Heating, Free parking on premises, Dishes and silverware. Lacking these (any) could significantly impact bookings.
Recommendations for Hosts
- Ensure your listing includes all essential amenities for Zuni: Smoke alarm, Wifi, Carbon monoxide alarm, TV, Air conditioning, Hot water, Kitchen, Heating, Free parking on premises, Dishes and silverware.
- Prioritize adding missing essentials: Wifi, Carbon monoxide alarm, TV, Air conditioning, Hot water, Kitchen, Heating, Free parking on premises, Dishes and silverware.
- Highlight unique or less common amenities you offer (e.g., hot tub, dedicated workspace, EV charger) in your listing description and photos.
- Regularly check competitor amenities in Zuni to stay competitive.
Zuni Airbnb Guest Demographics & Profile Analysis (2026)
Guest Profile Summary for Zuni
- The typical guest profile for Airbnb in Zuni consists of primarily domestic travelers (94%), often arriving from nearby Denver, typically belonging to the Post-2000s (Gen Z/Alpha) group (50%), primarily speaking English or Spanish.
- Domestic travelers account for 94.1% of guests.
- Key international markets include United States (94.1%) and Canada (1.5%).
- Top languages spoken are English (70.9%) followed by Spanish (15.8%).
- A significant demographic segment is the Post-2000s (Gen Z/Alpha) group, representing 50% of guests.
Recommendations for Hosts
- Target domestic marketing efforts towards travelers from Denver and New York.
- Tailor amenities and listing descriptions to appeal to the dominant Post-2000s (Gen Z/Alpha) demographic (e.g., highlight fast WiFi, smart home features, local guides).
- Highlight unique local experiences or amenities relevant to the primary guest profile.
- Consider seasonal promotions aligned with peak travel times for key origin markets.
Nearby Short-Term Rental Market Comparison
How does the Zuni Airbnb market stack up against its neighbors? Compare key performance metrics like average monthly revenue, ADR, and occupancy rates in surrounding areas to understand the broader regional STR landscape.
| Market | Active Properties | Monthly Revenue | Daily Rate | Avg. Occupancy |
|---|---|---|---|---|
| Blue River | 201 | $7,203 | $609.20 | 45% |
| Aspen | 610 | $7,095 | $992.28 | 36% |
| Snowmass | 21 | $6,247 | $701.59 | 40% |
| Aspen Park | 11 | $5,825 | $395.00 | 54% |
| Indian Hills | 11 | $5,799 | $333.03 | 54% |
| Grand County | 14 | $5,137 | $513.48 | 42% |
| Breckenridge | 3,051 | $4,995 | $544.32 | 40% |
| Crested Butte | 267 | $4,956 | $536.90 | 42% |
| Snowmass Village | 636 | $4,938 | $711.61 | 35% |
| Black Hawk | 133 | $4,884 | $328.37 | 52% |