Woodmoor Airbnb Market Analysis 2026: Short Term Rental Data & Vacation Rental Statistics in Colorado, United States
Is Airbnb profitable in Woodmoor in 2026? Explore comprehensive Airbnb analytics for Woodmoor, Colorado, United States to uncover income potential. This 2026 STR market report for Woodmoor, based on AirROI data from February 2025 to January 2026, reveals key trends in the niche market of 43 active listings.
Whether you're considering an Airbnb investment in Woodmoor, optimizing your existing vacation rental, or exploring rental arbitrage opportunities, understanding the Woodmoor Airbnb data is crucial. Leveraging the low regulation environment is key to maximizing your short term rental income potential. Let's dive into the specifics.
Key Woodmoor Airbnb Performance Metrics Overview
Monthly Airbnb Revenue Variations & Income Potential in Woodmoor (2026)
Understanding the monthly revenue variations for Airbnb listings in Woodmoor is key to maximizing your short term rental income potential. Seasonality significantly impacts earnings. Our analysis, based on data from the past 12 months, shows that the peak revenue month for STRs in Woodmoor is typically July, while February often presents the lowest earnings, highlighting opportunities for strategic pricing adjustments during shoulder and low seasons. Explore the typical Airbnb income in Woodmoor across different performance tiers:
- Best-in-class properties (Top 10%) achieve $11,311+ monthly, often utilizing dynamic pricing and superior guest experiences.
- Strong performing properties (Top 25%) earn $8,269 or more, indicating effective management and desirable locations/amenities.
- Typical properties (Median) generate around $4,284 per month, representing the average market performance.
- Entry-level properties (Bottom 25%) see earnings around $2,001, often with potential for optimization.
Average Monthly Airbnb Earnings Trend in Woodmoor
Woodmoor Airbnb Occupancy Rate Trends (2026)
Maximize your bookings by understanding the Woodmoor STR occupancy trends. Seasonal demand shifts significantly influence how often properties are booked. Typically, Julysees the highest demand (peak season occupancy), while February experiences the lowest (low season). Effective strategies, like adjusting minimum stays or offering promotions, can boost occupancy during slower periods. Here's how different property tiers perform in Woodmoor:
- Best-in-class properties (Top 10%) achieve 78%+ occupancy, indicating high desirability and potentially optimized availability.
- Strong performing properties (Top 25%) maintain 64% or higher occupancy, suggesting good market fit and guest satisfaction.
- Typical properties (Median) have an occupancy rate around 47%.
- Entry-level properties (Bottom 25%) average 31% occupancy, potentially facing higher vacancy.
Average Monthly Occupancy Rate Trend in Woodmoor
Average Daily Rate (ADR) Airbnb Trends in Woodmoor (2026)
Effective short term rental pricing strategy in Woodmoor involves understanding monthly ADR fluctuations. The Average Daily Rate (ADR) for Airbnb in Woodmoor typically peaks in June and dips lowest during February. Leveraging Airbnb dynamic pricing tools or strategies based on this seasonality can significantly boost revenue. Here's a look at the typical nightly rates achieved:
- Best-in-class properties (Top 10%) command rates of $629+ per night, often due to premium features or locations.
- Strong performing properties (Top 25%) achieve nightly rates of $470 or more.
- Typical properties (Median) charge around $327 per night.
- Entry-level properties (Bottom 25%) earn around $151 per night.
Average Daily Rate (ADR) Trend by Month in Woodmoor
Get Live Woodmoor Market Intelligence 👇

Explore Real-time Analytics
Airbnb Seasonality Analysis & Trends in Woodmoor (2026)
Peak Season (July, June, August)
- Revenue averages $8,341 per month
- Occupancy rates average 64.8%
- Daily rates average $385
Shoulder Season
- Revenue averages $5,433 per month
- Occupancy maintains around 46.6%
- Daily rates hold near $345
Low Season (January, February, April)
- Revenue drops to average $3,081 per month
- Occupancy decreases to average 33.9%
- Daily rates adjust to average $302
Seasonality Insights for Woodmoor
- The Airbnb seasonality in Woodmoor shows highly seasonal trends requiring careful strategy. While the sections above show seasonal averages, it's also insightful to look at the extremes:
- During the high season, the absolute peak month showcases Woodmoor's highest earning potential, with monthly revenues capable of climbing to $9,500, occupancy reaching a high of 70.7%, and ADRs peaking at $395.
- Conversely, the slowest single month of the year, typically falling within the low season, marks the market's lowest point. In this month, revenue might dip to $2,327, occupancy could drop to 28.5%, and ADRs may adjust down to $286.
- Understanding both the seasonal averages and these monthly peaks and troughs in revenue, occupancy, and ADR is crucial for maximizing your Airbnb profit potential in Woodmoor.
Seasonal Strategies for Maximizing Profit
- Peak Season: Maximize revenue through premium pricing and potentially longer minimum stays. Ensure high availability.
- Low Season: Offer competitive pricing, special promotions (e.g., extended stay discounts), and flexible cancellation policies. Target off-season travelers like remote workers or budget-conscious guests.
- Shoulder Seasons: Implement dynamic pricing that balances peak and low rates. Target weekend travelers or specific events. Offer slightly more flexible terms than peak season.
- Regularly analyze your own performance against these Woodmoor seasonality benchmarks and adjust your pricing and availability strategy accordingly.
Best Areas for Airbnb Investment in Woodmoor (2026)
Exploring the top neighborhoods for short-term rentals in Woodmoor? This section highlights key areas, outlining why they are attractive for hosts and guests, along with notable local attractions. Consider these locations based on your target guest profile and investment strategy.
| Neighborhood / Area | Why Host Here? (Target Guests & Appeal) | Key Attractions & Landmarks |
|---|---|---|
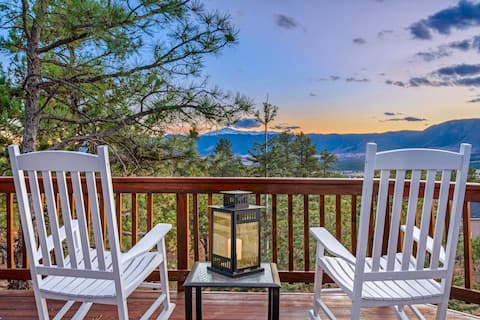
| Woodmoor Lake | Scenic views and outdoor recreation opportunities. Ideal for guests looking to enjoy nature, hiking, and fishing in a peaceful wooded setting. | Woodmoor Lake, Monument Valley Park, Bear Creek Regional Park, Pike National Forest, Palmer Lake |
| Woodmoor Golf Club | Attracts golf enthusiasts and visitors who enjoy a luxurious and relaxed atmosphere. Close to golf courses and country club amenities. | Woodmoor Golf Club, The Country Club of Colorado, Flying Horse Country Club, The Broadmoor Hotel, Perry Park Country Club |
| Lone Tree | A growing suburb with great dining and shopping options. Popular among families and business travelers looking for suburban comfort with urban convenience. | Park Meadows Mall, Lone Tree Arts Center, Bluffs Regional Park, Sky Ridge Medical Center, Lone Tree Brewing Company |
| Tri-Lakes | A large area encompassing several towns, appealing to outdoorsy types and families. Close to hiking, biking, and scenic beauty. | Pikes Peak, Lake Woodmoor, Palmer Lake, Blacks Wetlands, North Slope Recreation Area |
| Black Forest | Known for its stunning landscapes and large pine forests, attracting those who want a peaceful retreat while still being near Colorado Springs. | Black Forest Regional Park, Paint Mines Interpretive Park, Black Forest Wilderness Area, Fox Run Regional Park, Pikes Peak |
| Flying Horse | An upscale community offering luxury living and family-friendly amenities. Great for hosting guests looking for refined comfort and beautiful surroundings. | Flying Horse Golf Club, The Village at Flying Horse, Flying Horse Spa, Glen Eagle Golf Club, Pikes Peak |
Understanding Airbnb License Requirements & STR Laws in Woodmoor (2026)
While Woodmoor, Colorado, United States currently shows low STR regulations, specific Airbnb license requirements might still exist or change. Always verify the latest short term rental regulations and Airbnb license requirements directly with local government authorities for Woodmoor to ensure full compliance before hosting.
(Source: AirROI data, 2026, finding no licensed listings among those analyzed)
Top Performing Airbnb Properties in Woodmoor (2026)
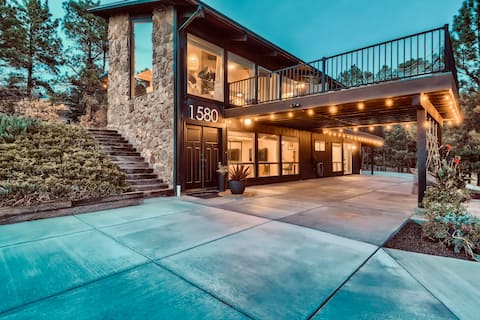
Benchmark your potential! Explore examples of top-performing Airbnb properties in Woodmoorbased on Trailing Twelve Month (TTM) revenue. Analyze their characteristics, revenue, occupancy rate, and ADR to understand what drives success in this market.

Golf Mansion Retreat I By Hotel Home Stays
Entire Place • 7 bedrooms

Contemporary Mtn 4 BDRM + Hot Tub Close to USAFA
Entire Place • 4 bedrooms
Casamigos-Vintage Modern Home in the Trees w/Views
Entire Place • 5 bedrooms

Falcon View House
Entire Place • 4 bedrooms
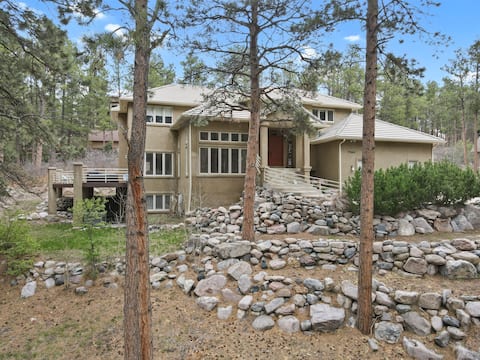
Expansive Monument Home: Hot Tub & Mountain Views!
Entire Place • 4 bedrooms
Spacious Family Home*Hot tub*near Air Force
Entire Place • 6 bedrooms
Note: Performance varies based on location, size, amenities, seasonality, and management quality. Data reflects the past 12 months.
Top Performing Airbnb Hosts in Woodmoor (2026)
Learn from the best! This table showcases top-performing Airbnb hosts in Woodmoor based on the number of properties managed and estimated total revenue over the past year. Analyze their scale and performance metrics.
| Host Name | Properties | Grossing Revenue | Stay Reviews | Avg Rating |
|---|---|---|---|---|
| Kaitlyn At Renjoy | 7 | $415,067 | 495 | 4.81/5.0 |
| Philip | 4 | $230,720 | 175 | 4.76/5.0 |
| Rebekah | 1 | $199,400 | 38 | 4.87/5.0 |
| Kerri | 1 | $153,258 | 120 | 4.99/5.0 |
| Charli And Mike | 1 | $132,241 | 103 | 5.00/5.0 |
| Brian And Tama | 1 | $128,604 | 33 | 5.00/5.0 |
| Evolve | 1 | $126,493 | 48 | 4.94/5.0 |
| Peak Hospitality Vacations | 1 | $121,159 | 37 | 4.57/5.0 |
| Kara | 1 | $107,161 | 55 | 4.96/5.0 |
| Lois | 1 | $80,663 | 61 | 4.98/5.0 |
Analyzing the strategies of top hosts, such as their property selection, pricing, and guest communication, can offer valuable lessons for optimizing your own Airbnb operations in Woodmoor.
Dive Deeper: Advanced Woodmoor STR Market Data (2026)
Ready to unlock more insights? AirROI provides access to advanced metrics and comprehensive Airbnb data for Woodmoor. Explore detailed analytics beyond this report to refine your investment strategy, optimize pricing, and maximize your vacation rental profits.
Explore Advanced MetricsWoodmoor Short-Term Rental Market Composition (2026): Property & Room Types
Room Type Distribution
Property Type Distribution
Market Composition Insights for Woodmoor
- The Woodmoor Airbnb market composition is heavily skewed towards Entire Home/Apt listings, which make up 90.7% of the 43 active rentals. This indicates strong guest preference for privacy and space.
- Looking at the property type distribution in Woodmoor, House properties are the most common (76.7%), reflecting the local real estate landscape.
- Houses represent a significant 76.7% portion, catering likely to families or larger groups.
- Smaller segments like outdoor/unique (combined 2.3%) offer potential for unique stay experiences.
Woodmoor Airbnb Room Capacity Analysis (2026): Bedroom Distribution
Distribution of Listings by Number of Bedrooms
Room Capacity Insights for Woodmoor
- The dominant room capacity in Woodmoor is 4 bedrooms listings, making up 27.9% of the market. This suggests a strong demand for properties suitable for families or small groups.
- Together, 4 bedrooms and 5+ bedrooms properties represent 53.5% of the active Airbnb listings in Woodmoor, indicating a high concentration in these sizes.
- A significant 69.8% of listings offer 3+ bedrooms, catering to larger groups and families seeking more space in Woodmoor.
Woodmoor Vacation Rental Guest Capacity Trends (2026)
Distribution of Listings by Guest Capacity
Guest Capacity Insights for Woodmoor
- The most common guest capacity trend in Woodmoor vacation rentals is listings accommodating 8+ guests (62.8%). This suggests the primary traveler segment is likely larger groups.
- Properties designed for 8+ guests and 4 guests dominate the Woodmoor STR market, accounting for 76.8% of listings.
- 74.4% of properties accommodate 6+ guests, serving the market segment for larger families or group travel in Woodmoor.
- On average, properties in Woodmoor are equipped to host 6.4 guests.
Woodmoor Airbnb Booking Patterns (2026): Available vs. Booked Days
Available Days Distribution
Booked Days Distribution
Booking Pattern Insights for Woodmoor
- The most common availability pattern in Woodmoor falls within the 181-270 days range, representing 37.2% of listings. This suggests many properties have significant open periods on their calendars.
- Approximately 67.4% of listings show high availability (181+ days open annually), indicating potential for increased bookings or specific owner usage patterns.
- For booked days, the 91-180 days range is most frequent in Woodmoor (39.5%), reflecting common guest stay durations or potential owner blocking patterns.
- A notable 34.9% of properties secure long booking periods (181+ days booked per year), highlighting successful long-term rental strategies or significant owner usage.
Woodmoor Airbnb Minimum Stay Requirements Analysis
Distribution of Listings by Minimum Night Requirement
1 Night
2 listings
4.7% of total
2 Nights
21 listings
48.8% of total
3 Nights
2 listings
4.7% of total
4-6 Nights
2 listings
4.7% of total
7-29 Nights
1 listings
2.3% of total
30+ Nights
15 listings
34.9% of total
Key Insights
- The most prevalent minimum stay requirement in Woodmoor is 2 Nights, adopted by 48.8% of listings. This highlights the market's preference for shorter, flexible bookings.
- A significant segment (34.9%) caters to monthly stays (30+ nights) in Woodmoor, pointing to opportunities in the extended-stay market.
Recommendations
- Align with the market by considering a 2 Nights minimum stay, as 48.8% of Woodmoor hosts use this setting.
- If feasible, allowing 1-night stays, especially midweek or during low season, could capture last-minute bookings, as only 4.7% currently do.
- A 2-night minimum appears standard (48.8%). Consider this for weekends or peak periods.
- Explore offering discounts for stays of 30+ nights to attract the 34.9% of the market seeking extended stays.
- Adjust minimum nights based on seasonality – potentially shorter during low season and longer during peak demand periods in Woodmoor.
Woodmoor Airbnb Cancellation Policy Trends Analysis (2026)
Limited
1 listings
2.3% of total
Super Strict 30 Days
2 listings
4.7% of total
Flexible
7 listings
16.3% of total
Moderate
17 listings
39.5% of total
Firm
12 listings
27.9% of total
Strict
4 listings
9.3% of total
Cancellation Policy Insights for Woodmoor
- The prevailing Airbnb cancellation policy trend in Woodmoor is Moderate, used by 39.5% of listings.
- There's a relatively balanced mix between guest-friendly (55.8%) and stricter (37.2%) policies, offering choices for different guest needs.
- Strict cancellation policies are quite rare (9.3%), potentially making listings with this policy less competitive unless justified by high demand or property type.
Recommendations for Hosts
- Consider adopting a Moderate policy to align with the 39.5% market standard in Woodmoor.
- Using a Strict policy might deter some guests, as only 9.3% of listings use it. Evaluate if potential revenue protection outweighs possible lower booking rates.
- Regularly review your cancellation policy against competitors and market demand shifts in Woodmoor.
Woodmoor STR Booking Lead Time Analysis (2026)
Average Booking Lead Time by Month
Booking Lead Time Insights for Woodmoor
- The overall average booking lead time for vacation rentals in Woodmoor is 61 days.
- Guests book furthest in advance for stays during May (average 105 days), likely coinciding with peak travel demand or local events.
- The shortest booking windows occur for stays in February (average 25 days), indicating more last-minute travel plans during this time.
- Seasonally, Summer (65 days avg.) sees the longest lead times, while Winter (43 days avg.) has the shortest, reflecting typical travel planning cycles.
Recommendations for Hosts
- Use the overall average lead time (61 days) as a baseline for your pricing and availability strategy in Woodmoor.
- For May stays, consider implementing length-of-stay discounts or slightly higher rates for bookings made less than 105 days out to capitalize on advance planning.
- Target marketing efforts for the Summer season well in advance (at least 65 days) to capture early planners.
- Monitor your own booking lead times against these Woodmoor averages to identify opportunities for dynamic pricing adjustments.
Popular & Essential Airbnb Amenities in Woodmoor (2026)
Amenity Prevalence
Amenity Insights for Woodmoor
- Essential amenities in Woodmoor that guests expect include: Hot water, Hair dryer, Heating, Smoke alarm, Carbon monoxide alarm, TV, Hangers, Wifi, Essentials, Iron. Lacking these (any) could significantly impact bookings.
Recommendations for Hosts
- Ensure your listing includes all essential amenities for Woodmoor: Hot water, Hair dryer, Heating, Smoke alarm, Carbon monoxide alarm, TV, Hangers, Wifi, Essentials, Iron.
- Prioritize adding missing essentials: Wifi, Essentials, Iron.
- Highlight unique or less common amenities you offer (e.g., hot tub, dedicated workspace, EV charger) in your listing description and photos.
- Regularly check competitor amenities in Woodmoor to stay competitive.
Woodmoor Airbnb Guest Demographics & Profile Analysis (2026)
Guest Profile Summary for Woodmoor
- The typical guest profile for Airbnb in Woodmoor consists of primarily domestic travelers (97%), often arriving from nearby Denver, typically belonging to the Post-2000s (Gen Z/Alpha) group (50%), primarily speaking English or Spanish.
- Domestic travelers account for 96.9% of guests.
- Key international markets include United States (96.9%) and Canada (0.6%).
- Top languages spoken are English (82.6%) followed by Spanish (11.9%).
- A significant demographic segment is the Post-2000s (Gen Z/Alpha) group, representing 50% of guests.
Recommendations for Hosts
- Target domestic marketing efforts towards travelers from Denver and Colorado Springs.
- Tailor amenities and listing descriptions to appeal to the dominant Post-2000s (Gen Z/Alpha) demographic (e.g., highlight fast WiFi, smart home features, local guides).
- Highlight unique local experiences or amenities relevant to the primary guest profile.
- Consider seasonal promotions aligned with peak travel times for key origin markets.
Nearby Short-Term Rental Market Comparison
How does the Woodmoor Airbnb market stack up against its neighbors? Compare key performance metrics like average monthly revenue, ADR, and occupancy rates in surrounding areas to understand the broader regional STR landscape.
| Market | Active Properties | Monthly Revenue | Daily Rate | Avg. Occupancy |
|---|---|---|---|---|
| Aspen Park | 11 | $5,825 | $395.00 | 54% |
| Indian Hills | 11 | $5,799 | $333.03 | 54% |
| Grand County | 14 | $5,137 | $513.48 | 42% |
| Black Hawk | 133 | $4,884 | $328.37 | 52% |
| Central City | 10 | $4,789 | $318.09 | 52% |
| Bailey | 126 | $4,611 | $310.32 | 53% |
| Cascade-Chipita Park | 103 | $4,541 | $330.50 | 52% |
| Estes Park | 1,311 | $4,504 | $383.02 | 45% |
| Applewood | 18 | $4,400 | $269.95 | 56% |
| Golden | 276 | $4,261 | $301.62 | 54% |