Western Hills Airbnb Market Analysis 2026: Short Term Rental Data & Vacation Rental Statistics in Colorado, United States
Is Airbnb profitable in Western Hills in 2026? Explore comprehensive Airbnb analytics for Western Hills, Colorado, United States to uncover income potential. This 2026 STR market report for Western Hills, based on AirROI data from February 2025 to January 2026, reveals key trends in the niche market of 142 active listings.
Whether you're considering an Airbnb investment in Western Hills, optimizing your existing vacation rental, or exploring rental arbitrage opportunities, understanding the Western Hills Airbnb data is crucial. Leveraging the low regulation environment is key to maximizing your short term rental income potential. Let's dive into the specifics.
Key Western Hills Airbnb Performance Metrics Overview
Monthly Airbnb Revenue Variations & Income Potential in Western Hills (2026)
Understanding the monthly revenue variations for Airbnb listings in Western Hills is key to maximizing your short term rental income potential. Seasonality significantly impacts earnings. Our analysis, based on data from the past 12 months, shows that the peak revenue month for STRs in Western Hills is typically July, while April often presents the lowest earnings, highlighting opportunities for strategic pricing adjustments during shoulder and low seasons. Explore the typical Airbnb income in Western Hills across different performance tiers:
- Best-in-class properties (Top 10%) achieve $6,803+ monthly, often utilizing dynamic pricing and superior guest experiences.
- Strong performing properties (Top 25%) earn $4,660 or more, indicating effective management and desirable locations/amenities.
- Typical properties (Median) generate around $2,863 per month, representing the average market performance.
- Entry-level properties (Bottom 25%) see earnings around $1,155, often with potential for optimization.
Average Monthly Airbnb Earnings Trend in Western Hills
Western Hills Airbnb Occupancy Rate Trends (2026)
Maximize your bookings by understanding the Western Hills STR occupancy trends. Seasonal demand shifts significantly influence how often properties are booked. Typically, Julysees the highest demand (peak season occupancy), while January experiences the lowest (low season). Effective strategies, like adjusting minimum stays or offering promotions, can boost occupancy during slower periods. Here's how different property tiers perform in Western Hills:
- Best-in-class properties (Top 10%) achieve 85%+ occupancy, indicating high desirability and potentially optimized availability.
- Strong performing properties (Top 25%) maintain 72% or higher occupancy, suggesting good market fit and guest satisfaction.
- Typical properties (Median) have an occupancy rate around 52%.
- Entry-level properties (Bottom 25%) average 27% occupancy, potentially facing higher vacancy.
Average Monthly Occupancy Rate Trend in Western Hills
Average Daily Rate (ADR) Airbnb Trends in Western Hills (2026)
Effective short term rental pricing strategy in Western Hills involves understanding monthly ADR fluctuations. The Average Daily Rate (ADR) for Airbnb in Western Hills typically peaks in June and dips lowest during February. Leveraging Airbnb dynamic pricing tools or strategies based on this seasonality can significantly boost revenue. Here's a look at the typical nightly rates achieved:
- Best-in-class properties (Top 10%) command rates of $399+ per night, often due to premium features or locations.
- Strong performing properties (Top 25%) achieve nightly rates of $276 or more.
- Typical properties (Median) charge around $186 per night.
- Entry-level properties (Bottom 25%) earn around $114 per night.
Average Daily Rate (ADR) Trend by Month in Western Hills
Get Live Western Hills Market Intelligence 👇

Explore Real-time Analytics
Airbnb Seasonality Analysis & Trends in Western Hills (2026)
Peak Season (July, June, September)
- Revenue averages $4,493 per month
- Occupancy rates average 58.0%
- Daily rates average $235
Shoulder Season
- Revenue averages $3,308 per month
- Occupancy maintains around 47.7%
- Daily rates hold near $219
Low Season (February, March, April)
- Revenue drops to average $2,273 per month
- Occupancy decreases to average 47.0%
- Daily rates adjust to average $177
Seasonality Insights for Western Hills
- The Airbnb seasonality in Western Hills shows highly seasonal trends requiring careful strategy. While the sections above show seasonal averages, it's also insightful to look at the extremes:
- During the high season, the absolute peak month showcases Western Hills's highest earning potential, with monthly revenues capable of climbing to $5,146, occupancy reaching a high of 60.8%, and ADRs peaking at $242.
- Conversely, the slowest single month of the year, typically falling within the low season, marks the market's lowest point. In this month, revenue might dip to $2,074, occupancy could drop to 40.3%, and ADRs may adjust down to $172.
- Understanding both the seasonal averages and these monthly peaks and troughs in revenue, occupancy, and ADR is crucial for maximizing your Airbnb profit potential in Western Hills.
Seasonal Strategies for Maximizing Profit
- Peak Season: Maximize revenue through premium pricing and potentially longer minimum stays. Ensure high availability.
- Low Season: Offer competitive pricing, special promotions (e.g., extended stay discounts), and flexible cancellation policies. Target off-season travelers like remote workers or budget-conscious guests.
- Shoulder Seasons: Implement dynamic pricing that balances peak and low rates. Target weekend travelers or specific events. Offer slightly more flexible terms than peak season.
- Regularly analyze your own performance against these Western Hills seasonality benchmarks and adjust your pricing and availability strategy accordingly.
Best Areas for Airbnb Investment in Western Hills (2026)
Exploring the top neighborhoods for short-term rentals in Western Hills? This section highlights key areas, outlining why they are attractive for hosts and guests, along with notable local attractions. Consider these locations based on your target guest profile and investment strategy.
| Neighborhood / Area | Why Host Here? (Target Guests & Appeal) | Key Attractions & Landmarks |
|---|---|---|
| Westwood | A charming neighborhood offering a blend of suburban tranquility and proximity to outdoor recreational activities, making it ideal for families and outdoor enthusiasts. | Red Rocks Park and Amphitheater, Kennesaw Mountain National Battlefield Park, Local parks and trails, Shopping and dining options in nearby Golden |
| Kittredge | Picturesque mountain town nestled near the foothills, known for its stunning natural scenery and quiet atmosphere, appealing to those seeking a peaceful retreat. | Mount Evans, Bear Creek Canyon, Hiking trails, Unique local shops and cafes |
| Evergreen | A serene community surrounded by nature, with a strong emphasis on outdoor activities and a charming small-town feel, perfect for weekend getaways. | Evergreen Lake, Elk Meadow Park, Local art galleries, Restaurants with mountain views |
| Conifer | Known for its beautiful mountain views and access to hiking and biking trails, this area attracts nature lovers and adventurers year-round. | Lair o' the Bear Park, South Platte River, Biking and hiking trails, Local markets and eateries |
| Morrison | Home to the famous Red Rocks, this little town is ideal for tourists looking to enjoy concerts, cultural events, and outdoor activities in an iconic setting. | Red Rocks Amphitheatre, Dinosaur Ridge, Morrison Natural History Museum, Local dining experiences |
| Idaho Springs | A historic mining town famous for its mineral springs, providing a quaint experience for visitors interested in history and the great outdoors. | Cave of the Winds Mountain Park, St. Mary's Glacier, Historic downtown, Ski resorts close by |
| Lakewood | A vibrant and diverse city with great access to parks and outdoor activities, as well as a range of cultural and entertainment options. | Bear Creek Lake Park, Lakewood Heritage Center, Local breweries and wineries, Shopping centers |
| Golden | Rich in history and natural beauty, Golden is known for its charming downtown and proximity to outdoor adventure, attracting a mix of tourists and locals. | Coors Brewery, Buffalo Bill Museum and Grave, Clear Creek, Hiking in nearby foothills |
Understanding Airbnb License Requirements & STR Laws in Western Hills (2026)
While Western Hills, Colorado, United States currently shows low STR regulations, specific Airbnb license requirements might still exist or change. Always verify the latest short term rental regulations and Airbnb license requirements directly with local government authorities for Western Hills to ensure full compliance before hosting.
(Source: AirROI data, 2026, based on 1% licensed listings)
Top Performing Airbnb Properties in Western Hills (2026)
Benchmark your potential! Explore examples of top-performing Airbnb properties in Western Hillsbased on Trailing Twelve Month (TTM) revenue. Analyze their characteristics, revenue, occupancy rate, and ADR to understand what drives success in this market.

Denver Insta-Perfect Girls Trip!
Entire Place • 4 bedrooms

HOT: Tulum Theme|Hot Tub|Games|10 min to Downtown
Entire Place • 4 bedrooms
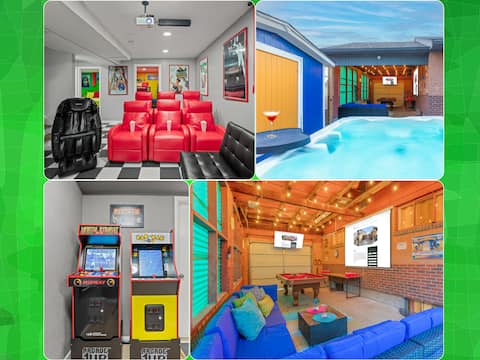
HotTub Theater Gameroom Outdoor PoolTable 420
Entire Place • 5 bedrooms

420 HotTub PS5 Arcade Theater PoolTable Sauna Pole
Entire Place • 8 bedrooms

Colorful Getaway | Hot Tub + Enchanting Yard
Entire Place • 5 bedrooms

The Neon Cowboy! Hot tub | Fire Pit | Theater
Entire Place • 6 bedrooms
Note: Performance varies based on location, size, amenities, seasonality, and management quality. Data reflects the past 12 months.
Top Performing Airbnb Hosts in Western Hills (2026)
Learn from the best! This table showcases top-performing Airbnb hosts in Western Hills based on the number of properties managed and estimated total revenue over the past year. Analyze their scale and performance metrics.
| Host Name | Properties | Grossing Revenue | Stay Reviews | Avg Rating |
|---|---|---|---|---|
| AirSimplicity | 3 | $260,719 | 287 | 4.85/5.0 |
| Shaquan | 2 | $218,296 | 189 | 4.86/5.0 |
| Jesse | 3 | $179,165 | 1467 | 4.85/5.0 |
| Kim And Ben Homes With Hospita | 5 | $156,220 | 93 | 4.95/5.0 |
| Ana | 3 | $127,317 | 712 | 4.77/5.0 |
| Shana | 1 | $120,775 | 43 | 4.98/5.0 |
| Kaitlin | 3 | $118,521 | 290 | 4.88/5.0 |
| Cecilia | 1 | $116,943 | 136 | 4.79/5.0 |
| Max | 1 | $105,254 | 97 | 4.86/5.0 |
| Kendra | 3 | $105,232 | 243 | 4.85/5.0 |
Analyzing the strategies of top hosts, such as their property selection, pricing, and guest communication, can offer valuable lessons for optimizing your own Airbnb operations in Western Hills.
Dive Deeper: Advanced Western Hills STR Market Data (2026)
Ready to unlock more insights? AirROI provides access to advanced metrics and comprehensive Airbnb data for Western Hills. Explore detailed analytics beyond this report to refine your investment strategy, optimize pricing, and maximize your vacation rental profits.
Explore Advanced MetricsWestern Hills Short-Term Rental Market Composition (2026): Property & Room Types
Room Type Distribution
Property Type Distribution
Market Composition Insights for Western Hills
- The Western Hills Airbnb market composition is heavily skewed towards Entire Home/Apt listings, which make up 83.1% of the 142 active rentals. This indicates strong guest preference for privacy and space.
- Looking at the property type distribution in Western Hills, House properties are the most common (81.7%), reflecting the local real estate landscape.
- Houses represent a significant 81.7% portion, catering likely to families or larger groups.
- Smaller segments like apartment/condo, outdoor/unique (combined 4.2%) offer potential for unique stay experiences.
Western Hills Airbnb Room Capacity Analysis (2026): Bedroom Distribution
Distribution of Listings by Number of Bedrooms
Room Capacity Insights for Western Hills
- The dominant room capacity in Western Hills is 4 bedrooms listings, making up 21.8% of the market. This suggests a strong demand for properties suitable for families or small groups.
- Together, 4 bedrooms and 2 bedrooms properties represent 42.2% of the active Airbnb listings in Western Hills, indicating a high concentration in these sizes.
- A significant 54.2% of listings offer 3+ bedrooms, catering to larger groups and families seeking more space in Western Hills.
Western Hills Vacation Rental Guest Capacity Trends (2026)
Distribution of Listings by Guest Capacity
Guest Capacity Insights for Western Hills
- The most common guest capacity trend in Western Hills vacation rentals is listings accommodating 8+ guests (43%). This suggests the primary traveler segment is likely larger groups.
- Properties designed for 8+ guests and 6 guests dominate the Western Hills STR market, accounting for 59.2% of listings.
- 61.3% of properties accommodate 6+ guests, serving the market segment for larger families or group travel in Western Hills.
- On average, properties in Western Hills are equipped to host 5.4 guests.
Western Hills Airbnb Booking Patterns (2026): Available vs. Booked Days
Available Days Distribution
Booked Days Distribution
Booking Pattern Insights for Western Hills
- The most common availability pattern in Western Hills falls within the 271-366 days range, representing 33.1% of listings. This suggests many properties have significant open periods on their calendars.
- Approximately 60.6% of listings show high availability (181+ days open annually), indicating potential for increased bookings or specific owner usage patterns.
- For booked days, the 181-270 days range is most frequent in Western Hills (32.4%), reflecting common guest stay durations or potential owner blocking patterns.
- A notable 40.9% of properties secure long booking periods (181+ days booked per year), highlighting successful long-term rental strategies or significant owner usage.
Western Hills Airbnb Minimum Stay Requirements Analysis
Distribution of Listings by Minimum Night Requirement
1 Night
50 listings
35.2% of total
2 Nights
28 listings
19.7% of total
3 Nights
9 listings
6.3% of total
7-29 Nights
10 listings
7% of total
30+ Nights
45 listings
31.7% of total
Key Insights
- The most prevalent minimum stay requirement in Western Hills is 1 Night, adopted by 35.2% of listings. This highlights the market's preference for shorter, flexible bookings.
- A significant segment (31.7%) caters to monthly stays (30+ nights) in Western Hills, pointing to opportunities in the extended-stay market.
Recommendations
- Align with the market by considering a 1 Night minimum stay, as 35.2% of Western Hills hosts use this setting.
- Explore offering discounts for stays of 30+ nights to attract the 31.7% of the market seeking extended stays.
- Adjust minimum nights based on seasonality – potentially shorter during low season and longer during peak demand periods in Western Hills.
Western Hills Airbnb Cancellation Policy Trends Analysis (2026)
Super Strict 60 Days
1 listings
0.7% of total
Limited
2 listings
1.4% of total
Flexible
20 listings
14.1% of total
Moderate
50 listings
35.2% of total
Firm
43 listings
30.3% of total
Strict
26 listings
18.3% of total
Cancellation Policy Insights for Western Hills
- The prevailing Airbnb cancellation policy trend in Western Hills is Moderate, used by 35.2% of listings.
- There's a relatively balanced mix between guest-friendly (49.3%) and stricter (48.6%) policies, offering choices for different guest needs.
Recommendations for Hosts
- Consider adopting a Moderate policy to align with the 35.2% market standard in Western Hills.
- Regularly review your cancellation policy against competitors and market demand shifts in Western Hills.
Western Hills STR Booking Lead Time Analysis (2026)
Average Booking Lead Time by Month
Booking Lead Time Insights for Western Hills
- The overall average booking lead time for vacation rentals in Western Hills is 27 days.
- Guests book furthest in advance for stays during June (average 46 days), likely coinciding with peak travel demand or local events.
- The shortest booking windows occur for stays in February (average 17 days), indicating more last-minute travel plans during this time.
- Seasonally, Summer (37 days avg.) sees the longest lead times, while Winter (23 days avg.) has the shortest, reflecting typical travel planning cycles.
Recommendations for Hosts
- Use the overall average lead time (27 days) as a baseline for your pricing and availability strategy in Western Hills.
- For June stays, consider implementing length-of-stay discounts or slightly higher rates for bookings made less than 46 days out to capitalize on advance planning.
- Target marketing efforts for the Summer season well in advance (at least 37 days) to capture early planners.
- Monitor your own booking lead times against these Western Hills averages to identify opportunities for dynamic pricing adjustments.
Popular & Essential Airbnb Amenities in Western Hills (2026)
Amenity Prevalence
Amenity Insights for Western Hills
- Essential amenities in Western Hills that guests expect include: Wifi, Carbon monoxide alarm, Smoke alarm, TV, Hot water, Heating, Coffee maker. Lacking these (any) could significantly impact bookings.
- Popular amenities like Air conditioning, Refrigerator, Microwave are common but not universal. Offering these can provide a competitive edge.
Recommendations for Hosts
- Ensure your listing includes all essential amenities for Western Hills: Wifi, Carbon monoxide alarm, Smoke alarm, TV, Hot water, Heating, Coffee maker.
- Prioritize adding missing essentials: Carbon monoxide alarm, Smoke alarm, TV, Hot water, Heating, Coffee maker.
- Consider adding popular differentiators like Air conditioning or Refrigerator to increase appeal.
- Highlight unique or less common amenities you offer (e.g., hot tub, dedicated workspace, EV charger) in your listing description and photos.
- Regularly check competitor amenities in Western Hills to stay competitive.
Western Hills Airbnb Guest Demographics & Profile Analysis (2026)
Guest Profile Summary for Western Hills
- The typical guest profile for Airbnb in Western Hills consists of primarily domestic travelers (95%), often arriving from nearby Denver, typically belonging to the Post-2000s (Gen Z/Alpha) group (50%), primarily speaking English or Spanish.
- Domestic travelers account for 94.6% of guests.
- Key international markets include United States (94.6%) and Canada (0.8%).
- Top languages spoken are English (67.2%) followed by Spanish (18.8%).
- A significant demographic segment is the Post-2000s (Gen Z/Alpha) group, representing 50% of guests.
Recommendations for Hosts
- Target domestic marketing efforts towards travelers from Denver and Albuquerque.
- Tailor amenities and listing descriptions to appeal to the dominant Post-2000s (Gen Z/Alpha) demographic (e.g., highlight fast WiFi, smart home features, local guides).
- Highlight unique local experiences or amenities relevant to the primary guest profile.
- Consider seasonal promotions aligned with peak travel times for key origin markets.
Nearby Short-Term Rental Market Comparison
How does the Western Hills Airbnb market stack up against its neighbors? Compare key performance metrics like average monthly revenue, ADR, and occupancy rates in surrounding areas to understand the broader regional STR landscape.
| Market | Active Properties | Monthly Revenue | Daily Rate | Avg. Occupancy |
|---|---|---|---|---|
| Aspen Park | 11 | $5,825 | $395.00 | 54% |
| Indian Hills | 11 | $5,799 | $333.03 | 54% |
| Grand County | 14 | $5,137 | $513.48 | 42% |
| Black Hawk | 133 | $4,884 | $328.37 | 52% |
| Central City | 10 | $4,789 | $318.09 | 52% |
| Bailey | 126 | $4,611 | $310.32 | 53% |
| Cascade-Chipita Park | 103 | $4,541 | $330.50 | 52% |
| Estes Park | 1,311 | $4,504 | $383.02 | 45% |
| Woodmoor | 43 | $4,444 | $335.63 | 46% |
| Applewood | 18 | $4,400 | $269.95 | 56% |