Snowmass Village Airbnb Market Analysis 2026: Short Term Rental Data & Vacation Rental Statistics in Colorado, United States
Is Airbnb profitable in Snowmass Village in 2026? Explore comprehensive Airbnb analytics for Snowmass Village, Colorado, United States to uncover income potential. This 2026 STR market report for Snowmass Village, based on AirROI data from February 2025 to January 2026, reveals key trends in the market of 636 active listings.
Whether you're considering an Airbnb investment in Snowmass Village, optimizing your existing vacation rental, or exploring rental arbitrage opportunities, understanding the Snowmass Village Airbnb data is crucial. Leveraging the low regulation environment is key to maximizing your short term rental income potential. Let's dive into the specifics.
Key Snowmass Village Airbnb Performance Metrics Overview
Monthly Airbnb Revenue Variations & Income Potential in Snowmass Village (2026)
Understanding the monthly revenue variations for Airbnb listings in Snowmass Village is key to maximizing your short term rental income potential. Seasonality significantly impacts earnings. Our analysis, based on data from the past 12 months, shows that the peak revenue month for STRs in Snowmass Village is typically February, while May often presents the lowest earnings, highlighting opportunities for strategic pricing adjustments during shoulder and low seasons. Explore the typical Airbnb income in Snowmass Village across different performance tiers:
- Best-in-class properties (Top 10%) achieve $15,349+ monthly, often utilizing dynamic pricing and superior guest experiences.
- Strong performing properties (Top 25%) earn $9,716 or more, indicating effective management and desirable locations/amenities.
- Typical properties (Median) generate around $5,930 per month, representing the average market performance.
- Entry-level properties (Bottom 25%) see earnings around $3,057, often with potential for optimization.
Average Monthly Airbnb Earnings Trend in Snowmass Village
Snowmass Village Airbnb Occupancy Rate Trends (2026)
Maximize your bookings by understanding the Snowmass Village STR occupancy trends. Seasonal demand shifts significantly influence how often properties are booked. Typically, Februarysees the highest demand (peak season occupancy), while April experiences the lowest (low season). Effective strategies, like adjusting minimum stays or offering promotions, can boost occupancy during slower periods. Here's how different property tiers perform in Snowmass Village:
- Best-in-class properties (Top 10%) achieve 71%+ occupancy, indicating high desirability and potentially optimized availability.
- Strong performing properties (Top 25%) maintain 54% or higher occupancy, suggesting good market fit and guest satisfaction.
- Typical properties (Median) have an occupancy rate around 36%.
- Entry-level properties (Bottom 25%) average 17% occupancy, potentially facing higher vacancy.
Average Monthly Occupancy Rate Trend in Snowmass Village
Average Daily Rate (ADR) Airbnb Trends in Snowmass Village (2026)
Effective short term rental pricing strategy in Snowmass Village involves understanding monthly ADR fluctuations. The Average Daily Rate (ADR) for Airbnb in Snowmass Village typically peaks in January and dips lowest during May. Leveraging Airbnb dynamic pricing tools or strategies based on this seasonality can significantly boost revenue. Here's a look at the typical nightly rates achieved:
- Best-in-class properties (Top 10%) command rates of $1,367+ per night, often due to premium features or locations.
- Strong performing properties (Top 25%) achieve nightly rates of $850 or more.
- Typical properties (Median) charge around $560 per night.
- Entry-level properties (Bottom 25%) earn around $402 per night.
Average Daily Rate (ADR) Trend by Month in Snowmass Village
Get Live Snowmass Village Market Intelligence 👇

Explore Real-time Analytics
Airbnb Seasonality Analysis & Trends in Snowmass Village (2026)
Peak Season (February, March, January)
- Revenue averages $14,571 per month
- Occupancy rates average 49.3%
- Daily rates average $1,048
Shoulder Season
- Revenue averages $6,048 per month
- Occupancy maintains around 34.6%
- Daily rates hold near $671
Low Season (May, September, October)
- Revenue drops to average $3,857 per month
- Occupancy decreases to average 31.6%
- Daily rates adjust to average $560
Seasonality Insights for Snowmass Village
- The Airbnb seasonality in Snowmass Village shows highly seasonal trends requiring careful strategy. While the sections above show seasonal averages, it's also insightful to look at the extremes:
- During the high season, the absolute peak month showcases Snowmass Village's highest earning potential, with monthly revenues capable of climbing to $17,280, occupancy reaching a high of 63.5%, and ADRs peaking at $1,141.
- Conversely, the slowest single month of the year, typically falling within the low season, marks the market's lowest point. In this month, revenue might dip to $3,597, occupancy could drop to 26.0%, and ADRs may adjust down to $552.
- Understanding both the seasonal averages and these monthly peaks and troughs in revenue, occupancy, and ADR is crucial for maximizing your Airbnb profit potential in Snowmass Village.
Seasonal Strategies for Maximizing Profit
- Peak Season: Maximize revenue through premium pricing and potentially longer minimum stays. Ensure high availability.
- Low Season: Offer competitive pricing, special promotions (e.g., extended stay discounts), and flexible cancellation policies. Target off-season travelers like remote workers or budget-conscious guests.
- Shoulder Seasons: Implement dynamic pricing that balances peak and low rates. Target weekend travelers or specific events. Offer slightly more flexible terms than peak season.
- Regularly analyze your own performance against these Snowmass Village seasonality benchmarks and adjust your pricing and availability strategy accordingly.
Best Areas for Airbnb Investment in Snowmass Village (2026)
Exploring the top neighborhoods for short-term rentals in Snowmass Village? This section highlights key areas, outlining why they are attractive for hosts and guests, along with notable local attractions. Consider these locations based on your target guest profile and investment strategy.
| Neighborhood / Area | Why Host Here? (Target Guests & Appeal) | Key Attractions & Landmarks |
|---|---|---|
| Snowmass Village Town Center | Heart of Snowmass Village with dining, shopping, and easy access to the ski slopes. Ideal for tourists looking for convenience and a vibrant atmosphere. | Snowmass Ski Area, Snowmass Hockey Arena, Base Village, Dining and shopping options, Shuttle access to Aspen |
| Ski-in/Ski-out Properties | Properties located directly on the slopes provide unbeatable convenience for skiing enthusiasts. Attracts families and groups looking for easy slope access. | Direct ski access, Mountain views, Quiet retreats, Resort amenities, Snowmass Club |
| Willow Creek | A quieter area offering a more residential feel while still being close to ski access and the village. Appeals to those seeking tranquility with outdoor activities. | Willow Creek Trail, Access to hiking and biking trails, Natural landscapes, Wildlife viewing, Lakes and streams |
| Upper Snowmass | Higher altitude properties providing stunning views and an exclusive feel. Attracts affluent visitors looking for luxury and privacy in their stay. | Apex Mountain, Private estates, Luxury lodges, Secluded hiking, Snowmass Mountain views |
| Snowmass Lake | Offers a serene experience with picturesque lake views. Ideal for travelers seeking relaxation and nature, with hiking trails nearby. | Snowmass Lake, Hiking trails, Picnic spots, Wildflower viewing, Fishing opportunities |
| Capitol Peak Lodge | A luxurious lodge offering high-end accommodations and amenities. Popular with visitors looking for upscale living and experiences in Snowmass. | Spa services, Fine dining, Ski concierge services, Gondola access, Luxury amenities |
| Ridge Run | Offers properties with panoramic views of the surrounding mountains. Ideal for visitors wanting to escape into nature while still being close to the village. | Stunning mountain views, Tranquil environment, Access to hiking trails, Near amenities, Wildlife spotting |
| Crested Butte Area | A short drive from Snowmass, known for its beautiful scenery and outdoor activities. Attracts nature lovers and outdoor enthusiasts. | Crested Butte Mountain Resort, Scenic drives, Outdoor festivals, Beautiful hiking trails, Wildflower scenery |
Understanding Airbnb License Requirements & STR Laws in Snowmass Village (2026)
While Snowmass Village, Colorado, United States currently shows low STR regulations, specific Airbnb license requirements might still exist or change. Always verify the latest short term rental regulations and Airbnb license requirements directly with local government authorities for Snowmass Village to ensure full compliance before hosting.
(Source: AirROI data, 2026, based on 6% licensed listings)
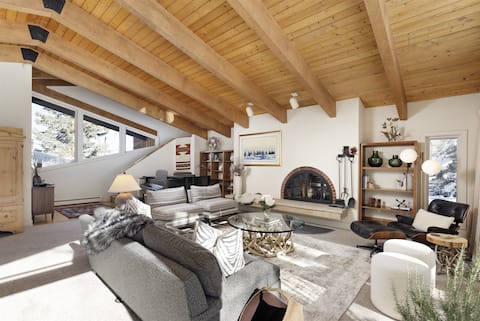
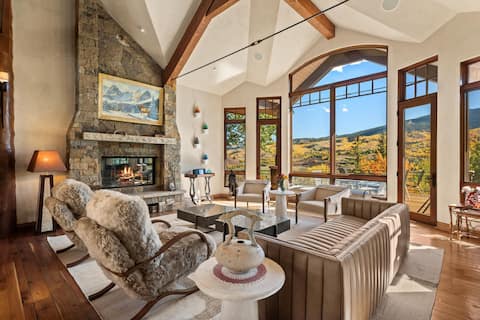
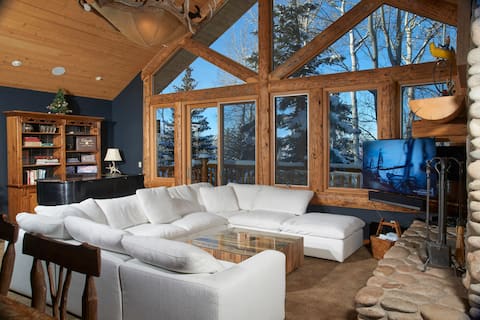
Top Performing Airbnb Properties in Snowmass Village (2026)
Benchmark your potential! Explore examples of top-performing Airbnb properties in Snowmass Villagebased on Trailing Twelve Month (TTM) revenue. Analyze their characteristics, revenue, occupancy rate, and ADR to understand what drives success in this market.

Galliwest~ Snowmass/Aspen, Colorado
Entire Place • 6 bedrooms
The Lupine Estate | Slopeside Ski In/Out Paradise
Entire Place • 5 bedrooms
Oak Ridge Chalet Snowmass Village
Entire Place • 5 bedrooms
Tall Timbers Lodge- Mtn Chic! 7-10 Min Walk to Ski
Entire Place • 5 bedrooms

Ultimate Ski-In/Ski-Out Luxury Penthouse Retreat!
Entire Place • 3 bedrooms

Ski-In/Out Snowmass W/Private Hot Tub & Balcony
Entire Place • 4 bedrooms
Note: Performance varies based on location, size, amenities, seasonality, and management quality. Data reflects the past 12 months.
Top Performing Airbnb Hosts in Snowmass Village (2026)
Learn from the best! This table showcases top-performing Airbnb hosts in Snowmass Village based on the number of properties managed and estimated total revenue over the past year. Analyze their scale and performance metrics.
| Host Name | Properties | Grossing Revenue | Stay Reviews | Avg Rating |
|---|---|---|---|---|
| ITrip Aspen Snowmass | 66 | $5,016,119 | 1349 | 4.90/5.0 |
| CoralTree Residence Collection | 72 | $3,740,019 | 2035 | 4.86/5.0 |
| Eliza | 59 | $3,420,033 | 2160 | 4.81/5.0 |
| CoralTree Residence Collection | 71 | $3,389,608 | 1612 | 4.81/5.0 |
| Timberline Condominiums | 77 | $2,797,749 | 1421 | 4.76/5.0 |
| Snowmass Vacation Rentals | 34 | $2,120,736 | 1349 | 4.68/5.0 |
| Snowmass Mountain Lodging | 45 | $1,864,300 | 127 | 4.80/5.0 |
| A Better Life | 21 | $1,478,468 | 392 | 4.91/5.0 |
| Frias Properties Of Aspen | 15 | $961,871 | 33 | 4.63/5.0 |
| Boutique Mountain | 3 | $673,836 | 53 | 4.80/5.0 |
Analyzing the strategies of top hosts, such as their property selection, pricing, and guest communication, can offer valuable lessons for optimizing your own Airbnb operations in Snowmass Village.
Dive Deeper: Advanced Snowmass Village STR Market Data (2026)
Ready to unlock more insights? AirROI provides access to advanced metrics and comprehensive Airbnb data for Snowmass Village. Explore detailed analytics beyond this report to refine your investment strategy, optimize pricing, and maximize your vacation rental profits.
Explore Advanced MetricsSnowmass Village Short-Term Rental Market Composition (2026): Property & Room Types
Room Type Distribution
Property Type Distribution
Market Composition Insights for Snowmass Village
- The Snowmass Village Airbnb market composition is heavily skewed towards Entire Home/Apt listings, which make up 98.1% of the 636 active rentals. This indicates strong guest preference for privacy and space.
- Looking at the property type distribution in Snowmass Village, Apartment/Condo properties are the most common (89.8%), reflecting the local real estate landscape.
- Smaller segments like hotel/boutique, others (combined 0.8%) offer potential for unique stay experiences.
Snowmass Village Airbnb Room Capacity Analysis (2026): Bedroom Distribution
Distribution of Listings by Number of Bedrooms
Room Capacity Insights for Snowmass Village
- The dominant room capacity in Snowmass Village is 2 bedrooms listings, making up 43.9% of the market. This suggests a strong demand for properties suitable for couples or solo travelers.
- Together, 2 bedrooms and 1 bedroom properties represent 68.7% of the active Airbnb listings in Snowmass Village, indicating a high concentration in these sizes.
- A significant 26.1% of listings offer 3+ bedrooms, catering to larger groups and families seeking more space in Snowmass Village.
Snowmass Village Vacation Rental Guest Capacity Trends (2026)
Distribution of Listings by Guest Capacity
Guest Capacity Insights for Snowmass Village
- The most common guest capacity trend in Snowmass Village vacation rentals is listings accommodating 6 guests (35.2%). This suggests the primary traveler segment is likely larger groups.
- Properties designed for 6 guests and 4 guests dominate the Snowmass Village STR market, accounting for 67.9% of listings.
- 59.6% of properties accommodate 6+ guests, serving the market segment for larger families or group travel in Snowmass Village.
- On average, properties in Snowmass Village are equipped to host 5.6 guests.
Snowmass Village Airbnb Booking Patterns (2026): Available vs. Booked Days
Available Days Distribution
Booked Days Distribution
Booking Pattern Insights for Snowmass Village
- The most common availability pattern in Snowmass Village falls within the 271-366 days range, representing 61% of listings. This suggests many properties have significant open periods on their calendars.
- Approximately 92.3% of listings show high availability (181+ days open annually), indicating potential for increased bookings or specific owner usage patterns.
- For booked days, the 31-90 days range is most frequent in Snowmass Village (42.8%), reflecting common guest stay durations or potential owner blocking patterns.
- A notable 8.7% of properties secure long booking periods (181+ days booked per year), highlighting successful long-term rental strategies or significant owner usage.
Snowmass Village Airbnb Minimum Stay Requirements Analysis
Distribution of Listings by Minimum Night Requirement
1 Night
4 listings
0.6% of total
2 Nights
86 listings
13.5% of total
3 Nights
23 listings
3.6% of total
4-6 Nights
40 listings
6.3% of total
7-29 Nights
3 listings
0.5% of total
30+ Nights
480 listings
75.5% of total
Key Insights
- The most prevalent minimum stay requirement in Snowmass Village is 30+ Nights, adopted by 75.5% of listings. This highlights the market's preference for longer commitments.
- Very short stays (1-2 nights) are less common (14.1%), suggesting hosts prefer slightly longer bookings to optimize turnover.
- A significant segment (75.5%) caters to monthly stays (30+ nights) in Snowmass Village, pointing to opportunities in the extended-stay market.
Recommendations
- Align with the market by considering a 30+ Nights minimum stay, as 75.5% of Snowmass Village hosts use this setting.
- If feasible, allowing 1-night stays, especially midweek or during low season, could capture last-minute bookings, as only 0.6% currently do.
- Explore offering discounts for stays of 30+ nights to attract the 75.5% of the market seeking extended stays.
- Adjust minimum nights based on seasonality – potentially shorter during low season and longer during peak demand periods in Snowmass Village.
Snowmass Village Airbnb Cancellation Policy Trends Analysis (2026)
Limited
1 listings
0.2% of total
Refundable
2 listings
0.3% of total
Non-refundable
1 listings
0.2% of total
Super Strict 60 Days
58 listings
9.1% of total
Super Strict 30 Days
263 listings
41.5% of total
Flexible
1 listings
0.2% of total
Moderate
20 listings
3.2% of total
Firm
175 listings
27.6% of total
Strict
113 listings
17.8% of total
Cancellation Policy Insights for Snowmass Village
- The prevailing Airbnb cancellation policy trend in Snowmass Village is Super Strict 30 Days, used by 41.5% of listings.
- There's a relatively balanced mix between guest-friendly (3.4%) and stricter (45.4%) policies, offering choices for different guest needs.
Recommendations for Hosts
- Consider adopting a Super Strict 30 Days policy to align with the 41.5% market standard in Snowmass Village.
- Regularly review your cancellation policy against competitors and market demand shifts in Snowmass Village.
Snowmass Village STR Booking Lead Time Analysis (2026)
Average Booking Lead Time by Month
Booking Lead Time Insights for Snowmass Village
- The overall average booking lead time for vacation rentals in Snowmass Village is 94 days.
- Guests book furthest in advance for stays during March (average 142 days), likely coinciding with peak travel demand or local events.
- The shortest booking windows occur for stays in October (average 33 days), indicating more last-minute travel plans during this time.
- Seasonally, Winter (126 days avg.) sees the longest lead times, while Fall (48 days avg.) has the shortest, reflecting typical travel planning cycles.
Recommendations for Hosts
- Use the overall average lead time (94 days) as a baseline for your pricing and availability strategy in Snowmass Village.
- For March stays, consider implementing length-of-stay discounts or slightly higher rates for bookings made less than 142 days out to capitalize on advance planning.
- Target marketing efforts for the Winter season well in advance (at least 126 days) to capture early planners.
- Monitor your own booking lead times against these Snowmass Village averages to identify opportunities for dynamic pricing adjustments.
Popular & Essential Airbnb Amenities in Snowmass Village (2026)
Amenity Prevalence
Amenity Insights for Snowmass Village
- Essential amenities in Snowmass Village that guests expect include: Wifi, Smoke alarm, Kitchen, Heating, Carbon monoxide alarm, Coffee maker. Lacking these (any) could significantly impact bookings.
- Popular amenities like Dishwasher, TV, Microwave are common but not universal. Offering these can provide a competitive edge.
Recommendations for Hosts
- Ensure your listing includes all essential amenities for Snowmass Village: Wifi, Smoke alarm, Kitchen, Heating, Carbon monoxide alarm, Coffee maker.
- Prioritize adding missing essentials: Wifi, Smoke alarm, Kitchen, Heating, Carbon monoxide alarm, Coffee maker.
- Consider adding popular differentiators like Dishwasher or TV to increase appeal.
- Highlight unique or less common amenities you offer (e.g., hot tub, dedicated workspace, EV charger) in your listing description and photos.
- Regularly check competitor amenities in Snowmass Village to stay competitive.
Snowmass Village Airbnb Guest Demographics & Profile Analysis (2026)
Guest Profile Summary for Snowmass Village
- The typical guest profile for Airbnb in Snowmass Village consists of primarily domestic travelers (94%), often arriving from nearby Denver, typically belonging to the Post-2000s (Gen Z/Alpha) group (50%), primarily speaking English or Spanish.
- Domestic travelers account for 93.9% of guests.
- Key international markets include United States (93.9%) and Canada (0.9%).
- Top languages spoken are English (63.3%) followed by Spanish (15.1%).
- A significant demographic segment is the Post-2000s (Gen Z/Alpha) group, representing 50% of guests.
Recommendations for Hosts
- Target domestic marketing efforts towards travelers from Denver and New York.
- Tailor amenities and listing descriptions to appeal to the dominant Post-2000s (Gen Z/Alpha) demographic (e.g., highlight fast WiFi, smart home features, local guides).
- Highlight unique local experiences or amenities relevant to the primary guest profile.
- Consider seasonal promotions aligned with peak travel times for key origin markets.
Nearby Short-Term Rental Market Comparison
How does the Snowmass Village Airbnb market stack up against its neighbors? Compare key performance metrics like average monthly revenue, ADR, and occupancy rates in surrounding areas to understand the broader regional STR landscape.
| Market | Active Properties | Monthly Revenue | Daily Rate | Avg. Occupancy |
|---|---|---|---|---|
| Blue River | 201 | $7,203 | $609.20 | 45% |
| Aspen | 610 | $7,095 | $992.28 | 36% |
| Snowmass | 21 | $6,247 | $701.59 | 40% |
| El Jebel | 33 | $6,236 | $506.29 | 48% |
| Aspen Park | 11 | $5,825 | $395.00 | 54% |
| Indian Hills | 11 | $5,799 | $333.03 | 54% |
| Grand County | 14 | $5,137 | $513.48 | 42% |
| Glenwood Springs | 242 | $5,039 | $356.03 | 49% |
| Breckenridge | 3,051 | $4,995 | $544.32 | 40% |
| Crested Butte | 267 | $4,956 | $536.90 | 42% |