Silverthorne Airbnb Market Analysis 2026: Short Term Rental Data & Vacation Rental Statistics in Colorado, United States
Is Airbnb profitable in Silverthorne in 2026? Explore comprehensive Airbnb analytics for Silverthorne, Colorado, United States to uncover income potential. This 2026 STR market report for Silverthorne, based on AirROI data from February 2025 to January 2026, reveals key trends in the market of 708 active listings.
Whether you're considering an Airbnb investment in Silverthorne, optimizing your existing vacation rental, or exploring rental arbitrage opportunities, understanding the Silverthorne Airbnb data is crucial. Navigating the high regulation landscape is key to maximizing your short term rental income potential. Let's dive into the specifics.
Key Silverthorne Airbnb Performance Metrics Overview
Monthly Airbnb Revenue Variations & Income Potential in Silverthorne (2026)
Understanding the monthly revenue variations for Airbnb listings in Silverthorne is key to maximizing your short term rental income potential. Seasonality significantly impacts earnings. Our analysis, based on data from the past 12 months, shows that the peak revenue month for STRs in Silverthorne is typically March, while May often presents the lowest earnings, highlighting opportunities for strategic pricing adjustments during shoulder and low seasons. Explore the typical Airbnb income in Silverthorne across different performance tiers:
- Best-in-class properties (Top 10%) achieve $10,385+ monthly, often utilizing dynamic pricing and superior guest experiences.
- Strong performing properties (Top 25%) earn $6,602 or more, indicating effective management and desirable locations/amenities.
- Typical properties (Median) generate around $3,840 per month, representing the average market performance.
- Entry-level properties (Bottom 25%) see earnings around $2,086, often with potential for optimization.
Average Monthly Airbnb Earnings Trend in Silverthorne
Silverthorne Airbnb Occupancy Rate Trends (2026)
Maximize your bookings by understanding the Silverthorne STR occupancy trends. Seasonal demand shifts significantly influence how often properties are booked. Typically, Februarysees the highest demand (peak season occupancy), while May experiences the lowest (low season). Effective strategies, like adjusting minimum stays or offering promotions, can boost occupancy during slower periods. Here's how different property tiers perform in Silverthorne:
- Best-in-class properties (Top 10%) achieve 77%+ occupancy, indicating high desirability and potentially optimized availability.
- Strong performing properties (Top 25%) maintain 58% or higher occupancy, suggesting good market fit and guest satisfaction.
- Typical properties (Median) have an occupancy rate around 38%.
- Entry-level properties (Bottom 25%) average 21% occupancy, potentially facing higher vacancy.
Average Monthly Occupancy Rate Trend in Silverthorne
Average Daily Rate (ADR) Airbnb Trends in Silverthorne (2026)
Effective short term rental pricing strategy in Silverthorne involves understanding monthly ADR fluctuations. The Average Daily Rate (ADR) for Airbnb in Silverthorne typically peaks in December and dips lowest during April. Leveraging Airbnb dynamic pricing tools or strategies based on this seasonality can significantly boost revenue. Here's a look at the typical nightly rates achieved:
- Best-in-class properties (Top 10%) command rates of $721+ per night, often due to premium features or locations.
- Strong performing properties (Top 25%) achieve nightly rates of $479 or more.
- Typical properties (Median) charge around $312 per night.
- Entry-level properties (Bottom 25%) earn around $220 per night.
Average Daily Rate (ADR) Trend by Month in Silverthorne
Get Live Silverthorne Market Intelligence 👇

Explore Real-time Analytics
Airbnb Seasonality Analysis & Trends in Silverthorne (2026)
Peak Season (March, February, December)
- Revenue averages $7,948 per month
- Occupancy rates average 56.3%
- Daily rates average $454
Shoulder Season
- Revenue averages $4,730 per month
- Occupancy maintains around 39.1%
- Daily rates hold near $387
Low Season (April, May, October)
- Revenue drops to average $2,996 per month
- Occupancy decreases to average 30.1%
- Daily rates adjust to average $341
Seasonality Insights for Silverthorne
- The Airbnb seasonality in Silverthorne shows highly seasonal trends requiring careful strategy. While the sections above show seasonal averages, it's also insightful to look at the extremes:
- During the high season, the absolute peak month showcases Silverthorne's highest earning potential, with monthly revenues capable of climbing to $8,632, occupancy reaching a high of 63.7%, and ADRs peaking at $509.
- Conversely, the slowest single month of the year, typically falling within the low season, marks the market's lowest point. In this month, revenue might dip to $2,546, occupancy could drop to 26.0%, and ADRs may adjust down to $322.
- Understanding both the seasonal averages and these monthly peaks and troughs in revenue, occupancy, and ADR is crucial for maximizing your Airbnb profit potential in Silverthorne.
Seasonal Strategies for Maximizing Profit
- Peak Season: Maximize revenue through premium pricing and potentially longer minimum stays. Ensure high availability.
- Low Season: Offer competitive pricing, special promotions (e.g., extended stay discounts), and flexible cancellation policies. Target off-season travelers like remote workers or budget-conscious guests.
- Shoulder Seasons: Implement dynamic pricing that balances peak and low rates. Target weekend travelers or specific events. Offer slightly more flexible terms than peak season.
- Regularly analyze your own performance against these Silverthorne seasonality benchmarks and adjust your pricing and availability strategy accordingly.
Best Areas for Airbnb Investment in Silverthorne (2026)
Exploring the top neighborhoods for short-term rentals in Silverthorne? This section highlights key areas, outlining why they are attractive for hosts and guests, along with notable local attractions. Consider these locations based on your target guest profile and investment strategy.
| Neighborhood / Area | Why Host Here? (Target Guests & Appeal) | Key Attractions & Landmarks |
|---|---|---|
| Dillon Reservoir | A stunning alpine lake surrounded by the Rocky Mountains, popular for water sports and hiking. A tranquil retreat for nature lovers and families visiting the area. | Dillon Marina, Dillon Amphitheater, Summit County Bike Path, Dillon Farmers Market, Lake Dillon Theatre Company |
| Keystone Resort | A renowned ski resort destination that attracts winter sports enthusiasts and summer vacationers looking for mountain activities. Offers a range of lodging options and amenities. | Keystone Ski Area, River Run Village, A51 Terrain Park, Keystone Bike Park, Keystone Concert Series |
| Copper Mountain | Another top ski resort known for its excellent skiing and snowboarding conditions. Popular with winter sports lovers and families, and great for year-round outdoor activities. | Copper Mountain Ski Resort, Woodward Copper, Alpine Skiing, Copper Creek Golf Course |
| Frisco | A charming mountain town with a vibrant historic downtown. Offers access to ski areas, hiking trails, and cozy dining, making it a great location for tourists. | Frisco Historic Park and Museum, Frisco Marina, Summit County Bike Path, Sailing on Dillon Reservoir, Frisco Adventure Park |
| Breckenridge | A historic mining town turned ski resort, famous for its vibrant arts scene, nightlife, and year-round outdoor activities. A major draw for tourists looking for both winter and summer fun. | Breckenridge Ski Resort, Main Street Breckenridge, Breckenridge Arts District, Peak 8 Fun Park, Breckenridge Village |
| Silverthorne Outlets | A bustling area featuring outlet shops and retail experiences. Ideal for those looking to shop while enjoying the mountain scenery. | Silverthorne Factory Outlets, Blue River Trail, Rainbow Park, North Pond Park |
| Swan Mountain Road | A scenic drive and location that connects the beautiful towns of Breckenridge, Dillon, and Keystone, perfect for travelers wanting to explore multiple areas. | Swan Mountain Overlook, Wildflower hikes, Scenic views, Nature photography spots |
| White River National Forest | A vast and beautiful natural area offering outdoor recreation like hiking, camping, and skiing. Perfect for nature enthusiasts and eco-tourists. | Hiking trails, Camping sites, Wildlife watching, Scenic drives, Fishing spots |
Understanding Airbnb License Requirements & STR Laws in Silverthorne (2026)
Yes, Silverthorne, Colorado, United States enforces high STR regulations. Obtaining a license and ensuring compliance is almost certainly required according to current 2026 STR laws. Always verify the latest short term rental regulations and Airbnb license requirements directly with local government authorities for Silverthorne to ensure full compliance before hosting.
(Source: AirROI data, 2026, based on 43% licensed listings)
Top Performing Airbnb Properties in Silverthorne (2026)
Benchmark your potential! Explore examples of top-performing Airbnb properties in Silverthornebased on Trailing Twelve Month (TTM) revenue. Analyze their characteristics, revenue, occupancy rate, and ADR to understand what drives success in this market.
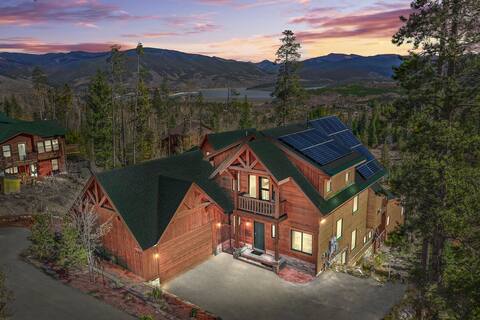
7 bedroom, hot tub, gaming and views!
Entire Place • 7 bedrooms

Royal Buffalo (STR21-01484)
Entire Place • 7 bedrooms

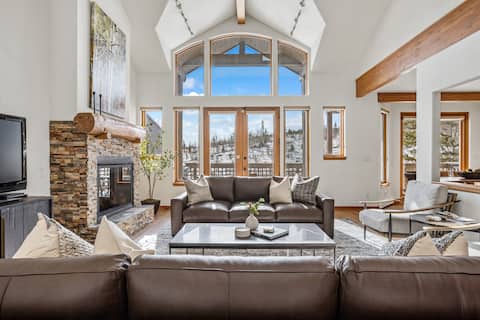
Stunning #1 award-winning Home - No Chores!
Entire Place • 5 bedrooms
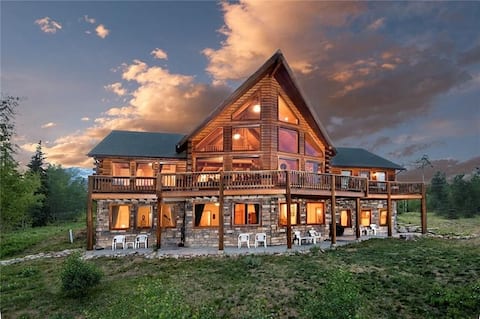
Spacious Getaway w/ Mountain Views! Great Rates!
Entire Place • 6 bedrooms

Solstice•Resort Amenities•Spa•Lake•Beach
Entire Place • 4 bedrooms
Mountain Ski & Hike - Wildernest Haven
Entire Place • 6 bedrooms
Note: Performance varies based on location, size, amenities, seasonality, and management quality. Data reflects the past 12 months.
Top Performing Airbnb Hosts in Silverthorne (2026)
Learn from the best! This table showcases top-performing Airbnb hosts in Silverthorne based on the number of properties managed and estimated total revenue over the past year. Analyze their scale and performance metrics.
| Host Name | Properties | Grossing Revenue | Stay Reviews | Avg Rating |
|---|---|---|---|---|
| Great Western | 32 | $1,693,655 | 450 | 4.61/5.0 |
| Summit Sky Ranch | 25 | $1,634,694 | 572 | 4.95/5.0 |
| Evolve | 29 | $1,161,335 | 1117 | 4.74/5.0 |
| Summit Mountain Rentals | 21 | $1,132,191 | 276 | 4.79/5.0 |
| Summit County Mountain Retreat | 29 | $1,109,356 | 255 | 4.59/5.0 |
| Paul | 21 | $991,772 | 406 | 4.85/5.0 |
| Evolve | 19 | $863,487 | 1446 | 4.67/5.0 |
| Summit Mountain | 14 | $674,482 | 213 | 4.83/5.0 |
| LocalVR Breckenridge | 13 | $663,807 | 487 | 4.74/5.0 |
| Summit Luxury Estates | 1 | $580,115 | 44 | 4.93/5.0 |
Analyzing the strategies of top hosts, such as their property selection, pricing, and guest communication, can offer valuable lessons for optimizing your own Airbnb operations in Silverthorne.
Dive Deeper: Advanced Silverthorne STR Market Data (2026)
Ready to unlock more insights? AirROI provides access to advanced metrics and comprehensive Airbnb data for Silverthorne. Explore detailed analytics beyond this report to refine your investment strategy, optimize pricing, and maximize your vacation rental profits.
Explore Advanced MetricsSilverthorne Short-Term Rental Market Composition (2026): Property & Room Types
Room Type Distribution
Property Type Distribution
Market Composition Insights for Silverthorne
- The Silverthorne Airbnb market composition is heavily skewed towards Entire Home/Apt listings, which make up 98.3% of the 708 active rentals. This indicates strong guest preference for privacy and space.
- Looking at the property type distribution in Silverthorne, Apartment/Condo properties are the most common (50%), reflecting the local real estate landscape.
- Houses represent a significant 47% portion, catering likely to families or larger groups.
- Smaller segments like outdoor/unique, others, hotel/boutique (combined 2.9%) offer potential for unique stay experiences.
Silverthorne Airbnb Room Capacity Analysis (2026): Bedroom Distribution
Distribution of Listings by Number of Bedrooms
Room Capacity Insights for Silverthorne
- The dominant room capacity in Silverthorne is 2 bedrooms listings, making up 37.4% of the market. This suggests a strong demand for properties suitable for couples or solo travelers.
- Together, 2 bedrooms and 3 bedrooms properties represent 65.6% of the active Airbnb listings in Silverthorne, indicating a high concentration in these sizes.
- A significant 51.2% of listings offer 3+ bedrooms, catering to larger groups and families seeking more space in Silverthorne.
Silverthorne Vacation Rental Guest Capacity Trends (2026)
Distribution of Listings by Guest Capacity
Guest Capacity Insights for Silverthorne
- The most common guest capacity trend in Silverthorne vacation rentals is listings accommodating 8+ guests (41.5%). This suggests the primary traveler segment is likely larger groups.
- Properties designed for 8+ guests and 6 guests dominate the Silverthorne STR market, accounting for 75.4% of listings.
- 79.1% of properties accommodate 6+ guests, serving the market segment for larger families or group travel in Silverthorne.
- On average, properties in Silverthorne are equipped to host 6.4 guests.
Silverthorne Airbnb Booking Patterns (2026): Available vs. Booked Days
Available Days Distribution
Booked Days Distribution
Booking Pattern Insights for Silverthorne
- The most common availability pattern in Silverthorne falls within the 271-366 days range, representing 51% of listings. This suggests many properties have significant open periods on their calendars.
- Approximately 85.5% of listings show high availability (181+ days open annually), indicating potential for increased bookings or specific owner usage patterns.
- For booked days, the 31-90 days range is most frequent in Silverthorne (35.5%), reflecting common guest stay durations or potential owner blocking patterns.
- A notable 15.9% of properties secure long booking periods (181+ days booked per year), highlighting successful long-term rental strategies or significant owner usage.
Silverthorne Airbnb Minimum Stay Requirements Analysis
Distribution of Listings by Minimum Night Requirement
1 Night
28 listings
4% of total
2 Nights
165 listings
23.3% of total
3 Nights
80 listings
11.3% of total
4-6 Nights
43 listings
6.1% of total
7-29 Nights
21 listings
3% of total
30+ Nights
371 listings
52.4% of total
Key Insights
- The most prevalent minimum stay requirement in Silverthorne is 30+ Nights, adopted by 52.4% of listings. This highlights the market's preference for longer commitments.
- A significant segment (52.4%) caters to monthly stays (30+ nights) in Silverthorne, pointing to opportunities in the extended-stay market.
Recommendations
- Align with the market by considering a 30+ Nights minimum stay, as 52.4% of Silverthorne hosts use this setting.
- If feasible, allowing 1-night stays, especially midweek or during low season, could capture last-minute bookings, as only 4% currently do.
- Explore offering discounts for stays of 30+ nights to attract the 52.4% of the market seeking extended stays.
- Adjust minimum nights based on seasonality – potentially shorter during low season and longer during peak demand periods in Silverthorne.
Silverthorne Airbnb Cancellation Policy Trends Analysis (2026)
Limited
26 listings
3.7% of total
Super Strict 60 Days
11 listings
1.6% of total
Super Strict 30 Days
35 listings
5% of total
Flexible
19 listings
2.7% of total
Moderate
131 listings
18.6% of total
Firm
364 listings
51.6% of total
Strict
120 listings
17% of total
Cancellation Policy Insights for Silverthorne
- The prevailing Airbnb cancellation policy trend in Silverthorne is Firm, used by 51.6% of listings.
- A majority (68.6%) of hosts in Silverthorne utilize Firm or Strict policies, indicating a market where hosts prioritize booking security.
Recommendations for Hosts
- Consider adopting a Firm policy to align with the 51.6% market standard in Silverthorne.
- Regularly review your cancellation policy against competitors and market demand shifts in Silverthorne.
Silverthorne STR Booking Lead Time Analysis (2026)
Average Booking Lead Time by Month
Booking Lead Time Insights for Silverthorne
- The overall average booking lead time for vacation rentals in Silverthorne is 59 days.
- Guests book furthest in advance for stays during December (average 75 days), likely coinciding with peak travel demand or local events.
- The shortest booking windows occur for stays in May (average 41 days), indicating more last-minute travel plans during this time.
- Seasonally, Winter (72 days avg.) sees the longest lead times, while Spring (51 days avg.) has the shortest, reflecting typical travel planning cycles.
Recommendations for Hosts
- Use the overall average lead time (59 days) as a baseline for your pricing and availability strategy in Silverthorne.
- For December stays, consider implementing length-of-stay discounts or slightly higher rates for bookings made less than 75 days out to capitalize on advance planning.
- Target marketing efforts for the Winter season well in advance (at least 72 days) to capture early planners.
- Monitor your own booking lead times against these Silverthorne averages to identify opportunities for dynamic pricing adjustments.
Popular & Essential Airbnb Amenities in Silverthorne (2026)
Amenity Prevalence
Amenity Insights for Silverthorne
- Essential amenities in Silverthorne that guests expect include: Wifi, TV, Smoke alarm, Kitchen, Heating, Carbon monoxide alarm, Coffee maker, Microwave, Dishes and silverware. Lacking these (any) could significantly impact bookings.
- Popular amenities like Refrigerator are common but not universal. Offering these can provide a competitive edge.
Recommendations for Hosts
- Ensure your listing includes all essential amenities for Silverthorne: Wifi, TV, Smoke alarm, Kitchen, Heating, Carbon monoxide alarm, Coffee maker, Microwave, Dishes and silverware.
- Prioritize adding missing essentials: Wifi, TV, Smoke alarm, Kitchen, Heating, Carbon monoxide alarm, Coffee maker, Microwave, Dishes and silverware.
- Consider adding popular differentiators like Refrigerator to increase appeal.
- Highlight unique or less common amenities you offer (e.g., hot tub, dedicated workspace, EV charger) in your listing description and photos.
- Regularly check competitor amenities in Silverthorne to stay competitive.
Silverthorne Airbnb Guest Demographics & Profile Analysis (2026)
Guest Profile Summary for Silverthorne
- The typical guest profile for Airbnb in Silverthorne consists of primarily domestic travelers (96%), often arriving from nearby Denver, typically belonging to the Post-2000s (Gen Z/Alpha) group (50%), primarily speaking English or Spanish.
- Domestic travelers account for 96.4% of guests.
- Key international markets include United States (96.4%) and Canada (0.5%).
- Top languages spoken are English (69.9%) followed by Spanish (13.7%).
- A significant demographic segment is the Post-2000s (Gen Z/Alpha) group, representing 50% of guests.
Recommendations for Hosts
- Target domestic marketing efforts towards travelers from Denver and New York.
- Tailor amenities and listing descriptions to appeal to the dominant Post-2000s (Gen Z/Alpha) demographic (e.g., highlight fast WiFi, smart home features, local guides).
- Highlight unique local experiences or amenities relevant to the primary guest profile.
- Consider seasonal promotions aligned with peak travel times for key origin markets.
Nearby Short-Term Rental Market Comparison
How does the Silverthorne Airbnb market stack up against its neighbors? Compare key performance metrics like average monthly revenue, ADR, and occupancy rates in surrounding areas to understand the broader regional STR landscape.
| Market | Active Properties | Monthly Revenue | Daily Rate | Avg. Occupancy |
|---|---|---|---|---|
| Blue River | 201 | $7,203 | $609.20 | 45% |
| Aspen | 610 | $7,095 | $992.28 | 36% |
| Snowmass | 21 | $6,247 | $701.59 | 40% |
| El Jebel | 33 | $6,236 | $506.29 | 48% |
| Aspen Park | 11 | $5,825 | $395.00 | 54% |
| Indian Hills | 11 | $5,799 | $333.03 | 54% |
| Grand County | 14 | $5,137 | $513.48 | 42% |
| Glenwood Springs | 242 | $5,039 | $356.03 | 49% |
| Breckenridge | 3,051 | $4,995 | $544.32 | 40% |
| Crested Butte | 267 | $4,956 | $536.90 | 42% |