Rustic Airbnb Market Analysis 2026: Short Term Rental Data & Vacation Rental Statistics in Colorado, United States
Is Airbnb profitable in Rustic in 2026? Explore comprehensive Airbnb analytics for Rustic, Colorado, United States to uncover income potential. This 2026 STR market report for Rustic, based on AirROI data from February 2025 to January 2026, reveals key trends in the niche market of 20 active listings.
Whether you're considering an Airbnb investment in Rustic, optimizing your existing vacation rental, or exploring rental arbitrage opportunities, understanding the Rustic Airbnb data is crucial. Leveraging the low regulation environment is key to maximizing your short term rental income potential. Let's dive into the specifics.
Key Rustic Airbnb Performance Metrics Overview
Monthly Airbnb Revenue Variations & Income Potential in Rustic (2026)
Understanding the monthly revenue variations for Airbnb listings in Rustic is key to maximizing your short term rental income potential. Seasonality significantly impacts earnings. Our analysis, based on data from the past 12 months, shows that the peak revenue month for STRs in Rustic is typically April, while March often presents the lowest earnings, highlighting opportunities for strategic pricing adjustments during shoulder and low seasons. Explore the typical Airbnb income in Rustic across different performance tiers:
- Best-in-class properties (Top 10%) achieve $4,721+ monthly, often utilizing dynamic pricing and superior guest experiences.
- Strong performing properties (Top 25%) earn $2,317 or more, indicating effective management and desirable locations/amenities.
- Typical properties (Median) generate around $1,081 per month, representing the average market performance.
- Entry-level properties (Bottom 25%) see earnings around $664, often with potential for optimization.
Average Monthly Airbnb Earnings Trend in Rustic
Rustic Airbnb Occupancy Rate Trends (2026)
Maximize your bookings by understanding the Rustic STR occupancy trends. Seasonal demand shifts significantly influence how often properties are booked. Typically, Aprilsees the highest demand (peak season occupancy), while March experiences the lowest (low season). Effective strategies, like adjusting minimum stays or offering promotions, can boost occupancy during slower periods. Here's how different property tiers perform in Rustic:
- Best-in-class properties (Top 10%) achieve 48%+ occupancy, indicating high desirability and potentially optimized availability.
- Strong performing properties (Top 25%) maintain 35% or higher occupancy, suggesting good market fit and guest satisfaction.
- Typical properties (Median) have an occupancy rate around 20%.
- Entry-level properties (Bottom 25%) average 13% occupancy, potentially facing higher vacancy.
Average Monthly Occupancy Rate Trend in Rustic
Average Daily Rate (ADR) Airbnb Trends in Rustic (2026)
Effective short term rental pricing strategy in Rustic involves understanding monthly ADR fluctuations. The Average Daily Rate (ADR) for Airbnb in Rustic typically peaks in June and dips lowest during January. Leveraging Airbnb dynamic pricing tools or strategies based on this seasonality can significantly boost revenue. Here's a look at the typical nightly rates achieved:
- Best-in-class properties (Top 10%) command rates of $316+ per night, often due to premium features or locations.
- Strong performing properties (Top 25%) achieve nightly rates of $199 or more.
- Typical properties (Median) charge around $149 per night.
- Entry-level properties (Bottom 25%) earn around $138 per night.
Average Daily Rate (ADR) Trend by Month in Rustic
Get Live Rustic Market Intelligence 👇

Explore Real-time Analytics
Airbnb Seasonality Analysis & Trends in Rustic (2026)
Peak Season (April, December, October)
- Revenue averages $2,509 per month
- Occupancy rates average 35.2%
- Daily rates average $185
Shoulder Season
- Revenue averages $1,895 per month
- Occupancy maintains around 25.4%
- Daily rates hold near $187
Low Season (March, May, June)
- Revenue drops to average $1,585 per month
- Occupancy decreases to average 18.9%
- Daily rates adjust to average $193
Seasonality Insights for Rustic
- The Airbnb seasonality in Rustic shows highly seasonal trends requiring careful strategy. While the sections above show seasonal averages, it's also insightful to look at the extremes:
- During the high season, the absolute peak month showcases Rustic's highest earning potential, with monthly revenues capable of climbing to $3,024, occupancy reaching a high of 53.4%, and ADRs peaking at $197.
- Conversely, the slowest single month of the year, typically falling within the low season, marks the market's lowest point. In this month, revenue might dip to $1,531, occupancy could drop to 14.0%, and ADRs may adjust down to $179.
- Understanding both the seasonal averages and these monthly peaks and troughs in revenue, occupancy, and ADR is crucial for maximizing your Airbnb profit potential in Rustic.
Seasonal Strategies for Maximizing Profit
- Peak Season: Maximize revenue through premium pricing and potentially longer minimum stays. Ensure high availability.
- Low Season: Offer competitive pricing, special promotions (e.g., extended stay discounts), and flexible cancellation policies. Target off-season travelers like remote workers or budget-conscious guests.
- Shoulder Seasons: Implement dynamic pricing that balances peak and low rates. Target weekend travelers or specific events. Offer slightly more flexible terms than peak season.
- Regularly analyze your own performance against these Rustic seasonality benchmarks and adjust your pricing and availability strategy accordingly.
Best Areas for Airbnb Investment in Rustic (2026)
Exploring the top neighborhoods for short-term rentals in Rustic? This section highlights key areas, outlining why they are attractive for hosts and guests, along with notable local attractions. Consider these locations based on your target guest profile and investment strategy.
| Neighborhood / Area | Why Host Here? (Target Guests & Appeal) | Key Attractions & Landmarks |
|---|---|---|
| Glenwood Springs | Famous for its hot springs and outdoor adventures, making it a sought-after destination for tourists year-round. Offers stunning mountain scenery and plenty of recreational activities. | Glenwood Hot Springs Pool, Glenwood Caverns Adventure Park, Hanging Lake, White River National Forest, Glenwood Springs Historic District |
| Aspen | A world-renowned ski resort town with a vibrant arts scene and luxury accommodations. Attracts high-income travelers looking for skiing in winter and festivals in summer. | Aspen Mountain, Maroon Bells, Aspen Art Museum, Silver Queen Gondola, Belly Up Aspen |
| Leadville | A historic mining town with rich history and proximity to several outdoor activities including hiking and skiing. Offers a more affordable option for travelers compared to nearby resorts. | Mount Massive, Leadville Railroad, Twin Lakes, National Mining Hall of Fame, Historic Downtown Leadville |
| Salida | Known for its charming downtown and access to outdoor sports, especially river rafting and mountain biking. Appeals to adventurous travelers and those looking for a small-town atmosphere. | Arkansas River, Salida Hot Springs Aquatic Center, Mountain biking trails, Historic downtown Salida, Browns Canyon National Monument |
| Breckenridge | A popular ski destination with year-round activities including skiing, snowboarding, and hiking. Known for its vibrant nightlife and festivals throughout the year. | Breckenridge Ski Resort, Main Street, Breck Connect Gondola, Breckenridge Arts District, Sawmill Reservoir |
| Estes Park | Gateway to Rocky Mountain National Park, this town attracts nature lovers and outdoor enthusiasts looking for stunning landscapes and wildlife. | Rocky Mountain National Park, Estes Park Aerial Tramway, Lake Estes, The Stanley Hotel, Estes Park Riverwalk |
| Telluride | An isolated gem located in a box canyon, known for its skiing and festivals, including the Telluride Film Festival. Attracts affluent tourists seeking unique experiences. | Telluride Ski Resort, Box Canyon Waterfall, Telluride History Museum, Main Street, Festival of Lights |
| Fort Collins | A college town with a vibrant craft beer scene, beautiful parks and close to nature. Attracts young travelers, families, and outdoor lovers. | Horsetooth Reservoir, Old Town Fort Collins, Cache La Poudre River, New Belgium Brewing, Lory State Park |
Understanding Airbnb License Requirements & STR Laws in Rustic (2026)
While Rustic, Colorado, United States currently shows low STR regulations, specific Airbnb license requirements might still exist or change. Always verify the latest short term rental regulations and Airbnb license requirements directly with local government authorities for Rustic to ensure full compliance before hosting.
(Source: AirROI data, 2026, based on 5% licensed listings)
Top Performing Airbnb Properties in Rustic (2026)
Benchmark your potential! Explore examples of top-performing Airbnb properties in Rusticbased on Trailing Twelve Month (TTM) revenue. Analyze their characteristics, revenue, occupancy rate, and ADR to understand what drives success in this market.
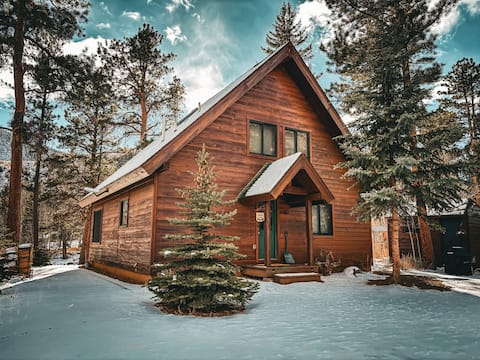
Riverfront, HOT TUB, and NO cleaning fees!
Entire Place • 2 bedrooms

Pure Serenity - Private Stream & Grand Views
Entire Place • 2 bedrooms
Beautifully Wild Poudre Canyon Cabin (21-Zone3031)
Entire Place • 2 bedrooms
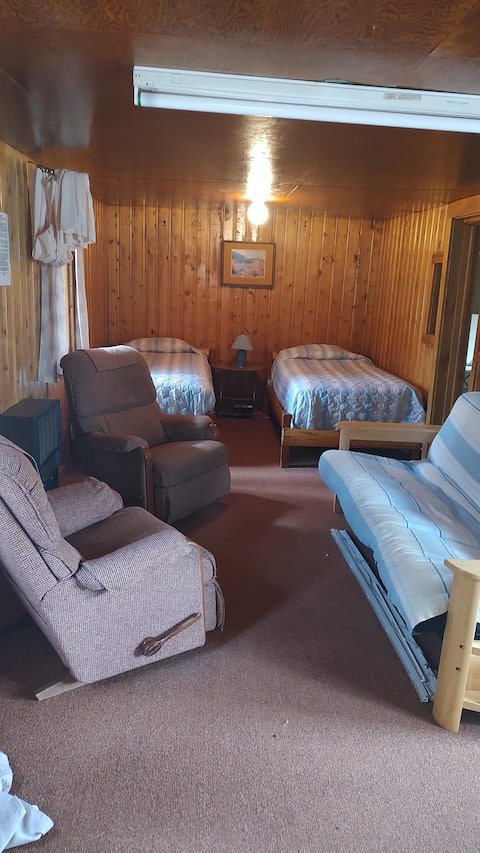
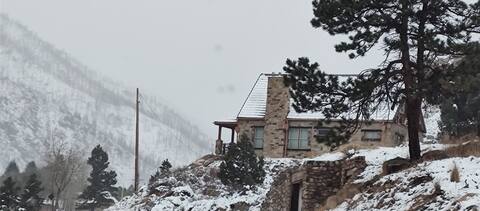
Cabin 11 at Sportsman’s Lodge
Entire Place • N/A

Cabin 10 at Sportsman’s Lodge
Entire Place • N/A

CanyonSide Campground Cabin 2
Entire Place • 2 bedrooms
Note: Performance varies based on location, size, amenities, seasonality, and management quality. Data reflects the past 12 months.
Top Performing Airbnb Hosts in Rustic (2026)
Learn from the best! This table showcases top-performing Airbnb hosts in Rustic based on the number of properties managed and estimated total revenue over the past year. Analyze their scale and performance metrics.
| Host Name | Properties | Grossing Revenue | Stay Reviews | Avg Rating |
|---|---|---|---|---|
| Brandon | 1 | $83,429 | 72 | 4.99/5.0 |
| Sportsman'S | 12 | $50,938 | 55 | 4.80/5.0 |
| Aaron | 1 | $33,410 | 21 | 4.90/5.0 |
| June | 4 | $26,799 | 115 | 4.79/5.0 |
| Liz | 1 | $15,295 | 41 | 4.93/5.0 |
| Russell And Veronica | 1 | $1,430 | 2 | Not Rated |
Analyzing the strategies of top hosts, such as their property selection, pricing, and guest communication, can offer valuable lessons for optimizing your own Airbnb operations in Rustic.
Dive Deeper: Advanced Rustic STR Market Data (2026)
Ready to unlock more insights? AirROI provides access to advanced metrics and comprehensive Airbnb data for Rustic. Explore detailed analytics beyond this report to refine your investment strategy, optimize pricing, and maximize your vacation rental profits.
Explore Advanced MetricsRustic Short-Term Rental Market Composition (2026): Property & Room Types
Room Type Distribution
Property Type Distribution
Market Composition Insights for Rustic
- The Rustic Airbnb market composition is heavily skewed towards Entire Home/Apt listings, which make up 100% of the 20 active rentals. This indicates strong guest preference for privacy and space.
- Looking at the property type distribution in Rustic, Outdoor/Unique properties are the most common (95%), reflecting the local real estate landscape.
Rustic Airbnb Room Capacity Analysis (2026): Bedroom Distribution
Distribution of Listings by Number of Bedrooms
Room Capacity Insights for Rustic
- The dominant room capacity in Rustic is 2 bedrooms listings, making up 30% of the market. This suggests a strong demand for properties suitable for couples or solo travelers.
- Together, 2 bedrooms and 3 bedrooms properties represent 35.0% of the active Airbnb listings in Rustic, indicating a high concentration in these sizes.
- Listings with 3+ bedrooms (5.0%) represent a smaller niche, potentially indicating an underserved market for larger group accommodations in Rustic.
Rustic Vacation Rental Guest Capacity Trends (2026)
Distribution of Listings by Guest Capacity
Guest Capacity Insights for Rustic
- The most common guest capacity trend in Rustic vacation rentals is listings accommodating 4 guests (25%). This suggests the primary traveler segment is likely small families or groups.
- Properties designed for 4 guests and 5 guests dominate the Rustic STR market, accounting for 45.0% of listings.
- 25.0% of properties accommodate 6+ guests, serving the market segment for larger families or group travel in Rustic.
- On average, properties in Rustic are equipped to host 4.5 guests.
Rustic Airbnb Booking Patterns (2026): Available vs. Booked Days
Available Days Distribution
Booked Days Distribution
Booking Pattern Insights for Rustic
- The most common availability pattern in Rustic falls within the 271-366 days range, representing 90% of listings. This suggests many properties have significant open periods on their calendars.
- Approximately 95.0% of listings show high availability (181+ days open annually), indicating potential for increased bookings or specific owner usage patterns.
- For booked days, the 1-30 days range is most frequent in Rustic (55%), reflecting common guest stay durations or potential owner blocking patterns.
- A notable 5.0% of properties secure long booking periods (181+ days booked per year), highlighting successful long-term rental strategies or significant owner usage.
Rustic Airbnb Minimum Stay Requirements Analysis
Distribution of Listings by Minimum Night Requirement
1 Night
14 listings
70% of total
2 Nights
1 listings
5% of total
3 Nights
1 listings
5% of total
7-29 Nights
1 listings
5% of total
30+ Nights
3 listings
15% of total
Key Insights
- The most prevalent minimum stay requirement in Rustic is 1 Night, adopted by 70% of listings. This highlights the market's preference for shorter, flexible bookings.
- A strong majority (75.0%) of the Rustic Airbnb data shows acceptance of very short stays (1-2 nights), indicating a dynamic, high-turnover market.
- A significant segment (15%) caters to monthly stays (30+ nights) in Rustic, pointing to opportunities in the extended-stay market.
Recommendations
- Align with the market by considering a 1 Night minimum stay, as 70% of Rustic hosts use this setting.
- Explore offering discounts for stays of 30+ nights to attract the 15% of the market seeking extended stays.
- Adjust minimum nights based on seasonality – potentially shorter during low season and longer during peak demand periods in Rustic.
Rustic Airbnb Cancellation Policy Trends Analysis (2026)
Firm
20 listings
100% of total
Cancellation Policy Insights for Rustic
- The prevailing Airbnb cancellation policy trend in Rustic is Firm, used by 100% of listings.
- A majority (100.0%) of hosts in Rustic utilize Firm or Strict policies, indicating a market where hosts prioritize booking security.
Recommendations for Hosts
- Consider adopting a Firm policy to align with the 100% market standard in Rustic.
- Regularly review your cancellation policy against competitors and market demand shifts in Rustic.
Rustic STR Booking Lead Time Analysis (2026)
Average Booking Lead Time by Month
Booking Lead Time Insights for Rustic
- The overall average booking lead time for vacation rentals in Rustic is 51 days.
- Guests book furthest in advance for stays during April (average 164 days), likely coinciding with peak travel demand or local events.
- The shortest booking windows occur for stays in January (average 10 days), indicating more last-minute travel plans during this time.
- Seasonally, Spring (88 days avg.) sees the longest lead times, while Winter (26 days avg.) has the shortest, reflecting typical travel planning cycles.
Recommendations for Hosts
- Use the overall average lead time (51 days) as a baseline for your pricing and availability strategy in Rustic.
- For April stays, consider implementing length-of-stay discounts or slightly higher rates for bookings made less than 164 days out to capitalize on advance planning.
- During January, focus on last-minute booking availability and promotions, as guests book with very short notice (10 days avg.).
- Target marketing efforts for the Spring season well in advance (at least 88 days) to capture early planners.
- Monitor your own booking lead times against these Rustic averages to identify opportunities for dynamic pricing adjustments.
Popular & Essential Airbnb Amenities in Rustic (2026)
Amenity Prevalence
Amenity Insights for Rustic
- Essential amenities in Rustic that guests expect include: Cooking basics, Wifi, Kitchen, Fire extinguisher, Pets allowed. Lacking these (any) could significantly impact bookings.
- Popular amenities like Refrigerator, Essentials, Bed linens are common but not universal. Offering these can provide a competitive edge.
Recommendations for Hosts
- Ensure your listing includes all essential amenities for Rustic: Cooking basics, Wifi, Kitchen, Fire extinguisher, Pets allowed.
- Prioritize adding missing essentials: Pets allowed.
- Consider adding popular differentiators like Refrigerator or Essentials to increase appeal.
- Highlight unique or less common amenities you offer (e.g., hot tub, dedicated workspace, EV charger) in your listing description and photos.
- Regularly check competitor amenities in Rustic to stay competitive.
Rustic Airbnb Guest Demographics & Profile Analysis (2026)
Guest Profile Summary for Rustic
- The typical guest profile for Airbnb in Rustic consists of primarily domestic travelers (100%), often arriving from nearby Fort Collins, typically belonging to the Post-2000s (Gen Z/Alpha) group (50%), primarily speaking English or Spanish.
- Domestic travelers account for 100.0% of guests.
- Top languages spoken are English (79.2%) followed by Spanish (16.7%).
- A significant demographic segment is the Post-2000s (Gen Z/Alpha) group, representing 50% of guests.
Recommendations for Hosts
- Target domestic marketing efforts towards travelers from Fort Collins and Colorado Springs.
- Tailor amenities and listing descriptions to appeal to the dominant Post-2000s (Gen Z/Alpha) demographic (e.g., highlight fast WiFi, smart home features, local guides).
- Highlight unique local experiences or amenities relevant to the primary guest profile.
- Consider seasonal promotions aligned with peak travel times for key origin markets.
Nearby Short-Term Rental Market Comparison
How does the Rustic Airbnb market stack up against its neighbors? Compare key performance metrics like average monthly revenue, ADR, and occupancy rates in surrounding areas to understand the broader regional STR landscape.
| Market | Active Properties | Monthly Revenue | Daily Rate | Avg. Occupancy |
|---|---|---|---|---|
| Blue River | 201 | $7,203 | $609.20 | 45% |
| Aspen | 610 | $7,095 | $992.28 | 36% |
| Snowmass | 21 | $6,247 | $701.59 | 40% |
| Aspen Park | 11 | $5,825 | $395.00 | 54% |
| Indian Hills | 11 | $5,799 | $333.03 | 54% |
| Grand County | 14 | $5,137 | $513.48 | 42% |
| Breckenridge | 3,051 | $4,995 | $544.32 | 40% |
| Snowmass Village | 636 | $4,938 | $711.61 | 35% |
| Black Hawk | 133 | $4,884 | $328.37 | 52% |
| Beaver Creek | 522 | $4,818 | $901.27 | 30% |