Pine Airbnb Market Analysis 2026: Short Term Rental Data & Vacation Rental Statistics in Colorado, United States
Is Airbnb profitable in Pine in 2026? Explore comprehensive Airbnb analytics for Pine, Colorado, United States to uncover income potential. This 2026 STR market report for Pine, based on AirROI data from February 2025 to January 2026, reveals key trends in the niche market of 25 active listings.
Whether you're considering an Airbnb investment in Pine, optimizing your existing vacation rental, or exploring rental arbitrage opportunities, understanding the Pine Airbnb data is crucial. Leveraging the low regulation environment is key to maximizing your short term rental income potential. Let's dive into the specifics.
Key Pine Airbnb Performance Metrics Overview
Monthly Airbnb Revenue Variations & Income Potential in Pine (2026)
Understanding the monthly revenue variations for Airbnb listings in Pine is key to maximizing your short term rental income potential. Seasonality significantly impacts earnings. Our analysis, based on data from the past 12 months, shows that the peak revenue month for STRs in Pine is typically July, while January often presents the lowest earnings, highlighting opportunities for strategic pricing adjustments during shoulder and low seasons. Explore the typical Airbnb income in Pine across different performance tiers:
- Best-in-class properties (Top 10%) achieve $9,160+ monthly, often utilizing dynamic pricing and superior guest experiences.
- Strong performing properties (Top 25%) earn $4,752 or more, indicating effective management and desirable locations/amenities.
- Typical properties (Median) generate around $2,516 per month, representing the average market performance.
- Entry-level properties (Bottom 25%) see earnings around $1,671, often with potential for optimization.
Average Monthly Airbnb Earnings Trend in Pine
Pine Airbnb Occupancy Rate Trends (2026)
Maximize your bookings by understanding the Pine STR occupancy trends. Seasonal demand shifts significantly influence how often properties are booked. Typically, Julysees the highest demand (peak season occupancy), while January experiences the lowest (low season). Effective strategies, like adjusting minimum stays or offering promotions, can boost occupancy during slower periods. Here's how different property tiers perform in Pine:
- Best-in-class properties (Top 10%) achieve 79%+ occupancy, indicating high desirability and potentially optimized availability.
- Strong performing properties (Top 25%) maintain 64% or higher occupancy, suggesting good market fit and guest satisfaction.
- Typical properties (Median) have an occupancy rate around 45%.
- Entry-level properties (Bottom 25%) average 28% occupancy, potentially facing higher vacancy.
Average Monthly Occupancy Rate Trend in Pine
Average Daily Rate (ADR) Airbnb Trends in Pine (2026)
Effective short term rental pricing strategy in Pine involves understanding monthly ADR fluctuations. The Average Daily Rate (ADR) for Airbnb in Pine typically peaks in December and dips lowest during March. Leveraging Airbnb dynamic pricing tools or strategies based on this seasonality can significantly boost revenue. Here's a look at the typical nightly rates achieved:
- Best-in-class properties (Top 10%) command rates of $554+ per night, often due to premium features or locations.
- Strong performing properties (Top 25%) achieve nightly rates of $372 or more.
- Typical properties (Median) charge around $195 per night.
- Entry-level properties (Bottom 25%) earn around $125 per night.
Average Daily Rate (ADR) Trend by Month in Pine
Get Live Pine Market Intelligence 👇

Explore Real-time Analytics
Airbnb Seasonality Analysis & Trends in Pine (2026)
Peak Season (July, June, August)
- Revenue averages $6,036 per month
- Occupancy rates average 65.5%
- Daily rates average $275
Shoulder Season
- Revenue averages $3,681 per month
- Occupancy maintains around 45.1%
- Daily rates hold near $279
Low Season (January, February, April)
- Revenue drops to average $2,267 per month
- Occupancy decreases to average 30.3%
- Daily rates adjust to average $252
Seasonality Insights for Pine
- The Airbnb seasonality in Pine shows highly seasonal trends requiring careful strategy. While the sections above show seasonal averages, it's also insightful to look at the extremes:
- During the high season, the absolute peak month showcases Pine's highest earning potential, with monthly revenues capable of climbing to $6,341, occupancy reaching a high of 69.6%, and ADRs peaking at $308.
- Conversely, the slowest single month of the year, typically falling within the low season, marks the market's lowest point. In this month, revenue might dip to $1,921, occupancy could drop to 24.9%, and ADRs may adjust down to $238.
- Understanding both the seasonal averages and these monthly peaks and troughs in revenue, occupancy, and ADR is crucial for maximizing your Airbnb profit potential in Pine.
Seasonal Strategies for Maximizing Profit
- Peak Season: Maximize revenue through premium pricing and potentially longer minimum stays. Ensure high availability.
- Low Season: Offer competitive pricing, special promotions (e.g., extended stay discounts), and flexible cancellation policies. Target off-season travelers like remote workers or budget-conscious guests.
- Shoulder Seasons: Implement dynamic pricing that balances peak and low rates. Target weekend travelers or specific events. Offer slightly more flexible terms than peak season.
- Regularly analyze your own performance against these Pine seasonality benchmarks and adjust your pricing and availability strategy accordingly.
Best Areas for Airbnb Investment in Pine (2026)
Exploring the top neighborhoods for short-term rentals in Pine? This section highlights key areas, outlining why they are attractive for hosts and guests, along with notable local attractions. Consider these locations based on your target guest profile and investment strategy.
| Neighborhood / Area | Why Host Here? (Target Guests & Appeal) | Key Attractions & Landmarks |
|---|---|---|
| Bailey | Charming mountain town offering easy access to outdoor activities and a relaxed vibe. Ideal for nature lovers and visitors seeking a retreat close to several hiking trails and lakes. | Shadow Mountain, Accessible hiking trails, River rafting, Fishing spots, Local eateries |
| Evergreen | Scenic town located in the foothills of the Rocky Mountains, known for its picturesque views and outdoor recreation. Great for families and travelers looking for a peaceful getaway. | Evergreen Lake, Elk Meadow Park, Evergreen Historical Society, Shopping in downtown Evergreen, Local breweries |
| Conifer | Historic community surrounded by beautiful pine forests and mountains, perfect for those wanting to immerse themselves in nature while still being close to urban amenities. | Conifer Historical Society, Lair o' the Bear Park, Local artisan shops, Conifer Marketplace, Wildlife viewing |
| Lakewood | Conveniently located near Denver, Lakewood provides suburban comforts with easy access to city attractions. A prime spot for travelers wanting a blend of urban and suburban experiences. | Lakewood's Belmar Shopping District, Red Rocks Park, Bear Creek Lake Park, Local dining options, Cultural events at Lakewood Cultural Center |
| Golden | Known for its quaint downtown and access to outdoor adventure, Golden is popular among tourists interested in history, nature, and craft breweries. Offers a vibrant local scene. | Coors Brewery Tour, Buffalo Bill Museum, Red Rocks Amphitheater, Clear Creek, Downtown Golden dining |
| Aspen Park | Secluded yet accessible mountain community, great for travelers seeking outdoor fun mixed with tranquil living. Perfect for visitors who want to enjoy mountain views and local community events. | Local art galleries, Hiking trails, Seasonal festivals, Scenic drives, Local shops |
| Idaho Springs | Historic gold rush town with a lively atmosphere and natural hot springs, attracting visitors who appreciate both history and relaxation. Offers a unique blend of adventure and leisure. | Indian Hot Springs, Mount Evans Scenic Byway, Local shops and restaurants, Gold panning experiences, Outdoor activities |
| Morrison | Small town known for its historic sites and proximity to the iconic Red Rocks Amphitheater. Ideal for visitors who enjoy music, history, and breathtaking landscapes. | Red Rocks Amphitheater, Morrison Natural History Museum, Hiking trails in the area, Local shops, Art galleries |
Understanding Airbnb License Requirements & STR Laws in Pine (2026)
While Pine, Colorado, United States currently shows low STR regulations, specific Airbnb license requirements might still exist or change. Always verify the latest short term rental regulations and Airbnb license requirements directly with local government authorities for Pine to ensure full compliance before hosting.
(Source: AirROI data, 2026, finding no licensed listings among those analyzed)
Top Performing Airbnb Properties in Pine (2026)
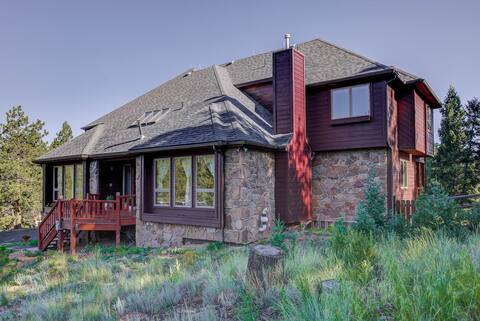
Benchmark your potential! Explore examples of top-performing Airbnb properties in Pinebased on Trailing Twelve Month (TTM) revenue. Analyze their characteristics, revenue, occupancy rate, and ADR to understand what drives success in this market.

Luxe MTN Retreat | Pickleball | HotTub | FirePit
Entire Place • 3 bedrooms
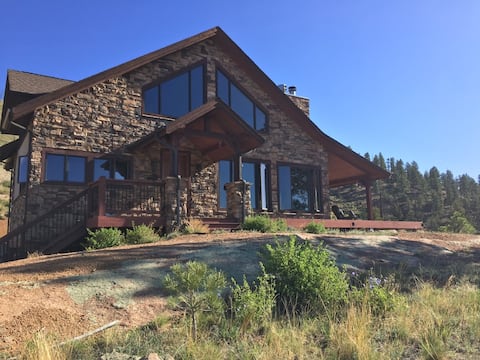
Spacious Mountain Home
Entire Place • 7 bedrooms

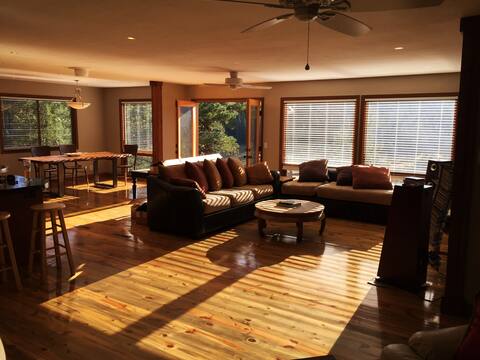
Platte River Cabin @ Pine (Main)
Entire Place • 4 bedrooms
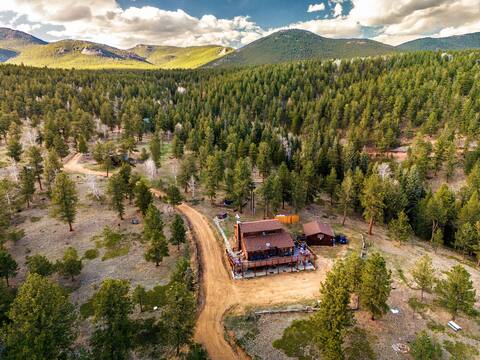
Secluded mountain home on 40 acres with views!
Entire Place • 3 bedrooms
Colorado! Views, killer hottub, private game barn!
Entire Place • 5 bedrooms
Shep’s Place
Entire Place • 3 bedrooms
Note: Performance varies based on location, size, amenities, seasonality, and management quality. Data reflects the past 12 months.
Top Performing Airbnb Hosts in Pine (2026)
Learn from the best! This table showcases top-performing Airbnb hosts in Pine based on the number of properties managed and estimated total revenue over the past year. Analyze their scale and performance metrics.
| Host Name | Properties | Grossing Revenue | Stay Reviews | Avg Rating |
|---|---|---|---|---|
| Rebecca | 1 | $177,464 | 76 | 5.00/5.0 |
| Mai | 1 | $89,463 | 107 | 4.81/5.0 |
| Adam | 2 | $89,086 | 73 | 4.97/5.0 |
| Mary | 1 | $67,860 | 57 | 4.98/5.0 |
| Sarah | 1 | $66,660 | 69 | 4.97/5.0 |
| Bill And Andrea | 1 | $55,665 | 70 | 4.99/5.0 |
| Roman | 2 | $52,838 | 110 | 4.92/5.0 |
| Jarrad | 1 | $41,823 | 163 | 4.98/5.0 |
| Evolve | 2 | $38,683 | 11 | 5.00/5.0 |
| Sojourney | 1 | $36,048 | 37 | 4.78/5.0 |
Analyzing the strategies of top hosts, such as their property selection, pricing, and guest communication, can offer valuable lessons for optimizing your own Airbnb operations in Pine.
Dive Deeper: Advanced Pine STR Market Data (2026)
Ready to unlock more insights? AirROI provides access to advanced metrics and comprehensive Airbnb data for Pine. Explore detailed analytics beyond this report to refine your investment strategy, optimize pricing, and maximize your vacation rental profits.
Explore Advanced MetricsPine Short-Term Rental Market Composition (2026): Property & Room Types
Room Type Distribution
Property Type Distribution
Market Composition Insights for Pine
- The Pine Airbnb market composition is heavily skewed towards Entire Home/Apt listings, which make up 100% of the 25 active rentals. This indicates strong guest preference for privacy and space.
- Looking at the property type distribution in Pine, Outdoor/Unique properties are the most common (56%), reflecting the local real estate landscape.
- Houses represent a significant 36% portion, catering likely to families or larger groups.
Pine Airbnb Room Capacity Analysis (2026): Bedroom Distribution
Distribution of Listings by Number of Bedrooms
Room Capacity Insights for Pine
- The dominant room capacity in Pine is 1 bedroom listings, making up 32% of the market. This suggests a strong demand for properties suitable for couples or solo travelers.
- Together, 1 bedroom and 2 bedrooms properties represent 52.0% of the active Airbnb listings in Pine, indicating a high concentration in these sizes.
- A significant 44.0% of listings offer 3+ bedrooms, catering to larger groups and families seeking more space in Pine.
Pine Vacation Rental Guest Capacity Trends (2026)
Distribution of Listings by Guest Capacity
Guest Capacity Insights for Pine
- The most common guest capacity trend in Pine vacation rentals is listings accommodating 8+ guests (28%). This suggests the primary traveler segment is likely larger groups.
- Properties designed for 8+ guests and 4 guests dominate the Pine STR market, accounting for 48.0% of listings.
- 44.0% of properties accommodate 6+ guests, serving the market segment for larger families or group travel in Pine.
- On average, properties in Pine are equipped to host 5.4 guests.
Pine Airbnb Booking Patterns (2026): Available vs. Booked Days
Available Days Distribution
Booked Days Distribution
Booking Pattern Insights for Pine
- The most common availability pattern in Pine falls within the 181-270 days range, representing 52% of listings. This suggests many properties have significant open periods on their calendars.
- Approximately 76.0% of listings show high availability (181+ days open annually), indicating potential for increased bookings or specific owner usage patterns.
- For booked days, the 91-180 days range is most frequent in Pine (48%), reflecting common guest stay durations or potential owner blocking patterns.
- A notable 28.0% of properties secure long booking periods (181+ days booked per year), highlighting successful long-term rental strategies or significant owner usage.
Pine Airbnb Minimum Stay Requirements Analysis
Distribution of Listings by Minimum Night Requirement
1 Night
3 listings
12% of total
2 Nights
11 listings
44% of total
3 Nights
2 listings
8% of total
7-29 Nights
1 listings
4% of total
30+ Nights
8 listings
32% of total
Key Insights
- The most prevalent minimum stay requirement in Pine is 2 Nights, adopted by 44% of listings. This highlights the market's preference for shorter, flexible bookings.
- A significant segment (32%) caters to monthly stays (30+ nights) in Pine, pointing to opportunities in the extended-stay market.
Recommendations
- Align with the market by considering a 2 Nights minimum stay, as 44% of Pine hosts use this setting.
- If feasible, allowing 1-night stays, especially midweek or during low season, could capture last-minute bookings, as only 12% currently do.
- A 2-night minimum appears standard (44%). Consider this for weekends or peak periods.
- Explore offering discounts for stays of 30+ nights to attract the 32% of the market seeking extended stays.
- Adjust minimum nights based on seasonality – potentially shorter during low season and longer during peak demand periods in Pine.
Pine Airbnb Cancellation Policy Trends Analysis (2026)
Flexible
3 listings
12% of total
Moderate
14 listings
56% of total
Firm
4 listings
16% of total
Strict
4 listings
16% of total
Cancellation Policy Insights for Pine
- The prevailing Airbnb cancellation policy trend in Pine is Moderate, used by 56% of listings.
- There's a relatively balanced mix between guest-friendly (68.0%) and stricter (32.0%) policies, offering choices for different guest needs.
Recommendations for Hosts
- Consider adopting a Moderate policy to align with the 56% market standard in Pine.
- Regularly review your cancellation policy against competitors and market demand shifts in Pine.
Pine STR Booking Lead Time Analysis (2026)
Average Booking Lead Time by Month
Booking Lead Time Insights for Pine
- The overall average booking lead time for vacation rentals in Pine is 72 days.
- Guests book furthest in advance for stays during September (average 112 days), likely coinciding with peak travel demand or local events.
- The shortest booking windows occur for stays in January (average 22 days), indicating more last-minute travel plans during this time.
- Seasonally, Fall (79 days avg.) sees the longest lead times, while Winter (39 days avg.) has the shortest, reflecting typical travel planning cycles.
Recommendations for Hosts
- Use the overall average lead time (72 days) as a baseline for your pricing and availability strategy in Pine.
- For September stays, consider implementing length-of-stay discounts or slightly higher rates for bookings made less than 112 days out to capitalize on advance planning.
- Target marketing efforts for the Fall season well in advance (at least 79 days) to capture early planners.
- Monitor your own booking lead times against these Pine averages to identify opportunities for dynamic pricing adjustments.
Popular & Essential Airbnb Amenities in Pine (2026)
Amenity Prevalence
Amenity Insights for Pine
- Essential amenities in Pine that guests expect include: Carbon monoxide alarm, Dishes and silverware, Smoke alarm, Essentials, Free parking on premises, Patio or balcony, Heating, Kitchen, Hot water, Coffee maker. Lacking these (any) could significantly impact bookings.
Recommendations for Hosts
- Ensure your listing includes all essential amenities for Pine: Carbon monoxide alarm, Dishes and silverware, Smoke alarm, Essentials, Free parking on premises, Patio or balcony, Heating, Kitchen, Hot water, Coffee maker.
- Prioritize adding missing essentials: Smoke alarm, Essentials, Free parking on premises, Patio or balcony, Heating, Kitchen, Hot water, Coffee maker.
- Highlight unique or less common amenities you offer (e.g., hot tub, dedicated workspace, EV charger) in your listing description and photos.
- Regularly check competitor amenities in Pine to stay competitive.
Pine Airbnb Guest Demographics & Profile Analysis (2026)
Guest Profile Summary for Pine
- The typical guest profile for Airbnb in Pine consists of primarily domestic travelers (97%), often arriving from nearby Denver, typically belonging to the Post-2000s (Gen Z/Alpha) group (50%), primarily speaking English or Spanish.
- Domestic travelers account for 97.1% of guests.
- Key international markets include United States (97.1%) and Canada (0.4%).
- Top languages spoken are English (71.1%) followed by Spanish (17.8%).
- A significant demographic segment is the Post-2000s (Gen Z/Alpha) group, representing 50% of guests.
Recommendations for Hosts
- Target domestic marketing efforts towards travelers from Denver and Colorado Springs.
- Tailor amenities and listing descriptions to appeal to the dominant Post-2000s (Gen Z/Alpha) demographic (e.g., highlight fast WiFi, smart home features, local guides).
- Highlight unique local experiences or amenities relevant to the primary guest profile.
- Consider seasonal promotions aligned with peak travel times for key origin markets.
Nearby Short-Term Rental Market Comparison
How does the Pine Airbnb market stack up against its neighbors? Compare key performance metrics like average monthly revenue, ADR, and occupancy rates in surrounding areas to understand the broader regional STR landscape.
| Market | Active Properties | Monthly Revenue | Daily Rate | Avg. Occupancy |
|---|---|---|---|---|
| Blue River | 201 | $7,203 | $609.20 | 45% |
| Aspen | 610 | $7,095 | $992.28 | 36% |
| Snowmass | 21 | $6,247 | $701.59 | 40% |
| Aspen Park | 11 | $5,825 | $395.00 | 54% |
| Indian Hills | 11 | $5,799 | $333.03 | 54% |
| Grand County | 14 | $5,137 | $513.48 | 42% |
| Breckenridge | 3,051 | $4,995 | $544.32 | 40% |
| Crested Butte | 267 | $4,956 | $536.90 | 42% |
| Snowmass Village | 636 | $4,938 | $711.61 | 35% |
| Black Hawk | 133 | $4,884 | $328.37 | 52% |