Palisade Airbnb Market Analysis 2026: Short Term Rental Data & Vacation Rental Statistics in Colorado, United States
Is Airbnb profitable in Palisade in 2026? Explore comprehensive Airbnb analytics for Palisade, Colorado, United States to uncover income potential. This 2026 STR market report for Palisade, based on AirROI data from February 2025 to January 2026, reveals key trends in the niche market of 111 active listings.
Whether you're considering an Airbnb investment in Palisade, optimizing your existing vacation rental, or exploring rental arbitrage opportunities, understanding the Palisade Airbnb data is crucial. Leveraging the low regulation environment is key to maximizing your short term rental income potential. Let's dive into the specifics.
Key Palisade Airbnb Performance Metrics Overview
Monthly Airbnb Revenue Variations & Income Potential in Palisade (2026)
Understanding the monthly revenue variations for Airbnb listings in Palisade is key to maximizing your short term rental income potential. Seasonality significantly impacts earnings. Our analysis, based on data from the past 12 months, shows that the peak revenue month for STRs in Palisade is typically June, while January often presents the lowest earnings, highlighting opportunities for strategic pricing adjustments during shoulder and low seasons. Explore the typical Airbnb income in Palisade across different performance tiers:
- Best-in-class properties (Top 10%) achieve $6,058+ monthly, often utilizing dynamic pricing and superior guest experiences.
- Strong performing properties (Top 25%) earn $4,195 or more, indicating effective management and desirable locations/amenities.
- Typical properties (Median) generate around $2,734 per month, representing the average market performance.
- Entry-level properties (Bottom 25%) see earnings around $1,362, often with potential for optimization.
Average Monthly Airbnb Earnings Trend in Palisade
Palisade Airbnb Occupancy Rate Trends (2026)
Maximize your bookings by understanding the Palisade STR occupancy trends. Seasonal demand shifts significantly influence how often properties are booked. Typically, Augustsees the highest demand (peak season occupancy), while January experiences the lowest (low season). Effective strategies, like adjusting minimum stays or offering promotions, can boost occupancy during slower periods. Here's how different property tiers perform in Palisade:
- Best-in-class properties (Top 10%) achieve 74%+ occupancy, indicating high desirability and potentially optimized availability.
- Strong performing properties (Top 25%) maintain 58% or higher occupancy, suggesting good market fit and guest satisfaction.
- Typical properties (Median) have an occupancy rate around 39%.
- Entry-level properties (Bottom 25%) average 22% occupancy, potentially facing higher vacancy.
Average Monthly Occupancy Rate Trend in Palisade
Average Daily Rate (ADR) Airbnb Trends in Palisade (2026)
Effective short term rental pricing strategy in Palisade involves understanding monthly ADR fluctuations. The Average Daily Rate (ADR) for Airbnb in Palisade typically peaks in June and dips lowest during February. Leveraging Airbnb dynamic pricing tools or strategies based on this seasonality can significantly boost revenue. Here's a look at the typical nightly rates achieved:
- Best-in-class properties (Top 10%) command rates of $457+ per night, often due to premium features or locations.
- Strong performing properties (Top 25%) achieve nightly rates of $294 or more.
- Typical properties (Median) charge around $203 per night.
- Entry-level properties (Bottom 25%) earn around $154 per night.
Average Daily Rate (ADR) Trend by Month in Palisade
Get Live Palisade Market Intelligence 👇

Explore Real-time Analytics
Airbnb Seasonality Analysis & Trends in Palisade (2026)
Peak Season (June, August, May)
- Revenue averages $4,160 per month
- Occupancy rates average 51.9%
- Daily rates average $260
Shoulder Season
- Revenue averages $3,336 per month
- Occupancy maintains around 42.3%
- Daily rates hold near $251
Low Season (January, February, December)
- Revenue drops to average $1,949 per month
- Occupancy decreases to average 28.1%
- Daily rates adjust to average $235
Seasonality Insights for Palisade
- The Airbnb seasonality in Palisade shows highly seasonal trends requiring careful strategy. While the sections above show seasonal averages, it's also insightful to look at the extremes:
- During the high season, the absolute peak month showcases Palisade's highest earning potential, with monthly revenues capable of climbing to $4,246, occupancy reaching a high of 55.3%, and ADRs peaking at $268.
- Conversely, the slowest single month of the year, typically falling within the low season, marks the market's lowest point. In this month, revenue might dip to $1,361, occupancy could drop to 21.8%, and ADRs may adjust down to $224.
- Understanding both the seasonal averages and these monthly peaks and troughs in revenue, occupancy, and ADR is crucial for maximizing your Airbnb profit potential in Palisade.
Seasonal Strategies for Maximizing Profit
- Peak Season: Maximize revenue through premium pricing and potentially longer minimum stays. Ensure high availability.
- Low Season: Offer competitive pricing, special promotions (e.g., extended stay discounts), and flexible cancellation policies. Target off-season travelers like remote workers or budget-conscious guests.
- Shoulder Seasons: Implement dynamic pricing that balances peak and low rates. Target weekend travelers or specific events. Offer slightly more flexible terms than peak season.
- Regularly analyze your own performance against these Palisade seasonality benchmarks and adjust your pricing and availability strategy accordingly.
Best Areas for Airbnb Investment in Palisade (2026)
Exploring the top neighborhoods for short-term rentals in Palisade? This section highlights key areas, outlining why they are attractive for hosts and guests, along with notable local attractions. Consider these locations based on your target guest profile and investment strategy.
| Neighborhood / Area | Why Host Here? (Target Guests & Appeal) | Key Attractions & Landmarks |
|---|---|---|
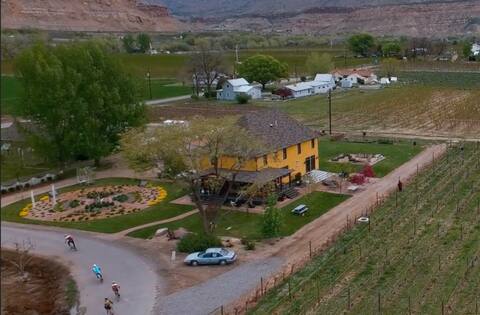
| Palisade Riverfront | Scenic location along the Colorado River, perfect for outdoor activities such as rafting and biking. Attracts visitors looking for nature and adventure-centric experiences. | Colorado River, Riverbend Park, Palisade Plunge Trail, Fishing and biking opportunities, Wine tasting rooms |
| Wine Country | Known for its vineyards and wineries, this area is ideal for those who appreciate fine wines and local produce. Great for weekend getaways and culinary experiences. | Winery tours, Fruit and wine festivals, Palisade State Park, Local farmers markets |
| Downtown Palisade | Charming historic downtown with local shops and eateries. Its quaint atmosphere attracts visitors looking to explore local culture and cuisine. | Palisade Historic District, Local boutiques and galleries, Cafés and restaurants, Palisade Brewery |
| Peach Valley | Famous for its peaches and agricultural activities, this area appeals to those interested in a rural, farm-to-table experience during the harvest seasons. | Peach orchards, Farmers markets, Agricultural tours, Seasonal festivals |
| Grand Mesa | Just a short drive from Palisade, Grand Mesa offers breathtaking views and a range of outdoor recreational activities year-round, attracting nature lovers. | Grand Mesa National Forest, Hiking and skiing, Lake fishing, Wildflower viewing |
| Highland Mesa | Surrounded by stunning mountain views, this area is perfect for those seeking a peaceful retreat with access to outdoor adventures. | Biking trails, Hiking paths, Scenic vistas, Wildlife viewing |
| Loma | A gateway to outdoor adventure, Loma offers easy access to camping and river activities. A great spot for those looking to escape the city. | Loma exit rafting launches, The Colorado River, Camping grounds, Scenic picnic areas |
| Fruitvale | Close to the town of Fruita and various outdoor recreational venues; great for families and visitors seeking a blend of outdoor and urban activities. | Mountain biking at the 18 Road trailhead, Fruita downtown arts and dining, Nearby state parks, Scenic drives |
Understanding Airbnb License Requirements & STR Laws in Palisade (2026)
While Palisade, Colorado, United States currently shows low STR regulations, specific Airbnb license requirements might still exist or change. Always verify the latest short term rental regulations and Airbnb license requirements directly with local government authorities for Palisade to ensure full compliance before hosting.
(Source: AirROI data, 2026, based on 1% licensed listings)
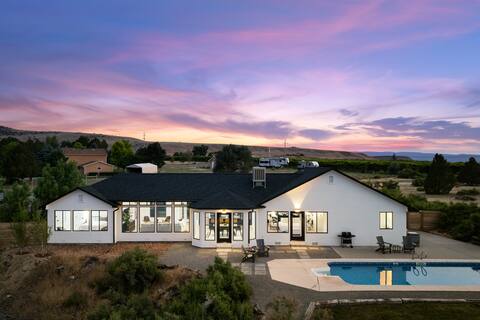
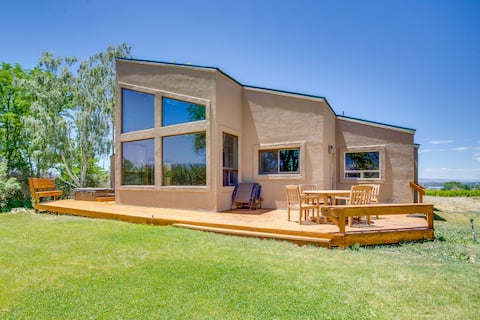
Top Performing Airbnb Properties in Palisade (2026)
Benchmark your potential! Explore examples of top-performing Airbnb properties in Palisadebased on Trailing Twelve Month (TTM) revenue. Analyze their characteristics, revenue, occupancy rate, and ADR to understand what drives success in this market.

Farmhouse surrounded by orchards w/ patio, hot tub
Entire Place • 2 bedrooms

Lakefront animal sanctuary house & guest house
Entire Place • 6 bedrooms
Fabulous Farmhouse-LARGE HOUSE-perfect for groups!
Entire Place • 5 bedrooms
Modern Pali Farmhouse & Vineyard with hot tub
Entire Place • 3 bedrooms
Brand New Listing - The Mesa ViewHouse!
Entire Place • 3 bedrooms
Hot Tub, Wineries, Mtn Views: Palisade Home!
Entire Place • 3 bedrooms
Note: Performance varies based on location, size, amenities, seasonality, and management quality. Data reflects the past 12 months.
Top Performing Airbnb Hosts in Palisade (2026)
Learn from the best! This table showcases top-performing Airbnb hosts in Palisade based on the number of properties managed and estimated total revenue over the past year. Analyze their scale and performance metrics.
| Host Name | Properties | Grossing Revenue | Stay Reviews | Avg Rating |
|---|---|---|---|---|
| Thomas | 1 | $131,854 | 48 | 4.81/5.0 |
| Evolve | 3 | $113,975 | 101 | 4.97/5.0 |
| Carol | 3 | $106,378 | 301 | 4.99/5.0 |
| Happy | 1 | $103,180 | 171 | 4.90/5.0 |
| Cameron | 2 | $101,785 | 159 | 4.96/5.0 |
| John And Beth | 2 | $98,158 | 547 | 4.84/5.0 |
| Jenn | 2 | $95,337 | 902 | 4.88/5.0 |
| Lisa | 1 | $93,215 | 120 | 5.00/5.0 |
| Sheri | 2 | $91,955 | 255 | 4.93/5.0 |
| Annie | 1 | $88,582 | 76 | 4.99/5.0 |
Analyzing the strategies of top hosts, such as their property selection, pricing, and guest communication, can offer valuable lessons for optimizing your own Airbnb operations in Palisade.
Dive Deeper: Advanced Palisade STR Market Data (2026)
Ready to unlock more insights? AirROI provides access to advanced metrics and comprehensive Airbnb data for Palisade. Explore detailed analytics beyond this report to refine your investment strategy, optimize pricing, and maximize your vacation rental profits.
Explore Advanced MetricsPalisade Short-Term Rental Market Composition (2026): Property & Room Types
Room Type Distribution
Property Type Distribution
Market Composition Insights for Palisade
- The Palisade Airbnb market composition is heavily skewed towards Entire Home/Apt listings, which make up 82% of the 111 active rentals. This indicates strong guest preference for privacy and space.
- Looking at the property type distribution in Palisade, House properties are the most common (55%), reflecting the local real estate landscape.
- Houses represent a significant 55% portion, catering likely to families or larger groups.
- The presence of 18% Hotel/Boutique listings indicates integration with traditional hospitality.
- Smaller segments like others, unique stays, apartment/condo (combined 9.0%) offer potential for unique stay experiences.
Palisade Airbnb Room Capacity Analysis (2026): Bedroom Distribution
Distribution of Listings by Number of Bedrooms
Room Capacity Insights for Palisade
- The dominant room capacity in Palisade is 1 bedroom listings, making up 27% of the market. This suggests a strong demand for properties suitable for couples or solo travelers.
- Together, 1 bedroom and 2 bedrooms properties represent 47.7% of the active Airbnb listings in Palisade, indicating a high concentration in these sizes.
- A significant 39.6% of listings offer 3+ bedrooms, catering to larger groups and families seeking more space in Palisade.
Palisade Vacation Rental Guest Capacity Trends (2026)
Distribution of Listings by Guest Capacity
Guest Capacity Insights for Palisade
- The most common guest capacity trend in Palisade vacation rentals is listings accommodating 8+ guests (24.3%). This suggests the primary traveler segment is likely larger groups.
- Properties designed for 8+ guests and 4 guests dominate the Palisade STR market, accounting for 46.8% of listings.
- 44.1% of properties accommodate 6+ guests, serving the market segment for larger families or group travel in Palisade.
- On average, properties in Palisade are equipped to host 4.6 guests.
Palisade Airbnb Booking Patterns (2026): Available vs. Booked Days
Available Days Distribution
Booked Days Distribution
Booking Pattern Insights for Palisade
- The most common availability pattern in Palisade falls within the 181-270 days range, representing 46.8% of listings. This suggests many properties have significant open periods on their calendars.
- Approximately 82.8% of listings show high availability (181+ days open annually), indicating potential for increased bookings or specific owner usage patterns.
- For booked days, the 91-180 days range is most frequent in Palisade (47.7%), reflecting common guest stay durations or potential owner blocking patterns.
- A notable 17.1% of properties secure long booking periods (181+ days booked per year), highlighting successful long-term rental strategies or significant owner usage.
Palisade Airbnb Minimum Stay Requirements Analysis
Distribution of Listings by Minimum Night Requirement
1 Night
36 listings
32.4% of total
2 Nights
44 listings
39.6% of total
3 Nights
1 listings
0.9% of total
7-29 Nights
5 listings
4.5% of total
30+ Nights
25 listings
22.5% of total
Key Insights
- The most prevalent minimum stay requirement in Palisade is 2 Nights, adopted by 39.6% of listings. This highlights the market's preference for shorter, flexible bookings.
- A strong majority (72.0%) of the Palisade Airbnb data shows acceptance of very short stays (1-2 nights), indicating a dynamic, high-turnover market.
- A significant segment (22.5%) caters to monthly stays (30+ nights) in Palisade, pointing to opportunities in the extended-stay market.
Recommendations
- Align with the market by considering a 2 Nights minimum stay, as 39.6% of Palisade hosts use this setting.
- Explore offering discounts for stays of 30+ nights to attract the 22.5% of the market seeking extended stays.
- Adjust minimum nights based on seasonality – potentially shorter during low season and longer during peak demand periods in Palisade.
Palisade Airbnb Cancellation Policy Trends Analysis (2026)
Super Strict 30 Days
1 listings
0.9% of total
Flexible
23 listings
20.7% of total
Moderate
24 listings
21.6% of total
Firm
56 listings
50.5% of total
Strict
7 listings
6.3% of total
Cancellation Policy Insights for Palisade
- The prevailing Airbnb cancellation policy trend in Palisade is Firm, used by 50.5% of listings.
- A majority (56.8%) of hosts in Palisade utilize Firm or Strict policies, indicating a market where hosts prioritize booking security.
- Strict cancellation policies are quite rare (6.3%), potentially making listings with this policy less competitive unless justified by high demand or property type.
Recommendations for Hosts
- Consider adopting a Firm policy to align with the 50.5% market standard in Palisade.
- Using a Strict policy might deter some guests, as only 6.3% of listings use it. Evaluate if potential revenue protection outweighs possible lower booking rates.
- Regularly review your cancellation policy against competitors and market demand shifts in Palisade.
Palisade STR Booking Lead Time Analysis (2026)
Average Booking Lead Time by Month
Booking Lead Time Insights for Palisade
- The overall average booking lead time for vacation rentals in Palisade is 61 days.
- Guests book furthest in advance for stays during September (average 95 days), likely coinciding with peak travel demand or local events.
- The shortest booking windows occur for stays in January (average 31 days), indicating more last-minute travel plans during this time.
- Seasonally, Fall (68 days avg.) sees the longest lead times, while Winter (36 days avg.) has the shortest, reflecting typical travel planning cycles.
Recommendations for Hosts
- Use the overall average lead time (61 days) as a baseline for your pricing and availability strategy in Palisade.
- For September stays, consider implementing length-of-stay discounts or slightly higher rates for bookings made less than 95 days out to capitalize on advance planning.
- Target marketing efforts for the Fall season well in advance (at least 68 days) to capture early planners.
- Monitor your own booking lead times against these Palisade averages to identify opportunities for dynamic pricing adjustments.
Popular & Essential Airbnb Amenities in Palisade (2026)
Amenity Prevalence
Amenity Insights for Palisade
- Essential amenities in Palisade that guests expect include: Free parking on premises, Wifi, Smoke alarm, Air conditioning. Lacking these (any) could significantly impact bookings.
- Popular amenities like Carbon monoxide alarm, Heating, Refrigerator are common but not universal. Offering these can provide a competitive edge.
Recommendations for Hosts
- Ensure your listing includes all essential amenities for Palisade: Free parking on premises, Wifi, Smoke alarm, Air conditioning.
- Prioritize adding missing essentials: Free parking on premises, Wifi, Smoke alarm, Air conditioning.
- Consider adding popular differentiators like Carbon monoxide alarm or Heating to increase appeal.
- Highlight unique or less common amenities you offer (e.g., hot tub, dedicated workspace, EV charger) in your listing description and photos.
- Regularly check competitor amenities in Palisade to stay competitive.
Palisade Airbnb Guest Demographics & Profile Analysis (2026)
Guest Profile Summary for Palisade
- The typical guest profile for Airbnb in Palisade consists of primarily domestic travelers (98%), often arriving from nearby Denver, typically belonging to the Post-2000s (Gen Z/Alpha) group (50%), primarily speaking English or Spanish.
- Domestic travelers account for 98.0% of guests.
- Key international markets include United States (98%) and United Kingdom (0.6%).
- Top languages spoken are English (75.4%) followed by Spanish (12.6%).
- A significant demographic segment is the Post-2000s (Gen Z/Alpha) group, representing 50% of guests.
Recommendations for Hosts
- Target domestic marketing efforts towards travelers from Denver and Littleton.
- Tailor amenities and listing descriptions to appeal to the dominant Post-2000s (Gen Z/Alpha) demographic (e.g., highlight fast WiFi, smart home features, local guides).
- Highlight unique local experiences or amenities relevant to the primary guest profile.
- Consider seasonal promotions aligned with peak travel times for key origin markets.
Nearby Short-Term Rental Market Comparison
How does the Palisade Airbnb market stack up against its neighbors? Compare key performance metrics like average monthly revenue, ADR, and occupancy rates in surrounding areas to understand the broader regional STR landscape.
| Market | Active Properties | Monthly Revenue | Daily Rate | Avg. Occupancy |
|---|---|---|---|---|
| El Jebel | 33 | $6,236 | $506.29 | 48% |
| Glenwood Springs | 242 | $5,039 | $356.03 | 49% |
| Placerville | 19 | $4,824 | $525.16 | 41% |
| Spanish Valley | 96 | $4,655 | $353.11 | 45% |
| Ouray | 179 | $4,340 | $359.44 | 47% |
| Carbondale | 142 | $4,294 | $383.58 | 47% |
| Moab | 1,006 | $4,110 | $313.12 | 48% |
| Basalt | 94 | $3,975 | $434.05 | 44% |
| San Miguel County | 10 | $3,695 | $645.03 | 37% |
| Ridgway | 111 | $3,413 | $322.56 | 47% |