Nederland Airbnb Market Analysis 2026: Short Term Rental Data & Vacation Rental Statistics in Colorado, United States
Is Airbnb profitable in Nederland in 2026? Explore comprehensive Airbnb analytics for Nederland, Colorado, United States to uncover income potential. This 2026 STR market report for Nederland, based on AirROI data from February 2025 to January 2026, reveals key trends in the niche market of 82 active listings.
Whether you're considering an Airbnb investment in Nederland, optimizing your existing vacation rental, or exploring rental arbitrage opportunities, understanding the Nederland Airbnb data is crucial. Understanding the local regulations is key to maximizing your short term rental income potential. Let's dive into the specifics.
Key Nederland Airbnb Performance Metrics Overview
Monthly Airbnb Revenue Variations & Income Potential in Nederland (2026)
Understanding the monthly revenue variations for Airbnb listings in Nederland is key to maximizing your short term rental income potential. Seasonality significantly impacts earnings. Our analysis, based on data from the past 12 months, shows that the peak revenue month for STRs in Nederland is typically July, while April often presents the lowest earnings, highlighting opportunities for strategic pricing adjustments during shoulder and low seasons. Explore the typical Airbnb income in Nederland across different performance tiers:
- Best-in-class properties (Top 10%) achieve $9,855+ monthly, often utilizing dynamic pricing and superior guest experiences.
- Strong performing properties (Top 25%) earn $5,531 or more, indicating effective management and desirable locations/amenities.
- Typical properties (Median) generate around $3,500 per month, representing the average market performance.
- Entry-level properties (Bottom 25%) see earnings around $2,079, often with potential for optimization.
Average Monthly Airbnb Earnings Trend in Nederland
Nederland Airbnb Occupancy Rate Trends (2026)
Maximize your bookings by understanding the Nederland STR occupancy trends. Seasonal demand shifts significantly influence how often properties are booked. Typically, Julysees the highest demand (peak season occupancy), while April experiences the lowest (low season). Effective strategies, like adjusting minimum stays or offering promotions, can boost occupancy during slower periods. Here's how different property tiers perform in Nederland:
- Best-in-class properties (Top 10%) achieve 79%+ occupancy, indicating high desirability and potentially optimized availability.
- Strong performing properties (Top 25%) maintain 65% or higher occupancy, suggesting good market fit and guest satisfaction.
- Typical properties (Median) have an occupancy rate around 48%.
- Entry-level properties (Bottom 25%) average 31% occupancy, potentially facing higher vacancy.
Average Monthly Occupancy Rate Trend in Nederland
Average Daily Rate (ADR) Airbnb Trends in Nederland (2026)
Effective short term rental pricing strategy in Nederland involves understanding monthly ADR fluctuations. The Average Daily Rate (ADR) for Airbnb in Nederland typically peaks in December and dips lowest during April. Leveraging Airbnb dynamic pricing tools or strategies based on this seasonality can significantly boost revenue. Here's a look at the typical nightly rates achieved:
- Best-in-class properties (Top 10%) command rates of $573+ per night, often due to premium features or locations.
- Strong performing properties (Top 25%) achieve nightly rates of $348 or more.
- Typical properties (Median) charge around $213 per night.
- Entry-level properties (Bottom 25%) earn around $150 per night.
Average Daily Rate (ADR) Trend by Month in Nederland
Get Live Nederland Market Intelligence 👇

Explore Real-time Analytics
Airbnb Seasonality Analysis & Trends in Nederland (2026)
Peak Season (July, August, June)
- Revenue averages $6,317 per month
- Occupancy rates average 62.3%
- Daily rates average $294
Shoulder Season
- Revenue averages $4,426 per month
- Occupancy maintains around 45.8%
- Daily rates hold near $288
Low Season (January, February, April)
- Revenue drops to average $3,566 per month
- Occupancy decreases to average 37.4%
- Daily rates adjust to average $271
Seasonality Insights for Nederland
- The Airbnb seasonality in Nederland shows highly seasonal trends requiring careful strategy. While the sections above show seasonal averages, it's also insightful to look at the extremes:
- During the high season, the absolute peak month showcases Nederland's highest earning potential, with monthly revenues capable of climbing to $7,067, occupancy reaching a high of 69.4%, and ADRs peaking at $304.
- Conversely, the slowest single month of the year, typically falling within the low season, marks the market's lowest point. In this month, revenue might dip to $3,484, occupancy could drop to 31.9%, and ADRs may adjust down to $262.
- Understanding both the seasonal averages and these monthly peaks and troughs in revenue, occupancy, and ADR is crucial for maximizing your Airbnb profit potential in Nederland.
Seasonal Strategies for Maximizing Profit
- Peak Season: Maximize revenue through premium pricing and potentially longer minimum stays. Ensure high availability.
- Low Season: Offer competitive pricing, special promotions (e.g., extended stay discounts), and flexible cancellation policies. Target off-season travelers like remote workers or budget-conscious guests.
- Shoulder Seasons: Implement dynamic pricing that balances peak and low rates. Target weekend travelers or specific events. Offer slightly more flexible terms than peak season.
- Regularly analyze your own performance against these Nederland seasonality benchmarks and adjust your pricing and availability strategy accordingly.
Best Areas for Airbnb Investment in Nederland (2026)
Exploring the top neighborhoods for short-term rentals in Nederland? This section highlights key areas, outlining why they are attractive for hosts and guests, along with notable local attractions. Consider these locations based on your target guest profile and investment strategy.
| Neighborhood / Area | Why Host Here? (Target Guests & Appeal) | Key Attractions & Landmarks |
|---|---|---|
| Nederland Historic District | A charming small town with a historical backdrop, known for its unique architecture and art scene, attracting tourists looking for a quaint getaway in the mountains. | Nederland Mining Museum, Carousel of Happiness, Lake Eldora, Peak to Peak Scenic Byway, Boulder County Forest |
| Eldora Mountain Resort | A popular destination for outdoor enthusiasts, providing year-round activities like skiing, hiking, and mountain biking, this area appeals to both adventure seekers and families. | Eldora Ski Resort, Hiking Trails, Mountain Biking Trails, Winter Sports Festivals, Alpenglow Mountain Sightseeing |
| Lakeside | A serene area near the Barker Reservoir and the Barker Dam, perfect for nature lovers and those who enjoy fishing, hiking, and mountain views. | Barker Reservoir, Barker Dam, Fishing and boating, Scenic hiking trails, Wildlife watching |
| Gold Hill | A historic mining town that offers a glimpse into Colorado's past, known for its vibrant arts community and stunning views, attracting tourists interested in history and culture. | Gold Hill Historical Society, Gold Hill Store, Scenic Views of the Rockies, Art galleries, Music festivals in summer |
| Longs Peak | Famous for its stunning mountain scenery and hiking trails, this area attracts serious hikers and outdoor enthusiasts looking for spectacular views and challenging treks. | Longs Peak Trail, Rocky Mountain National Park, Alpine Lakes, Backpacking routes, Wildflower viewing |
| Boulder | Nearby Boulder is an urban hub offering a mix of outdoor recreation, dining, and nightlife, drawing visitors looking for a vibrant community with ample amenities. | Pearl Street Mall, Chautauqua Park, Flatirons, Boulder Creek, University of Colorado Boulder |
| Winter Park | A well-known ski resort town close to Nederland, perfect for winter sports lovers and summer festival-goers, offering a mix of adventure and relaxation. | Winter Park Resort, Mary Jane Ski Area, Mountain biking, Rocky Mountain Repertory Theatre, Summer concerts |
| Rollinsville | A quiet, scenic town offering access to stunning landscapes and outdoor activities, appealing to visitors seeking peace and natural beauty away from the crowds. | Rollins Pass, Scenic Byways, Coyote Trail, Fishing spots, Wildflower hikes |
Understanding Airbnb License Requirements & STR Laws in Nederland (2026)
With 26% of listings showing registration in 2026, understanding potential Airbnb license requirements is crucial in Nederland. Always verify the latest short term rental regulations and Airbnb license requirements directly with local government authorities for Nederland to ensure full compliance before hosting.
(Source: AirROI data, 2026, based on 26% licensed listings)
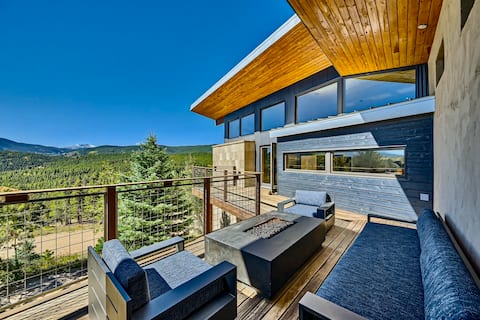
Top Performing Airbnb Properties in Nederland (2026)
Benchmark your potential! Explore examples of top-performing Airbnb properties in Nederlandbased on Trailing Twelve Month (TTM) revenue. Analyze their characteristics, revenue, occupancy rate, and ADR to understand what drives success in this market.

Mt View Ski Retreat | Hot Tub | Eldora | Gym
Entire Place • 4 bedrooms

Spacious Luxury Home - Hot Tub/EV Charger
Entire Place • 4 bedrooms

5-Star! Panoramic View, Hot Tub, Game Room, Family
Entire Place • 5 bedrooms

Luxury Log Cabin with Private Lake on 23 acres.
Entire Place • 5 bedrooms
Caribou Ridge | Hot Tub, Dog Friendly, Peak Views
Entire Place • 4 bedrooms

Huge Log Home on Private Land in the Rockies
Entire Place • 5 bedrooms
Note: Performance varies based on location, size, amenities, seasonality, and management quality. Data reflects the past 12 months.
Top Performing Airbnb Hosts in Nederland (2026)
Learn from the best! This table showcases top-performing Airbnb hosts in Nederland based on the number of properties managed and estimated total revenue over the past year. Analyze their scale and performance metrics.
| Host Name | Properties | Grossing Revenue | Stay Reviews | Avg Rating |
|---|---|---|---|---|
| Maddie | 2 | $232,510 | 116 | 4.98/5.0 |
| SkyRun | 3 | $230,433 | 160 | 4.93/5.0 |
| Chelsea | 1 | $189,610 | 76 | 4.97/5.0 |
| Brigitte | 1 | $177,841 | 51 | 5.00/5.0 |
| Jorge | 1 | $171,004 | 106 | 4.95/5.0 |
| Katherine | 3 | $125,878 | 59 | 4.97/5.0 |
| Justin | 1 | $112,416 | 41 | 5.00/5.0 |
| Zac And Lisa | 1 | $109,958 | 245 | 4.94/5.0 |
| Sirishom | 1 | $100,713 | 43 | 4.79/5.0 |
| Kirk | 1 | $89,471 | 121 | 4.84/5.0 |
Analyzing the strategies of top hosts, such as their property selection, pricing, and guest communication, can offer valuable lessons for optimizing your own Airbnb operations in Nederland.
Dive Deeper: Advanced Nederland STR Market Data (2026)
Ready to unlock more insights? AirROI provides access to advanced metrics and comprehensive Airbnb data for Nederland. Explore detailed analytics beyond this report to refine your investment strategy, optimize pricing, and maximize your vacation rental profits.
Explore Advanced MetricsNederland Short-Term Rental Market Composition (2026): Property & Room Types
Room Type Distribution
Property Type Distribution
Market Composition Insights for Nederland
- The Nederland Airbnb market composition is heavily skewed towards Entire Home/Apt listings, which make up 92.7% of the 82 active rentals. This indicates strong guest preference for privacy and space.
- Looking at the property type distribution in Nederland, House properties are the most common (56.1%), reflecting the local real estate landscape.
- Houses represent a significant 56.1% portion, catering likely to families or larger groups.
- The presence of 6.1% Hotel/Boutique listings indicates integration with traditional hospitality.
Nederland Airbnb Room Capacity Analysis (2026): Bedroom Distribution
Distribution of Listings by Number of Bedrooms
Room Capacity Insights for Nederland
- The dominant room capacity in Nederland is 3 bedrooms listings, making up 29.3% of the market. This suggests a strong demand for properties suitable for families or small groups.
- Together, 3 bedrooms and 1 bedroom properties represent 53.7% of the active Airbnb listings in Nederland, indicating a high concentration in these sizes.
- A significant 47.6% of listings offer 3+ bedrooms, catering to larger groups and families seeking more space in Nederland.
Nederland Vacation Rental Guest Capacity Trends (2026)
Distribution of Listings by Guest Capacity
Guest Capacity Insights for Nederland
- The most common guest capacity trend in Nederland vacation rentals is listings accommodating 8+ guests (23.2%). This suggests the primary traveler segment is likely larger groups.
- Properties designed for 8+ guests and 6 guests dominate the Nederland STR market, accounting for 46.4% of listings.
- 48.8% of properties accommodate 6+ guests, serving the market segment for larger families or group travel in Nederland.
- On average, properties in Nederland are equipped to host 4.9 guests.
Nederland Airbnb Booking Patterns (2026): Available vs. Booked Days
Available Days Distribution
Booked Days Distribution
Booking Pattern Insights for Nederland
- The most common availability pattern in Nederland falls within the 181-270 days range, representing 48.8% of listings. This suggests many properties have significant open periods on their calendars.
- Approximately 70.8% of listings show high availability (181+ days open annually), indicating potential for increased bookings or specific owner usage patterns.
- For booked days, the 91-180 days range is most frequent in Nederland (45.1%), reflecting common guest stay durations or potential owner blocking patterns.
- A notable 32.9% of properties secure long booking periods (181+ days booked per year), highlighting successful long-term rental strategies or significant owner usage.
Nederland Airbnb Minimum Stay Requirements Analysis
Distribution of Listings by Minimum Night Requirement
1 Night
9 listings
11% of total
2 Nights
22 listings
26.8% of total
3 Nights
5 listings
6.1% of total
4-6 Nights
5 listings
6.1% of total
30+ Nights
41 listings
50% of total
Key Insights
- The most prevalent minimum stay requirement in Nederland is 30+ Nights, adopted by 50% of listings. This highlights the market's preference for longer commitments.
- A significant segment (50%) caters to monthly stays (30+ nights) in Nederland, pointing to opportunities in the extended-stay market.
Recommendations
- Align with the market by considering a 30+ Nights minimum stay, as 50% of Nederland hosts use this setting.
- If feasible, allowing 1-night stays, especially midweek or during low season, could capture last-minute bookings, as only 11% currently do.
- Explore offering discounts for stays of 30+ nights to attract the 50% of the market seeking extended stays.
- Adjust minimum nights based on seasonality – potentially shorter during low season and longer during peak demand periods in Nederland.
Nederland Airbnb Cancellation Policy Trends Analysis (2026)
Super Strict 60 Days
1 listings
1.2% of total
Limited
4 listings
4.9% of total
Super Strict 30 Days
1 listings
1.2% of total
Flexible
4 listings
4.9% of total
Moderate
29 listings
35.4% of total
Firm
36 listings
43.9% of total
Strict
7 listings
8.5% of total
Cancellation Policy Insights for Nederland
- The prevailing Airbnb cancellation policy trend in Nederland is Firm, used by 43.9% of listings.
- A majority (52.4%) of hosts in Nederland utilize Firm or Strict policies, indicating a market where hosts prioritize booking security.
- Strict cancellation policies are quite rare (8.5%), potentially making listings with this policy less competitive unless justified by high demand or property type.
Recommendations for Hosts
- Consider adopting a Firm policy to align with the 43.9% market standard in Nederland.
- Using a Strict policy might deter some guests, as only 8.5% of listings use it. Evaluate if potential revenue protection outweighs possible lower booking rates.
- Regularly review your cancellation policy against competitors and market demand shifts in Nederland.
Nederland STR Booking Lead Time Analysis (2026)
Average Booking Lead Time by Month
Booking Lead Time Insights for Nederland
- The overall average booking lead time for vacation rentals in Nederland is 50 days.
- Guests book furthest in advance for stays during July (average 73 days), likely coinciding with peak travel demand or local events.
- The shortest booking windows occur for stays in March (average 36 days), indicating more last-minute travel plans during this time.
- Seasonally, Summer (59 days avg.) sees the longest lead times, while Spring (44 days avg.) has the shortest, reflecting typical travel planning cycles.
Recommendations for Hosts
- Use the overall average lead time (50 days) as a baseline for your pricing and availability strategy in Nederland.
- For July stays, consider implementing length-of-stay discounts or slightly higher rates for bookings made less than 73 days out to capitalize on advance planning.
- Target marketing efforts for the Summer season well in advance (at least 59 days) to capture early planners.
- Monitor your own booking lead times against these Nederland averages to identify opportunities for dynamic pricing adjustments.
Popular & Essential Airbnb Amenities in Nederland (2026)
Amenity Prevalence
Amenity Insights for Nederland
- Essential amenities in Nederland that guests expect include: Smoke alarm, Heating, Hot water, Free parking on premises, Wifi, Carbon monoxide alarm, Dishes and silverware, Essentials. Lacking these (any) could significantly impact bookings.
- Popular amenities like Coffee maker, Fire extinguisher are common but not universal. Offering these can provide a competitive edge.
Recommendations for Hosts
- Ensure your listing includes all essential amenities for Nederland: Smoke alarm, Heating, Hot water, Free parking on premises, Wifi, Carbon monoxide alarm, Dishes and silverware, Essentials.
- Prioritize adding missing essentials: Hot water, Free parking on premises, Wifi, Carbon monoxide alarm, Dishes and silverware, Essentials.
- Consider adding popular differentiators like Coffee maker or Fire extinguisher to increase appeal.
- Highlight unique or less common amenities you offer (e.g., hot tub, dedicated workspace, EV charger) in your listing description and photos.
- Regularly check competitor amenities in Nederland to stay competitive.
Nederland Airbnb Guest Demographics & Profile Analysis (2026)
Guest Profile Summary for Nederland
- The typical guest profile for Airbnb in Nederland consists of primarily domestic travelers (95%), often arriving from nearby Denver, typically belonging to the Post-2000s (Gen Z/Alpha) group (50%), primarily speaking English or Spanish.
- Domestic travelers account for 95.3% of guests.
- Key international markets include United States (95.3%) and DC (0.8%).
- Top languages spoken are English (65.1%) followed by Spanish (15.9%).
- A significant demographic segment is the Post-2000s (Gen Z/Alpha) group, representing 50% of guests.
Recommendations for Hosts
- Target domestic marketing efforts towards travelers from Denver and Austin.
- Tailor amenities and listing descriptions to appeal to the dominant Post-2000s (Gen Z/Alpha) demographic (e.g., highlight fast WiFi, smart home features, local guides).
- Highlight unique local experiences or amenities relevant to the primary guest profile.
- Consider seasonal promotions aligned with peak travel times for key origin markets.
Nearby Short-Term Rental Market Comparison
How does the Nederland Airbnb market stack up against its neighbors? Compare key performance metrics like average monthly revenue, ADR, and occupancy rates in surrounding areas to understand the broader regional STR landscape.
| Market | Active Properties | Monthly Revenue | Daily Rate | Avg. Occupancy |
|---|---|---|---|---|
| Blue River | 201 | $7,203 | $609.20 | 45% |
| Aspen | 610 | $7,095 | $992.28 | 36% |
| Snowmass | 21 | $6,247 | $701.59 | 40% |
| Aspen Park | 11 | $5,825 | $395.00 | 54% |
| Indian Hills | 11 | $5,799 | $333.03 | 54% |
| Grand County | 14 | $5,137 | $513.48 | 42% |
| Breckenridge | 3,051 | $4,995 | $544.32 | 40% |
| Crested Butte | 267 | $4,956 | $536.90 | 42% |
| Snowmass Village | 636 | $4,938 | $711.61 | 35% |
| Black Hawk | 133 | $4,884 | $328.37 | 52% |