Mountain Village Airbnb Market Analysis 2026: Short Term Rental Data & Vacation Rental Statistics in Colorado, United States
Is Airbnb profitable in Mountain Village in 2026? Explore comprehensive Airbnb analytics for Mountain Village, Colorado, United States to uncover income potential. This 2026 STR market report for Mountain Village, based on AirROI data from February 2025 to January 2026, reveals key trends in the market of 334 active listings.
Whether you're considering an Airbnb investment in Mountain Village, optimizing your existing vacation rental, or exploring rental arbitrage opportunities, understanding the Mountain Village Airbnb data is crucial. Leveraging the low regulation environment is key to maximizing your short term rental income potential. Let's dive into the specifics.
Key Mountain Village Airbnb Performance Metrics Overview
Monthly Airbnb Revenue Variations & Income Potential in Mountain Village (2026)
Understanding the monthly revenue variations for Airbnb listings in Mountain Village is key to maximizing your short term rental income potential. Seasonality significantly impacts earnings. Our analysis, based on data from the past 12 months, shows that the peak revenue month for STRs in Mountain Village is typically February, while May often presents the lowest earnings, highlighting opportunities for strategic pricing adjustments during shoulder and low seasons. Explore the typical Airbnb income in Mountain Village across different performance tiers:
- Best-in-class properties (Top 10%) achieve $22,751+ monthly, often utilizing dynamic pricing and superior guest experiences.
- Strong performing properties (Top 25%) earn $13,533 or more, indicating effective management and desirable locations/amenities.
- Typical properties (Median) generate around $7,672 per month, representing the average market performance.
- Entry-level properties (Bottom 25%) see earnings around $3,838, often with potential for optimization.
Average Monthly Airbnb Earnings Trend in Mountain Village
Mountain Village Airbnb Occupancy Rate Trends (2026)
Maximize your bookings by understanding the Mountain Village STR occupancy trends. Seasonal demand shifts significantly influence how often properties are booked. Typically, Februarysees the highest demand (peak season occupancy), while December experiences the lowest (low season). Effective strategies, like adjusting minimum stays or offering promotions, can boost occupancy during slower periods. Here's how different property tiers perform in Mountain Village:
- Best-in-class properties (Top 10%) achieve 65%+ occupancy, indicating high desirability and potentially optimized availability.
- Strong performing properties (Top 25%) maintain 49% or higher occupancy, suggesting good market fit and guest satisfaction.
- Typical properties (Median) have an occupancy rate around 29%.
- Entry-level properties (Bottom 25%) average 15% occupancy, potentially facing higher vacancy.
Average Monthly Occupancy Rate Trend in Mountain Village
Average Daily Rate (ADR) Airbnb Trends in Mountain Village (2026)
Effective short term rental pricing strategy in Mountain Village involves understanding monthly ADR fluctuations. The Average Daily Rate (ADR) for Airbnb in Mountain Village typically peaks in January and dips lowest during May. Leveraging Airbnb dynamic pricing tools or strategies based on this seasonality can significantly boost revenue. Here's a look at the typical nightly rates achieved:
- Best-in-class properties (Top 10%) command rates of $2,093+ per night, often due to premium features or locations.
- Strong performing properties (Top 25%) achieve nightly rates of $1,403 or more.
- Typical properties (Median) charge around $927 per night.
- Entry-level properties (Bottom 25%) earn around $592 per night.
Average Daily Rate (ADR) Trend by Month in Mountain Village
Get Live Mountain Village Market Intelligence 👇

Explore Real-time Analytics
Airbnb Seasonality Analysis & Trends in Mountain Village (2026)
Peak Season (February, March, July)
- Revenue averages $17,522 per month
- Occupancy rates average 49.0%
- Daily rates average $1,203
Shoulder Season
- Revenue averages $9,439 per month
- Occupancy maintains around 30.2%
- Daily rates hold near $1,142
Low Season (April, May, November)
- Revenue drops to average $5,706 per month
- Occupancy decreases to average 23.2%
- Daily rates adjust to average $999
Seasonality Insights for Mountain Village
- The Airbnb seasonality in Mountain Village shows highly seasonal trends requiring careful strategy. While the sections above show seasonal averages, it's also insightful to look at the extremes:
- During the high season, the absolute peak month showcases Mountain Village's highest earning potential, with monthly revenues capable of climbing to $20,270, occupancy reaching a high of 53.4%, and ADRs peaking at $1,380.
- Conversely, the slowest single month of the year, typically falling within the low season, marks the market's lowest point. In this month, revenue might dip to $5,572, occupancy could drop to 21.9%, and ADRs may adjust down to $975.
- Understanding both the seasonal averages and these monthly peaks and troughs in revenue, occupancy, and ADR is crucial for maximizing your Airbnb profit potential in Mountain Village.
Seasonal Strategies for Maximizing Profit
- Peak Season: Maximize revenue through premium pricing and potentially longer minimum stays. Ensure high availability.
- Low Season: Offer competitive pricing, special promotions (e.g., extended stay discounts), and flexible cancellation policies. Target off-season travelers like remote workers or budget-conscious guests.
- Shoulder Seasons: Implement dynamic pricing that balances peak and low rates. Target weekend travelers or specific events. Offer slightly more flexible terms than peak season.
- Regularly analyze your own performance against these Mountain Village seasonality benchmarks and adjust your pricing and availability strategy accordingly.
Best Areas for Airbnb Investment in Mountain Village (2026)
Exploring the top neighborhoods for short-term rentals in Mountain Village? This section highlights key areas, outlining why they are attractive for hosts and guests, along with notable local attractions. Consider these locations based on your target guest profile and investment strategy.
| Neighborhood / Area | Why Host Here? (Target Guests & Appeal) | Key Attractions & Landmarks |
|---|---|---|
| Mountain Village Center | The vibrant heart of Mountain Village, offering easy access to restaurants, shops, and the ski lifts. Ideal for travelers looking for convenience and a lively atmosphere. | Telluride Ski Resort, Mountain Village Gondola, Secret Stash Pizza, The Peaks Resort & Spa, Mountain Village Market |
| Ski-In/Ski-Out Lodges | Perfect for ski enthusiasts, these lodges offer direct access to the slopes. Ideal for families and groups wanting to maximize their time on the mountain. | Ski-in/Ski-out access, Tombstone Express Lift, Telluride Ski Resort, Easy access to beginner and expert trails |
| Lawson Hill | A picturesque area with stunning views and a quieter atmosphere. Great for families or those looking for relaxation while still being close to the action. | Scenic overlooks, Hiking trails, Nearby ground transportation to Telluride, Local dining options |
| Country Club Estates | A luxury neighborhood featuring spacious homes with beautiful mountain views. Appeals to high-end travelers and those seeking privacy and comfort. | Golf courses, Spas, Luxury accommodations, Exclusive dining |
| Lower Village | Offers a more local experience with easy access to both the ski area and the town of Telluride. Perfect for those who want to engage with the community. | Local restaurants, Art galleries, Free gondola access, Close proximity to Telluride |
| East Village | A family-friendly area with kid-friendly activities and easy access to the slopes. Best for families looking for convenient skiing and fun activities. | Ski schools, Children’s programs, Access to ski lifts, Kid-friendly dining, Playgrounds |
| North of Village | This area is perfect for those seeking a peaceful getaway while still being close enough to enjoy all that Mountain Village has to offer. Suitable for all types of travelers. | Beautiful nature trails, Photo spots, Scenic views of the mountains, Quiet residential vibe |
| Telluride Town | While not technically Mountain Village, it's just a short gondola ride away and offers a rich history, culture, and plenty of dining and entertainment options. | Telluride Historic District, Festivals, Shops and restaurants, Telluride Brewery, Live music events |
Understanding Airbnb License Requirements & STR Laws in Mountain Village (2026)
While Mountain Village, Colorado, United States currently shows low STR regulations, specific Airbnb license requirements might still exist or change. Always verify the latest short term rental regulations and Airbnb license requirements directly with local government authorities for Mountain Village to ensure full compliance before hosting.
(Source: AirROI data, 2026, based on 0% licensed listings)
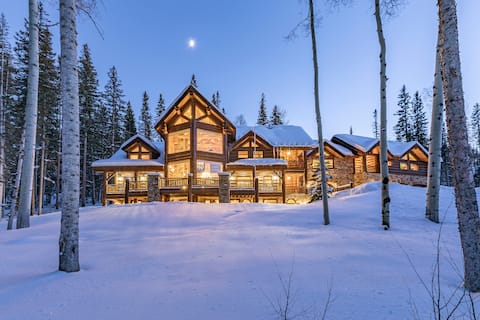
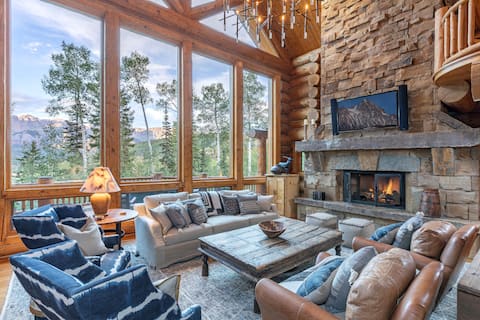
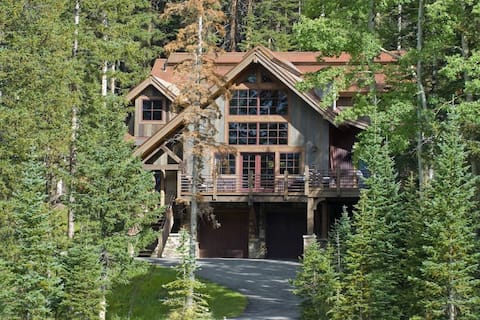
Top Performing Airbnb Properties in Mountain Village (2026)
Benchmark your potential! Explore examples of top-performing Airbnb properties in Mountain Villagebased on Trailing Twelve Month (TTM) revenue. Analyze their characteristics, revenue, occupancy rate, and ADR to understand what drives success in this market.

Picture Perfect
Entire Place • 6 bedrooms
Bearpaw Manor- A Magnificent Ski/Ski-Out Chalet
Entire Place • 6 bedrooms

116 Hang Glider Dr
Entire Place • 5 bedrooms
Ski-in/Out, Hot Tub, Luxury Private Home Sleeps 18
Entire Place • 6 bedrooms

Pickleball, Tennis, Hot Tub, Fireplace, Pool Table
Entire Place • 5 bedrooms
Private Ski in/out Lodge! Hot Tub, 2 King En
Entire Place • 4 bedrooms
Note: Performance varies based on location, size, amenities, seasonality, and management quality. Data reflects the past 12 months.
Top Performing Airbnb Hosts in Mountain Village (2026)
Learn from the best! This table showcases top-performing Airbnb hosts in Mountain Village based on the number of properties managed and estimated total revenue over the past year. Analyze their scale and performance metrics.
| Host Name | Properties | Grossing Revenue | Stay Reviews | Avg Rating |
|---|---|---|---|---|
| Exceptional Stays | 32 | $2,982,477 | 104 | 4.80/5.0 |
| InvitedHome | 29 | $2,803,244 | 80 | 4.86/5.0 |
| SilverStar | 33 | $2,607,888 | 243 | 4.85/5.0 |
| ITrip | 18 | $2,147,944 | 293 | 4.89/5.0 |
| AvantStay Telluride | 22 | $2,042,296 | 405 | 4.78/5.0 |
| Curate Telluride | 14 | $1,978,675 | 53 | 5.00/5.0 |
| Luke | 17 | $1,529,634 | 722 | 4.87/5.0 |
| Exceptional | 8 | $1,288,038 | 25 | 4.92/5.0 |
| Alpine Lodging Telluride | 24 | $1,133,844 | 67 | 4.83/5.0 |
| Lodging In Telluride | 8 | $796,761 | 51 | 4.93/5.0 |
Analyzing the strategies of top hosts, such as their property selection, pricing, and guest communication, can offer valuable lessons for optimizing your own Airbnb operations in Mountain Village.
Dive Deeper: Advanced Mountain Village STR Market Data (2026)
Ready to unlock more insights? AirROI provides access to advanced metrics and comprehensive Airbnb data for Mountain Village. Explore detailed analytics beyond this report to refine your investment strategy, optimize pricing, and maximize your vacation rental profits.
Explore Advanced MetricsMountain Village Short-Term Rental Market Composition (2026): Property & Room Types
Room Type Distribution
Property Type Distribution
Market Composition Insights for Mountain Village
- The Mountain Village Airbnb market composition is heavily skewed towards Entire Home/Apt listings, which make up 99.7% of the 334 active rentals. This indicates strong guest preference for privacy and space.
- Looking at the property type distribution in Mountain Village, Apartment/Condo properties are the most common (54.5%), reflecting the local real estate landscape.
- Houses represent a significant 43.4% portion, catering likely to families or larger groups.
- Smaller segments like outdoor/unique (combined 2.1%) offer potential for unique stay experiences.
Mountain Village Airbnb Room Capacity Analysis (2026): Bedroom Distribution
Distribution of Listings by Number of Bedrooms
Room Capacity Insights for Mountain Village
- The dominant room capacity in Mountain Village is 4 bedrooms listings, making up 26% of the market. This suggests a strong demand for properties suitable for families or small groups.
- Together, 4 bedrooms and 3 bedrooms properties represent 49.7% of the active Airbnb listings in Mountain Village, indicating a high concentration in these sizes.
- A significant 62.0% of listings offer 3+ bedrooms, catering to larger groups and families seeking more space in Mountain Village.
Mountain Village Vacation Rental Guest Capacity Trends (2026)
Distribution of Listings by Guest Capacity
Guest Capacity Insights for Mountain Village
- The most common guest capacity trend in Mountain Village vacation rentals is listings accommodating 8+ guests (52.1%). This suggests the primary traveler segment is likely larger groups.
- Properties designed for 8+ guests and 6 guests dominate the Mountain Village STR market, accounting for 74.3% of listings.
- 78.5% of properties accommodate 6+ guests, serving the market segment for larger families or group travel in Mountain Village.
- On average, properties in Mountain Village are equipped to host 6.6 guests.
Mountain Village Airbnb Booking Patterns (2026): Available vs. Booked Days
Available Days Distribution
Booked Days Distribution
Booking Pattern Insights for Mountain Village
- The most common availability pattern in Mountain Village falls within the 271-366 days range, representing 65.3% of listings. This suggests many properties have significant open periods on their calendars.
- Approximately 94.0% of listings show high availability (181+ days open annually), indicating potential for increased bookings or specific owner usage patterns.
- For booked days, the 31-90 days range is most frequent in Mountain Village (38%), reflecting common guest stay durations or potential owner blocking patterns.
- A notable 6.6% of properties secure long booking periods (181+ days booked per year), highlighting successful long-term rental strategies or significant owner usage.
Mountain Village Airbnb Minimum Stay Requirements Analysis
Distribution of Listings by Minimum Night Requirement
1 Night
1 listings
0.3% of total
2 Nights
24 listings
7.2% of total
3 Nights
44 listings
13.2% of total
4-6 Nights
25 listings
7.5% of total
7-29 Nights
1 listings
0.3% of total
30+ Nights
239 listings
71.6% of total
Key Insights
- The most prevalent minimum stay requirement in Mountain Village is 30+ Nights, adopted by 71.6% of listings. This highlights the market's preference for longer commitments.
- Very short stays (1-2 nights) are less common (7.5%), suggesting hosts prefer slightly longer bookings to optimize turnover.
- A significant segment (71.6%) caters to monthly stays (30+ nights) in Mountain Village, pointing to opportunities in the extended-stay market.
Recommendations
- Align with the market by considering a 30+ Nights minimum stay, as 71.6% of Mountain Village hosts use this setting.
- If feasible, allowing 1-night stays, especially midweek or during low season, could capture last-minute bookings, as only 0.3% currently do.
- Explore offering discounts for stays of 30+ nights to attract the 71.6% of the market seeking extended stays.
- Adjust minimum nights based on seasonality – potentially shorter during low season and longer during peak demand periods in Mountain Village.
Mountain Village Airbnb Cancellation Policy Trends Analysis (2026)
Super Strict 30 Days
80 listings
24% of total
Limited
2 listings
0.6% of total
Super Strict 60 Days
108 listings
32.3% of total
Flexible
1 listings
0.3% of total
Moderate
2 listings
0.6% of total
Firm
119 listings
35.6% of total
Strict
22 listings
6.6% of total
Cancellation Policy Insights for Mountain Village
- The prevailing Airbnb cancellation policy trend in Mountain Village is Firm, used by 35.6% of listings.
- There's a relatively balanced mix between guest-friendly (0.9%) and stricter (42.2%) policies, offering choices for different guest needs.
- Strict cancellation policies are quite rare (6.6%), potentially making listings with this policy less competitive unless justified by high demand or property type.
Recommendations for Hosts
- Consider adopting a Firm policy to align with the 35.6% market standard in Mountain Village.
- Using a Strict policy might deter some guests, as only 6.6% of listings use it. Evaluate if potential revenue protection outweighs possible lower booking rates.
- Regularly review your cancellation policy against competitors and market demand shifts in Mountain Village.
Mountain Village STR Booking Lead Time Analysis (2026)
Average Booking Lead Time by Month
Booking Lead Time Insights for Mountain Village
- The overall average booking lead time for vacation rentals in Mountain Village is 84 days.
- Guests book furthest in advance for stays during March (average 116 days), likely coinciding with peak travel demand or local events.
- The shortest booking windows occur for stays in November (average 39 days), indicating more last-minute travel plans during this time.
- Seasonally, Winter (105 days avg.) sees the longest lead times, while Fall (62 days avg.) has the shortest, reflecting typical travel planning cycles.
Recommendations for Hosts
- Use the overall average lead time (84 days) as a baseline for your pricing and availability strategy in Mountain Village.
- For March stays, consider implementing length-of-stay discounts or slightly higher rates for bookings made less than 116 days out to capitalize on advance planning.
- Target marketing efforts for the Winter season well in advance (at least 105 days) to capture early planners.
- Monitor your own booking lead times against these Mountain Village averages to identify opportunities for dynamic pricing adjustments.
Popular & Essential Airbnb Amenities in Mountain Village (2026)
Amenity Prevalence
Amenity Insights for Mountain Village
- Essential amenities in Mountain Village that guests expect include: Wifi, Heating, TV, Smoke alarm, Carbon monoxide alarm, Washer. Lacking these (any) could significantly impact bookings.
- Popular amenities like Coffee maker, Essentials, Kitchen are common but not universal. Offering these can provide a competitive edge.
Recommendations for Hosts
- Ensure your listing includes all essential amenities for Mountain Village: Wifi, Heating, TV, Smoke alarm, Carbon monoxide alarm, Washer.
- Prioritize adding missing essentials: Wifi, Heating, TV, Smoke alarm, Carbon monoxide alarm, Washer.
- Consider adding popular differentiators like Coffee maker or Essentials to increase appeal.
- Highlight unique or less common amenities you offer (e.g., hot tub, dedicated workspace, EV charger) in your listing description and photos.
- Regularly check competitor amenities in Mountain Village to stay competitive.
Mountain Village Airbnb Guest Demographics & Profile Analysis (2026)
Guest Profile Summary for Mountain Village
- The typical guest profile for Airbnb in Mountain Village consists of primarily domestic travelers (97%), often arriving from nearby Denver, typically belonging to the Post-2000s (Gen Z/Alpha) group (50%), primarily speaking English or Spanish.
- Domestic travelers account for 97.2% of guests.
- Key international markets include United States (97.2%) and Canada (0.6%).
- Top languages spoken are English (74.9%) followed by Spanish (13.4%).
- A significant demographic segment is the Post-2000s (Gen Z/Alpha) group, representing 50% of guests.
Recommendations for Hosts
- Target domestic marketing efforts towards travelers from Denver and New York.
- Tailor amenities and listing descriptions to appeal to the dominant Post-2000s (Gen Z/Alpha) demographic (e.g., highlight fast WiFi, smart home features, local guides).
- Highlight unique local experiences or amenities relevant to the primary guest profile.
- Consider seasonal promotions aligned with peak travel times for key origin markets.
Nearby Short-Term Rental Market Comparison
How does the Mountain Village Airbnb market stack up against its neighbors? Compare key performance metrics like average monthly revenue, ADR, and occupancy rates in surrounding areas to understand the broader regional STR landscape.
| Market | Active Properties | Monthly Revenue | Daily Rate | Avg. Occupancy |
|---|---|---|---|---|
| Telluride | 608 | $5,198 | $662.92 | 38% |
| Crested Butte | 267 | $4,956 | $536.90 | 42% |
| Placerville | 19 | $4,824 | $525.16 | 41% |
| Ouray | 179 | $4,340 | $359.44 | 47% |
| Nathrop | 65 | $3,921 | $381.27 | 38% |
| Crested Butte South | 42 | $3,906 | $438.30 | 43% |
| San Miguel County | 10 | $3,695 | $645.03 | 37% |
| Poncha Springs | 47 | $3,624 | $290.34 | 47% |
| Ridgway | 111 | $3,413 | $322.56 | 47% |
| Mount Crested Butte | 609 | $3,325 | $389.64 | 40% |