Morrison Airbnb Market Analysis 2026: Short Term Rental Data & Vacation Rental Statistics in Colorado, United States
Is Airbnb profitable in Morrison in 2026? Explore comprehensive Airbnb analytics for Morrison, Colorado, United States to uncover income potential. This 2026 STR market report for Morrison, based on AirROI data from February 2025 to January 2026, reveals key trends in the niche market of 57 active listings.
Whether you're considering an Airbnb investment in Morrison, optimizing your existing vacation rental, or exploring rental arbitrage opportunities, understanding the Morrison Airbnb data is crucial. Leveraging the low regulation environment is key to maximizing your short term rental income potential. Let's dive into the specifics.
Key Morrison Airbnb Performance Metrics Overview
Monthly Airbnb Revenue Variations & Income Potential in Morrison (2026)
Understanding the monthly revenue variations for Airbnb listings in Morrison is key to maximizing your short term rental income potential. Seasonality significantly impacts earnings. Our analysis, based on data from the past 12 months, shows that the peak revenue month for STRs in Morrison is typically July, while February often presents the lowest earnings, highlighting opportunities for strategic pricing adjustments during shoulder and low seasons. Explore the typical Airbnb income in Morrison across different performance tiers:
- Best-in-class properties (Top 10%) achieve $9,588+ monthly, often utilizing dynamic pricing and superior guest experiences.
- Strong performing properties (Top 25%) earn $6,787 or more, indicating effective management and desirable locations/amenities.
- Typical properties (Median) generate around $4,238 per month, representing the average market performance.
- Entry-level properties (Bottom 25%) see earnings around $1,775, often with potential for optimization.
Average Monthly Airbnb Earnings Trend in Morrison
Morrison Airbnb Occupancy Rate Trends (2026)
Maximize your bookings by understanding the Morrison STR occupancy trends. Seasonal demand shifts significantly influence how often properties are booked. Typically, Julysees the highest demand (peak season occupancy), while February experiences the lowest (low season). Effective strategies, like adjusting minimum stays or offering promotions, can boost occupancy during slower periods. Here's how different property tiers perform in Morrison:
- Best-in-class properties (Top 10%) achieve 77%+ occupancy, indicating high desirability and potentially optimized availability.
- Strong performing properties (Top 25%) maintain 63% or higher occupancy, suggesting good market fit and guest satisfaction.
- Typical properties (Median) have an occupancy rate around 43%.
- Entry-level properties (Bottom 25%) average 25% occupancy, potentially facing higher vacancy.
Average Monthly Occupancy Rate Trend in Morrison
Average Daily Rate (ADR) Airbnb Trends in Morrison (2026)
Effective short term rental pricing strategy in Morrison involves understanding monthly ADR fluctuations. The Average Daily Rate (ADR) for Airbnb in Morrison typically peaks in June and dips lowest during February. Leveraging Airbnb dynamic pricing tools or strategies based on this seasonality can significantly boost revenue. Here's a look at the typical nightly rates achieved:
- Best-in-class properties (Top 10%) command rates of $582+ per night, often due to premium features or locations.
- Strong performing properties (Top 25%) achieve nightly rates of $418 or more.
- Typical properties (Median) charge around $289 per night.
- Entry-level properties (Bottom 25%) earn around $187 per night.
Average Daily Rate (ADR) Trend by Month in Morrison
Get Live Morrison Market Intelligence 👇

Explore Real-time Analytics
Airbnb Seasonality Analysis & Trends in Morrison (2026)
Peak Season (July, June, August)
- Revenue averages $6,998 per month
- Occupancy rates average 59.4%
- Daily rates average $354
Shoulder Season
- Revenue averages $4,481 per month
- Occupancy maintains around 43.7%
- Daily rates hold near $326
Low Season (January, February, November)
- Revenue drops to average $2,922 per month
- Occupancy decreases to average 31.0%
- Daily rates adjust to average $305
Seasonality Insights for Morrison
- The Airbnb seasonality in Morrison shows highly seasonal trends requiring careful strategy. While the sections above show seasonal averages, it's also insightful to look at the extremes:
- During the high season, the absolute peak month showcases Morrison's highest earning potential, with monthly revenues capable of climbing to $7,671, occupancy reaching a high of 61.4%, and ADRs peaking at $360.
- Conversely, the slowest single month of the year, typically falling within the low season, marks the market's lowest point. In this month, revenue might dip to $2,458, occupancy could drop to 27.3%, and ADRs may adjust down to $267.
- Understanding both the seasonal averages and these monthly peaks and troughs in revenue, occupancy, and ADR is crucial for maximizing your Airbnb profit potential in Morrison.
Seasonal Strategies for Maximizing Profit
- Peak Season: Maximize revenue through premium pricing and potentially longer minimum stays. Ensure high availability.
- Low Season: Offer competitive pricing, special promotions (e.g., extended stay discounts), and flexible cancellation policies. Target off-season travelers like remote workers or budget-conscious guests.
- Shoulder Seasons: Implement dynamic pricing that balances peak and low rates. Target weekend travelers or specific events. Offer slightly more flexible terms than peak season.
- Regularly analyze your own performance against these Morrison seasonality benchmarks and adjust your pricing and availability strategy accordingly.
Best Areas for Airbnb Investment in Morrison (2026)
Exploring the top neighborhoods for short-term rentals in Morrison? This section highlights key areas, outlining why they are attractive for hosts and guests, along with notable local attractions. Consider these locations based on your target guest profile and investment strategy.
| Neighborhood / Area | Why Host Here? (Target Guests & Appeal) | Key Attractions & Landmarks |
|---|---|---|
| Red Rocks | Famous for the iconic Red Rocks Amphitheatre, this area attracts music lovers and outdoor enthusiasts. It's a perfect spot for hosts to reach visitors attending concerts and seeking hiking trails. | Red Rocks Amphitheatre, Red Rocks Park, Mountain biking trails, Relaxed picnic areas, Scenic viewpoints |
| Morrison Town Center | The historic heart of Morrison, offering charming local shops and restaurants. It's ideal for visitors who want to experience local culture and traditions. | Morrison Natural History Museum, Local eateries, Historic buildings, Shops and boutiques, Community events |
| Bear Creek Park | A beautiful natural area with hiking, biking, and picnicking options, great for nature lovers and families. Suitable for hosts targeting tourists looking for outdoor activities. | Bear Creek Lake Park, Fishing and boating, Hiking trails, Picnic areas, Wildlife viewing |
| Lookout Mountain | Located just a short drive from Morrison, this area provides stunning views and is a popular hiking destination, attracting outdoor enthusiasts. | Lookout Mountain Park, Buffalo Bill Museum, Scenic drives, Hiking trails, Panoramic views of Denver |
| Chatfield State Park | Popular with campers and outdoor enthusiasts, this area provides various recreational activities close to Morrison, making it a great fit for hosting. | Lake activities, Trails for hiking and biking, Camping areas, Wildlife viewing, Fishing spots |
| Lynn's Paradise | Residential area with a quaint atmosphere, close to key attractions. This neighborhood attracts families and visitors looking for a relaxing stay in a friendly environment. | Nearby parks, Local coffee shops, Family-friendly restaurants, Quiet atmosphere, Community events |
| Cactus Jack's | A fun and upbeat part of Morrison known for its nightlife and social scene. Attracts younger crowds and those looking to enjoy a lively atmosphere. | Cactus Jack's, Local bars, Live music venues, Restaurants, Fun social events |
| Morrison Events Center | Home to various events and gatherings, attracting visitors all year round. A prime choice for investors looking to host larger groups for events and reunions. | Events and festivals, Community gatherings, Local markets, Concert venues, Food truck events |
Understanding Airbnb License Requirements & STR Laws in Morrison (2026)
While Morrison, Colorado, United States currently shows low STR regulations, specific Airbnb license requirements might still exist or change. Always verify the latest short term rental regulations and Airbnb license requirements directly with local government authorities for Morrison to ensure full compliance before hosting.
(Source: AirROI data, 2026, finding no licensed listings among those analyzed)
Top Performing Airbnb Properties in Morrison (2026)
Benchmark your potential! Explore examples of top-performing Airbnb properties in Morrisonbased on Trailing Twelve Month (TTM) revenue. Analyze their characteristics, revenue, occupancy rate, and ADR to understand what drives success in this market.
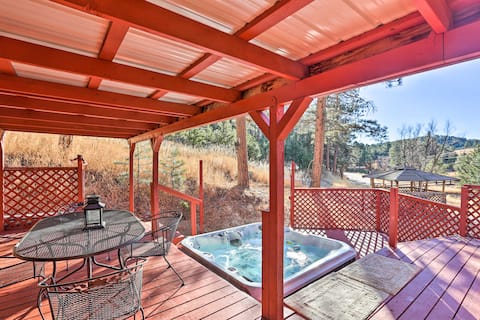
'Wildmanor Ranch' Near Red Rocks w/ Hot Tub!
Entire Place • 3 bedrooms

Colorado Mountain Villa
Entire Place • 5 bedrooms
Mountain Mansion | Hot Tub | Sauna
Entire Place • 6 bedrooms
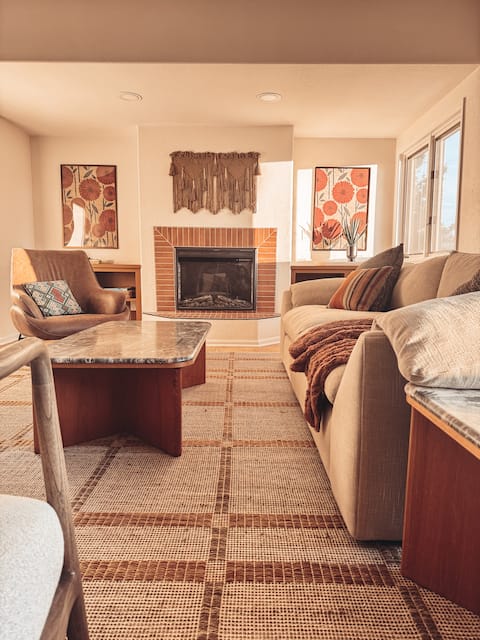
The Good Life Mountain Home - Red Rocks, w/Spa
Entire Place • 3 bedrooms

Red Rocks Retreat ~ Hot Tub, Game Room, Serenity
Entire Place • 4 bedrooms
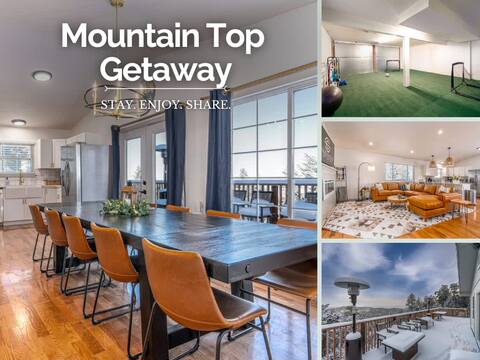
Mountain Top Getaway W/ Hot Tub
Entire Place • 4 bedrooms
Note: Performance varies based on location, size, amenities, seasonality, and management quality. Data reflects the past 12 months.
Top Performing Airbnb Hosts in Morrison (2026)
Learn from the best! This table showcases top-performing Airbnb hosts in Morrison based on the number of properties managed and estimated total revenue over the past year. Analyze their scale and performance metrics.
| Host Name | Properties | Grossing Revenue | Stay Reviews | Avg Rating |
|---|---|---|---|---|
| Host #213015872 | 8 | $315,153 | 831 | 4.85/5.0 |
| Evolve | 2 | $185,706 | 145 | 4.72/5.0 |
| Kyle | 3 | $185,458 | 203 | 4.95/5.0 |
| Joseph | 1 | $120,273 | 24 | 4.71/5.0 |
| Isaiah | 1 | $117,911 | 14 | 4.50/5.0 |
| Aleczandra | 1 | $116,928 | 71 | 5.00/5.0 |
| Ashley | 2 | $113,157 | 213 | 4.80/5.0 |
| Mike And Traci | 1 | $113,093 | 100 | 5.00/5.0 |
| Jason | 1 | $95,779 | 77 | 4.71/5.0 |
| Yvonne | 1 | $81,509 | 209 | 4.99/5.0 |
Analyzing the strategies of top hosts, such as their property selection, pricing, and guest communication, can offer valuable lessons for optimizing your own Airbnb operations in Morrison.
Dive Deeper: Advanced Morrison STR Market Data (2026)
Ready to unlock more insights? AirROI provides access to advanced metrics and comprehensive Airbnb data for Morrison. Explore detailed analytics beyond this report to refine your investment strategy, optimize pricing, and maximize your vacation rental profits.
Explore Advanced MetricsMorrison Short-Term Rental Market Composition (2026): Property & Room Types
Room Type Distribution
Property Type Distribution
Market Composition Insights for Morrison
- The Morrison Airbnb market composition is heavily skewed towards Entire Home/Apt listings, which make up 75.4% of the 57 active rentals. This indicates strong guest preference for privacy and space.
- Looking at the property type distribution in Morrison, House properties are the most common (54.4%), reflecting the local real estate landscape.
- Houses represent a significant 54.4% portion, catering likely to families or larger groups.
- The presence of 19.3% Hotel/Boutique listings indicates integration with traditional hospitality.
- Smaller segments like others (combined 3.5%) offer potential for unique stay experiences.
Morrison Airbnb Room Capacity Analysis (2026): Bedroom Distribution
Distribution of Listings by Number of Bedrooms
Room Capacity Insights for Morrison
- The dominant room capacity in Morrison is 1 bedroom listings, making up 40.4% of the market. This suggests a strong demand for properties suitable for couples or solo travelers.
- Together, 1 bedroom and 3 bedrooms properties represent 65.0% of the active Airbnb listings in Morrison, indicating a high concentration in these sizes.
- A significant 42.1% of listings offer 3+ bedrooms, catering to larger groups and families seeking more space in Morrison.
Morrison Vacation Rental Guest Capacity Trends (2026)
Distribution of Listings by Guest Capacity
Guest Capacity Insights for Morrison
- The most common guest capacity trend in Morrison vacation rentals is listings accommodating 2 guests (26.3%). This suggests the primary traveler segment is likely couples or solo travelers.
- Properties designed for 2 guests and 6 guests dominate the Morrison STR market, accounting for 49.1% of listings.
- 40.4% of properties accommodate 6+ guests, serving the market segment for larger families or group travel in Morrison.
- On average, properties in Morrison are equipped to host 4.3 guests.
Morrison Airbnb Booking Patterns (2026): Available vs. Booked Days
Available Days Distribution
Booked Days Distribution
Booking Pattern Insights for Morrison
- The most common availability pattern in Morrison falls within the 181-270 days range, representing 47.4% of listings. This suggests many properties have significant open periods on their calendars.
- Approximately 79.0% of listings show high availability (181+ days open annually), indicating potential for increased bookings or specific owner usage patterns.
- For booked days, the 91-180 days range is most frequent in Morrison (42.1%), reflecting common guest stay durations or potential owner blocking patterns.
- A notable 26.4% of properties secure long booking periods (181+ days booked per year), highlighting successful long-term rental strategies or significant owner usage.
Morrison Airbnb Minimum Stay Requirements Analysis
Distribution of Listings by Minimum Night Requirement
1 Night
23 listings
40.4% of total
2 Nights
11 listings
19.3% of total
3 Nights
4 listings
7% of total
4-6 Nights
1 listings
1.8% of total
7-29 Nights
5 listings
8.8% of total
30+ Nights
13 listings
22.8% of total
Key Insights
- The most prevalent minimum stay requirement in Morrison is 1 Night, adopted by 40.4% of listings. This highlights the market's preference for shorter, flexible bookings.
- A significant segment (22.8%) caters to monthly stays (30+ nights) in Morrison, pointing to opportunities in the extended-stay market.
Recommendations
- Align with the market by considering a 1 Night minimum stay, as 40.4% of Morrison hosts use this setting.
- Explore offering discounts for stays of 30+ nights to attract the 22.8% of the market seeking extended stays.
- Adjust minimum nights based on seasonality – potentially shorter during low season and longer during peak demand periods in Morrison.
Morrison Airbnb Cancellation Policy Trends Analysis (2026)
Flexible
12 listings
21.1% of total
Moderate
21 listings
36.8% of total
Firm
15 listings
26.3% of total
Strict
9 listings
15.8% of total
Cancellation Policy Insights for Morrison
- The prevailing Airbnb cancellation policy trend in Morrison is Moderate, used by 36.8% of listings.
- There's a relatively balanced mix between guest-friendly (57.9%) and stricter (42.1%) policies, offering choices for different guest needs.
Recommendations for Hosts
- Consider adopting a Moderate policy to align with the 36.8% market standard in Morrison.
- Regularly review your cancellation policy against competitors and market demand shifts in Morrison.
Morrison STR Booking Lead Time Analysis (2026)
Average Booking Lead Time by Month
Booking Lead Time Insights for Morrison
- The overall average booking lead time for vacation rentals in Morrison is 63 days.
- Guests book furthest in advance for stays during October (average 89 days), likely coinciding with peak travel demand or local events.
- The shortest booking windows occur for stays in February (average 23 days), indicating more last-minute travel plans during this time.
- Seasonally, Fall (78 days avg.) sees the longest lead times, while Winter (39 days avg.) has the shortest, reflecting typical travel planning cycles.
Recommendations for Hosts
- Use the overall average lead time (63 days) as a baseline for your pricing and availability strategy in Morrison.
- For October stays, consider implementing length-of-stay discounts or slightly higher rates for bookings made less than 89 days out to capitalize on advance planning.
- Target marketing efforts for the Fall season well in advance (at least 78 days) to capture early planners.
- Monitor your own booking lead times against these Morrison averages to identify opportunities for dynamic pricing adjustments.
Popular & Essential Airbnb Amenities in Morrison (2026)
Amenity Prevalence
Amenity Insights for Morrison
- Essential amenities in Morrison that guests expect include: Wifi, Heating, Free parking on premises. Lacking these (any) could significantly impact bookings.
- Popular amenities like TV, Carbon monoxide alarm, Smoke alarm are common but not universal. Offering these can provide a competitive edge.
Recommendations for Hosts
- Ensure your listing includes all essential amenities for Morrison: Wifi, Heating, Free parking on premises.
- Prioritize adding missing essentials: Heating, Free parking on premises.
- Consider adding popular differentiators like TV or Carbon monoxide alarm to increase appeal.
- Highlight unique or less common amenities you offer (e.g., hot tub, dedicated workspace, EV charger) in your listing description and photos.
- Regularly check competitor amenities in Morrison to stay competitive.
Morrison Airbnb Guest Demographics & Profile Analysis (2026)
Guest Profile Summary for Morrison
- The typical guest profile for Airbnb in Morrison consists of primarily domestic travelers (98%), often arriving from nearby Denver, typically belonging to the Post-2000s (Gen Z/Alpha) group (50%), primarily speaking English or Spanish.
- Domestic travelers account for 97.8% of guests.
- Key international markets include United States (97.8%) and Canada (0.7%).
- Top languages spoken are English (77%) followed by Spanish (10.6%).
- A significant demographic segment is the Post-2000s (Gen Z/Alpha) group, representing 50% of guests.
Recommendations for Hosts
- Target domestic marketing efforts towards travelers from Denver and Austin.
- Tailor amenities and listing descriptions to appeal to the dominant Post-2000s (Gen Z/Alpha) demographic (e.g., highlight fast WiFi, smart home features, local guides).
- Highlight unique local experiences or amenities relevant to the primary guest profile.
- Consider seasonal promotions aligned with peak travel times for key origin markets.
Nearby Short-Term Rental Market Comparison
How does the Morrison Airbnb market stack up against its neighbors? Compare key performance metrics like average monthly revenue, ADR, and occupancy rates in surrounding areas to understand the broader regional STR landscape.
| Market | Active Properties | Monthly Revenue | Daily Rate | Avg. Occupancy |
|---|---|---|---|---|
| Blue River | 201 | $7,203 | $609.20 | 45% |
| Aspen | 610 | $7,095 | $992.28 | 36% |
| Snowmass | 21 | $6,247 | $701.59 | 40% |
| Aspen Park | 11 | $5,825 | $395.00 | 54% |
| Indian Hills | 11 | $5,799 | $333.03 | 54% |
| Grand County | 14 | $5,137 | $513.48 | 42% |
| Breckenridge | 3,051 | $4,995 | $544.32 | 40% |
| Crested Butte | 267 | $4,956 | $536.90 | 42% |
| Snowmass Village | 636 | $4,938 | $711.61 | 35% |
| Black Hawk | 133 | $4,884 | $328.37 | 52% |