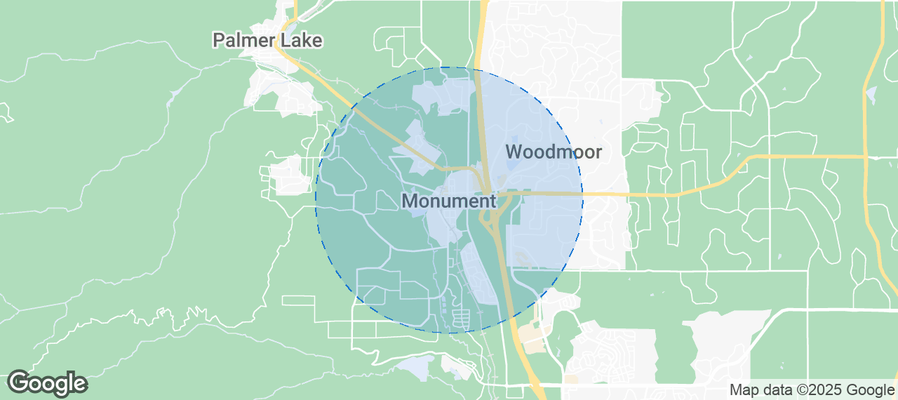
Monument Airbnb Market Analysis 2026: Short Term Rental Data & Vacation Rental Statistics in Colorado, United States
Is Airbnb profitable in Monument in 2026? Explore comprehensive Airbnb analytics for Monument, Colorado, United States to uncover income potential. This 2026 STR market report for Monument, based on AirROI data from February 2025 to January 2026, reveals key trends in the niche market of 96 active listings.
Whether you're considering an Airbnb investment in Monument, optimizing your existing vacation rental, or exploring rental arbitrage opportunities, understanding the Monument Airbnb data is crucial. Leveraging the low regulation environment is key to maximizing your short term rental income potential. Let's dive into the specifics.
Key Monument Airbnb Performance Metrics Overview
Monthly Airbnb Revenue Variations & Income Potential in Monument (2026)
Understanding the monthly revenue variations for Airbnb listings in Monument is key to maximizing your short term rental income potential. Seasonality significantly impacts earnings. Our analysis, based on data from the past 12 months, shows that the peak revenue month for STRs in Monument is typically July, while February often presents the lowest earnings, highlighting opportunities for strategic pricing adjustments during shoulder and low seasons. Explore the typical Airbnb income in Monument across different performance tiers:
- Best-in-class properties (Top 10%) achieve $9,121+ monthly, often utilizing dynamic pricing and superior guest experiences.
- Strong performing properties (Top 25%) earn $5,872 or more, indicating effective management and desirable locations/amenities.
- Typical properties (Median) generate around $3,190 per month, representing the average market performance.
- Entry-level properties (Bottom 25%) see earnings around $1,684, often with potential for optimization.
Average Monthly Airbnb Earnings Trend in Monument
Monument Airbnb Occupancy Rate Trends (2026)
Maximize your bookings by understanding the Monument STR occupancy trends. Seasonal demand shifts significantly influence how often properties are booked. Typically, Julysees the highest demand (peak season occupancy), while January experiences the lowest (low season). Effective strategies, like adjusting minimum stays or offering promotions, can boost occupancy during slower periods. Here's how different property tiers perform in Monument:
- Best-in-class properties (Top 10%) achieve 80%+ occupancy, indicating high desirability and potentially optimized availability.
- Strong performing properties (Top 25%) maintain 60% or higher occupancy, suggesting good market fit and guest satisfaction.
- Typical properties (Median) have an occupancy rate around 40%.
- Entry-level properties (Bottom 25%) average 23% occupancy, potentially facing higher vacancy.
Average Monthly Occupancy Rate Trend in Monument
Average Daily Rate (ADR) Airbnb Trends in Monument (2026)
Effective short term rental pricing strategy in Monument involves understanding monthly ADR fluctuations. The Average Daily Rate (ADR) for Airbnb in Monument typically peaks in December and dips lowest during February. Leveraging Airbnb dynamic pricing tools or strategies based on this seasonality can significantly boost revenue. Here's a look at the typical nightly rates achieved:
- Best-in-class properties (Top 10%) command rates of $591+ per night, often due to premium features or locations.
- Strong performing properties (Top 25%) achieve nightly rates of $447 or more.
- Typical properties (Median) charge around $266 per night.
- Entry-level properties (Bottom 25%) earn around $160 per night.
Average Daily Rate (ADR) Trend by Month in Monument
Get Live Monument Market Intelligence 👇
Explore Real-time Analytics
Airbnb Seasonality Analysis & Trends in Monument (2026)
Peak Season (July, June, August)
- Revenue averages $6,521 per month
- Occupancy rates average 57.1%
- Daily rates average $343
Shoulder Season
- Revenue averages $4,205 per month
- Occupancy maintains around 40.2%
- Daily rates hold near $344
Low Season (January, February, April)
- Revenue drops to average $2,754 per month
- Occupancy decreases to average 34.4%
- Daily rates adjust to average $298
Seasonality Insights for Monument
- The Airbnb seasonality in Monument shows highly seasonal trends requiring careful strategy. While the sections above show seasonal averages, it's also insightful to look at the extremes:
- During the high season, the absolute peak month showcases Monument's highest earning potential, with monthly revenues capable of climbing to $7,857, occupancy reaching a high of 65.4%, and ADRs peaking at $389.
- Conversely, the slowest single month of the year, typically falling within the low season, marks the market's lowest point. In this month, revenue might dip to $2,563, occupancy could drop to 28.8%, and ADRs may adjust down to $272.
- Understanding both the seasonal averages and these monthly peaks and troughs in revenue, occupancy, and ADR is crucial for maximizing your Airbnb profit potential in Monument.
Seasonal Strategies for Maximizing Profit
- Peak Season: Maximize revenue through premium pricing and potentially longer minimum stays. Ensure high availability.
- Low Season: Offer competitive pricing, special promotions (e.g., extended stay discounts), and flexible cancellation policies. Target off-season travelers like remote workers or budget-conscious guests.
- Shoulder Seasons: Implement dynamic pricing that balances peak and low rates. Target weekend travelers or specific events. Offer slightly more flexible terms than peak season.
- Regularly analyze your own performance against these Monument seasonality benchmarks and adjust your pricing and availability strategy accordingly.
Best Areas for Airbnb Investment in Monument (2026)
Exploring the top neighborhoods for short-term rentals in Monument? This section highlights key areas, outlining why they are attractive for hosts and guests, along with notable local attractions. Consider these locations based on your target guest profile and investment strategy.
| Neighborhood / Area | Why Host Here? (Target Guests & Appeal) | Key Attractions & Landmarks |
|---|---|---|
| Downtown Monument | This is the heart of Monument, close to shops, restaurants, and community events. Hosts can attract visitors looking for convenience and access to local amenities. | Monument Marketplace, local cafes, community parks, Monument Lake, trails around Palmer Lake |
| Woodmoor | A suburban area known for its peaceful surroundings and scenic views of the mountains. Often sought after by families and those wanting a quiet retreat close to nature. | Woodmoor Park, biking and hiking trails, scenic views, family-friendly parks, local wildlife |
| Rolling Hills Ranch | A desirable neighborhood that provides easy access to both Monument and Colorado Springs. Great for travelers looking for a blend of rural and suburban charm. | local hiking trails, community amenities, views of Pikes Peak, golf courses, outdoor activities |
| Palmer Lake | A beautiful small town right next to Monument, offering a charming lake and nature trails, appealing to those looking for outdoor activities and scenic spots. | Palmer Lake Reservoir, trails around the lake, local shops, restaurants, bed and breakfasts |
| Woodland Park | A short drive from Monument, known for its higher altitude and beautiful mountain scenery, perfect for those seeking adventure and outdoor experiences. | Pikes Peak, Garden of the Gods, horseback riding, mountain biking, local farmers market |
| Castle Rock | Nearby town with shopping and cultural attractions. A growing area that attracts both tourists and business travelers due to its amenities and proximity to the Denver metro area. | Castle Rock Outlet Stores, historic downtown, local dining, Rock Park, Catherine's Store |
| Colorado Springs (North End) | The northern part of Colorado Springs is close to Monument and is popular with visitors for its attractions. Great for those venturing into the city or visiting the nearby mountains. | Garden of the Gods, Pikes Peak, Cave of the Winds, Cheyenne Mountain Zoo, Red Rock Canyon Open Space |
| Air Force Academy | This area draws visitors attending events and visiting the Academy. Excellent for hosting military families and visitors during official events. | Air Force Academy Visitor Center, Cadet Chapel, Falcon Stadium, the Cadet Area, local hiking trails |
Understanding Airbnb License Requirements & STR Laws in Monument (2026)
While Monument, Colorado, United States currently shows low STR regulations, specific Airbnb license requirements might still exist or change. Always verify the latest short term rental regulations and Airbnb license requirements directly with local government authorities for Monument to ensure full compliance before hosting.
(Source: AirROI data, 2026, finding no licensed listings among those analyzed)
Top Performing Airbnb Properties in Monument (2026)
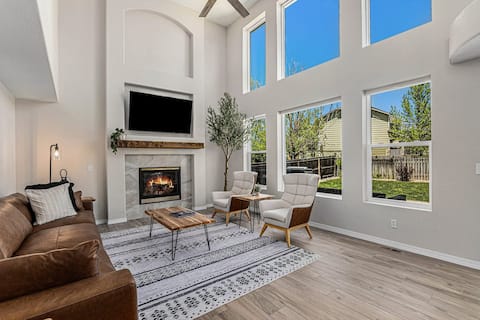
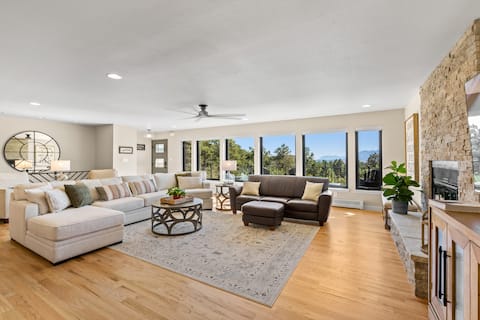
Benchmark your potential! Explore examples of top-performing Airbnb properties in Monumentbased on Trailing Twelve Month (TTM) revenue. Analyze their characteristics, revenue, occupancy rate, and ADR to understand what drives success in this market.
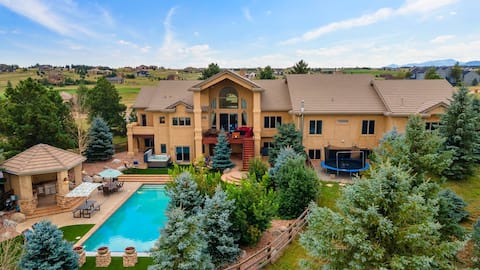
Gorgeous, Views, POOL/Hot Tub, Gym, near USAFA
Entire Place • 6 bedrooms

Amazing SWIM SPA, 5b/4b, FUN! 5 acres, HOT TUB!
Entire Place • 5 bedrooms

Room to Spread Out & Deck with Mountain Views
Entire Place • 4 bedrooms

Luxurious 5200 sf with Sauna & Gym near USAFA
Entire Place • 4 bedrooms
Gorgeous huge perfect home with hot tub!
Entire Place • 6 bedrooms
Sanctuary View- Trees & Spectacular Mountain Views
Entire Place • 3 bedrooms
Note: Performance varies based on location, size, amenities, seasonality, and management quality. Data reflects the past 12 months.
Top Performing Airbnb Hosts in Monument (2026)
Learn from the best! This table showcases top-performing Airbnb hosts in Monument based on the number of properties managed and estimated total revenue over the past year. Analyze their scale and performance metrics.
| Host Name | Properties | Grossing Revenue | Stay Reviews | Avg Rating |
|---|---|---|---|---|
| Shelly | 2 | $233,424 | 223 | 4.95/5.0 |
| Diego | 1 | $225,392 | 34 | 5.00/5.0 |
| Philip | 2 | $194,535 | 86 | 4.95/5.0 |
| Kaitlyn At Renjoy | 4 | $187,989 | 44 | 4.51/5.0 |
| Chris & Wendy | 8 | $165,494 | 1026 | 4.92/5.0 |
| Felix | 3 | $165,028 | 229 | 4.96/5.0 |
| Julia | 2 | $153,995 | 171 | 4.98/5.0 |
| Rose | 1 | $105,183 | 18 | 4.89/5.0 |
| Scott | 2 | $104,733 | 9 | 5.00/5.0 |
| Kayla | 1 | $104,417 | 82 | 4.90/5.0 |
Analyzing the strategies of top hosts, such as their property selection, pricing, and guest communication, can offer valuable lessons for optimizing your own Airbnb operations in Monument.
Dive Deeper: Advanced Monument STR Market Data (2026)
Ready to unlock more insights? AirROI provides access to advanced metrics and comprehensive Airbnb data for Monument. Explore detailed analytics beyond this report to refine your investment strategy, optimize pricing, and maximize your vacation rental profits.
Explore Advanced MetricsMonument Short-Term Rental Market Composition (2026): Property & Room Types
Room Type Distribution
Property Type Distribution
Market Composition Insights for Monument
- The Monument Airbnb market composition is heavily skewed towards Entire Home/Apt listings, which make up 88.5% of the 96 active rentals. This indicates strong guest preference for privacy and space.
- Looking at the property type distribution in Monument, House properties are the most common (76%), reflecting the local real estate landscape.
- Houses represent a significant 76% portion, catering likely to families or larger groups.
- The presence of 5.2% Hotel/Boutique listings indicates integration with traditional hospitality.
- Smaller segments like apartment/condo, unique stays (combined 5.2%) offer potential for unique stay experiences.
Monument Airbnb Room Capacity Analysis (2026): Bedroom Distribution
Distribution of Listings by Number of Bedrooms
Room Capacity Insights for Monument
- The dominant room capacity in Monument is 5+ bedrooms listings, making up 29.2% of the market. This suggests a strong demand for properties suitable for families or small groups.
- Together, 5+ bedrooms and 2 bedrooms properties represent 49.0% of the active Airbnb listings in Monument, indicating a high concentration in these sizes.
- A significant 55.3% of listings offer 3+ bedrooms, catering to larger groups and families seeking more space in Monument.
Monument Vacation Rental Guest Capacity Trends (2026)
Distribution of Listings by Guest Capacity
Guest Capacity Insights for Monument
- The most common guest capacity trend in Monument vacation rentals is listings accommodating 8+ guests (46.9%). This suggests the primary traveler segment is likely larger groups.
- Properties designed for 8+ guests and 6 guests dominate the Monument STR market, accounting for 65.7% of listings.
- 68.8% of properties accommodate 6+ guests, serving the market segment for larger families or group travel in Monument.
- On average, properties in Monument are equipped to host 5.8 guests.
Monument Airbnb Booking Patterns (2026): Available vs. Booked Days
Available Days Distribution
Booked Days Distribution
Booking Pattern Insights for Monument
- The most common availability pattern in Monument falls within the 271-366 days range, representing 42.7% of listings. This suggests many properties have significant open periods on their calendars.
- Approximately 79.2% of listings show high availability (181+ days open annually), indicating potential for increased bookings or specific owner usage patterns.
- For booked days, the 91-180 days range is most frequent in Monument (39.6%), reflecting common guest stay durations or potential owner blocking patterns.
- A notable 21.9% of properties secure long booking periods (181+ days booked per year), highlighting successful long-term rental strategies or significant owner usage.
Monument Airbnb Minimum Stay Requirements Analysis
Distribution of Listings by Minimum Night Requirement
1 Night
21 listings
21.9% of total
2 Nights
19 listings
19.8% of total
3 Nights
7 listings
7.3% of total
4-6 Nights
6 listings
6.3% of total
7-29 Nights
2 listings
2.1% of total
30+ Nights
41 listings
42.7% of total
Key Insights
- The most prevalent minimum stay requirement in Monument is 30+ Nights, adopted by 42.7% of listings. This highlights the market's preference for longer commitments.
- A significant segment (42.7%) caters to monthly stays (30+ nights) in Monument, pointing to opportunities in the extended-stay market.
Recommendations
- Align with the market by considering a 30+ Nights minimum stay, as 42.7% of Monument hosts use this setting.
- If feasible, allowing 1-night stays, especially midweek or during low season, could capture last-minute bookings, as only 21.9% currently do.
- Explore offering discounts for stays of 30+ nights to attract the 42.7% of the market seeking extended stays.
- Adjust minimum nights based on seasonality – potentially shorter during low season and longer during peak demand periods in Monument.
Monument Airbnb Cancellation Policy Trends Analysis (2026)
Limited
3 listings
3.1% of total
Super Strict 60 Days
1 listings
1% of total
Flexible
23 listings
24% of total
Moderate
18 listings
18.8% of total
Firm
38 listings
39.6% of total
Strict
13 listings
13.5% of total
Cancellation Policy Insights for Monument
- The prevailing Airbnb cancellation policy trend in Monument is Firm, used by 39.6% of listings.
- A majority (53.1%) of hosts in Monument utilize Firm or Strict policies, indicating a market where hosts prioritize booking security.
Recommendations for Hosts
- Consider adopting a Firm policy to align with the 39.6% market standard in Monument.
- Using a Strict policy might deter some guests, as only 13.5% of listings use it. Evaluate if potential revenue protection outweighs possible lower booking rates.
- Regularly review your cancellation policy against competitors and market demand shifts in Monument.
Monument STR Booking Lead Time Analysis (2026)
Average Booking Lead Time by Month
Booking Lead Time Insights for Monument
- The overall average booking lead time for vacation rentals in Monument is 56 days.
- Guests book furthest in advance for stays during May (average 92 days), likely coinciding with peak travel demand or local events.
- The shortest booking windows occur for stays in February (average 24 days), indicating more last-minute travel plans during this time.
- Seasonally, Summer (66 days avg.) sees the longest lead times, while Winter (33 days avg.) has the shortest, reflecting typical travel planning cycles.
Recommendations for Hosts
- Use the overall average lead time (56 days) as a baseline for your pricing and availability strategy in Monument.
- For May stays, consider implementing length-of-stay discounts or slightly higher rates for bookings made less than 92 days out to capitalize on advance planning.
- Target marketing efforts for the Summer season well in advance (at least 66 days) to capture early planners.
- Monitor your own booking lead times against these Monument averages to identify opportunities for dynamic pricing adjustments.
Popular & Essential Airbnb Amenities in Monument (2026)
Amenity Prevalence
Amenity Insights for Monument
- Essential amenities in Monument that guests expect include: Smoke alarm, Carbon monoxide alarm, Heating, Free parking on premises. Lacking these (any) could significantly impact bookings.
- Popular amenities like Bed linens, Wifi, Hot water are common but not universal. Offering these can provide a competitive edge.
- Warning: Wifi is not universally provided but is considered essential globally. Ensure reliable Wifi is offered.
Recommendations for Hosts
- Ensure your listing includes all essential amenities for Monument: Smoke alarm, Carbon monoxide alarm, Heating, Free parking on premises.
- Prioritize adding missing essentials: Smoke alarm, Carbon monoxide alarm, Heating, Free parking on premises.
- Consider adding popular differentiators like Bed linens or Wifi to increase appeal.
- Highlight unique or less common amenities you offer (e.g., hot tub, dedicated workspace, EV charger) in your listing description and photos.
- Regularly check competitor amenities in Monument to stay competitive.
Monument Airbnb Guest Demographics & Profile Analysis (2026)
Guest Profile Summary for Monument
- The typical guest profile for Airbnb in Monument consists of primarily domestic travelers (97%), often arriving from nearby Denver, typically belonging to the Post-2000s (Gen Z/Alpha) group (50%), primarily speaking English or Spanish.
- Domestic travelers account for 97.2% of guests.
- Key international markets include United States (97.2%) and United Kingdom (0.5%).
- Top languages spoken are English (77%) followed by Spanish (14.1%).
- A significant demographic segment is the Post-2000s (Gen Z/Alpha) group, representing 50% of guests.
Recommendations for Hosts
- Target domestic marketing efforts towards travelers from Denver and Colorado Springs.
- Tailor amenities and listing descriptions to appeal to the dominant Post-2000s (Gen Z/Alpha) demographic (e.g., highlight fast WiFi, smart home features, local guides).
- Highlight unique local experiences or amenities relevant to the primary guest profile.
- Consider seasonal promotions aligned with peak travel times for key origin markets.
Nearby Short-Term Rental Market Comparison
How does the Monument Airbnb market stack up against its neighbors? Compare key performance metrics like average monthly revenue, ADR, and occupancy rates in surrounding areas to understand the broader regional STR landscape.
| Market | Active Properties | Monthly Revenue | Daily Rate | Avg. Occupancy |
|---|---|---|---|---|
| Aspen Park | 11 | $5,825 | $395.00 | 54% |
| Indian Hills | 11 | $5,799 | $333.03 | 54% |
| Grand County | 14 | $5,137 | $513.48 | 42% |
| Black Hawk | 133 | $4,884 | $328.37 | 52% |
| Central City | 10 | $4,789 | $318.09 | 52% |
| Bailey | 126 | $4,611 | $310.32 | 53% |
| Cascade-Chipita Park | 103 | $4,541 | $330.50 | 52% |
| Estes Park | 1,311 | $4,504 | $383.02 | 45% |
| Woodmoor | 43 | $4,444 | $335.63 | 46% |
| Applewood | 18 | $4,400 | $269.95 | 56% |