Manitou Springs Airbnb Market Analysis 2026: Short Term Rental Data & Vacation Rental Statistics in Colorado, United States
Is Airbnb profitable in Manitou Springs in 2026? Explore comprehensive Airbnb analytics for Manitou Springs, Colorado, United States to uncover income potential. This 2026 STR market report for Manitou Springs, based on AirROI data from February 2025 to January 2026, reveals key trends in the niche market of 107 active listings.
Whether you're considering an Airbnb investment in Manitou Springs, optimizing your existing vacation rental, or exploring rental arbitrage opportunities, understanding the Manitou Springs Airbnb data is crucial. Leveraging the low regulation environment is key to maximizing your short term rental income potential. Let's dive into the specifics.
Key Manitou Springs Airbnb Performance Metrics Overview
Monthly Airbnb Revenue Variations & Income Potential in Manitou Springs (2026)
Understanding the monthly revenue variations for Airbnb listings in Manitou Springs is key to maximizing your short term rental income potential. Seasonality significantly impacts earnings. Our analysis, based on data from the past 12 months, shows that the peak revenue month for STRs in Manitou Springs is typically July, while February often presents the lowest earnings, highlighting opportunities for strategic pricing adjustments during shoulder and low seasons. Explore the typical Airbnb income in Manitou Springs across different performance tiers:
- Best-in-class properties (Top 10%) achieve $7,826+ monthly, often utilizing dynamic pricing and superior guest experiences.
- Strong performing properties (Top 25%) earn $4,598 or more, indicating effective management and desirable locations/amenities.
- Typical properties (Median) generate around $2,961 per month, representing the average market performance.
- Entry-level properties (Bottom 25%) see earnings around $1,583, often with potential for optimization.
Average Monthly Airbnb Earnings Trend in Manitou Springs
Manitou Springs Airbnb Occupancy Rate Trends (2026)
Maximize your bookings by understanding the Manitou Springs STR occupancy trends. Seasonal demand shifts significantly influence how often properties are booked. Typically, Julysees the highest demand (peak season occupancy), while January experiences the lowest (low season). Effective strategies, like adjusting minimum stays or offering promotions, can boost occupancy during slower periods. Here's how different property tiers perform in Manitou Springs:
- Best-in-class properties (Top 10%) achieve 78%+ occupancy, indicating high desirability and potentially optimized availability.
- Strong performing properties (Top 25%) maintain 65% or higher occupancy, suggesting good market fit and guest satisfaction.
- Typical properties (Median) have an occupancy rate around 47%.
- Entry-level properties (Bottom 25%) average 26% occupancy, potentially facing higher vacancy.
Average Monthly Occupancy Rate Trend in Manitou Springs
Average Daily Rate (ADR) Airbnb Trends in Manitou Springs (2026)
Effective short term rental pricing strategy in Manitou Springs involves understanding monthly ADR fluctuations. The Average Daily Rate (ADR) for Airbnb in Manitou Springs typically peaks in June and dips lowest during February. Leveraging Airbnb dynamic pricing tools or strategies based on this seasonality can significantly boost revenue. Here's a look at the typical nightly rates achieved:
- Best-in-class properties (Top 10%) command rates of $419+ per night, often due to premium features or locations.
- Strong performing properties (Top 25%) achieve nightly rates of $266 or more.
- Typical properties (Median) charge around $187 per night.
- Entry-level properties (Bottom 25%) earn around $131 per night.
Average Daily Rate (ADR) Trend by Month in Manitou Springs
Get Live Manitou Springs Market Intelligence 👇

Explore Real-time Analytics
Airbnb Seasonality Analysis & Trends in Manitou Springs (2026)
Peak Season (July, June, August)
- Revenue averages $5,970 per month
- Occupancy rates average 61.5%
- Daily rates average $281
Shoulder Season
- Revenue averages $3,796 per month
- Occupancy maintains around 45.3%
- Daily rates hold near $248
Low Season (January, February, March)
- Revenue drops to average $2,210 per month
- Occupancy decreases to average 33.9%
- Daily rates adjust to average $225
Seasonality Insights for Manitou Springs
- The Airbnb seasonality in Manitou Springs shows highly seasonal trends requiring careful strategy. While the sections above show seasonal averages, it's also insightful to look at the extremes:
- During the high season, the absolute peak month showcases Manitou Springs's highest earning potential, with monthly revenues capable of climbing to $6,403, occupancy reaching a high of 62.4%, and ADRs peaking at $288.
- Conversely, the slowest single month of the year, typically falling within the low season, marks the market's lowest point. In this month, revenue might dip to $1,889, occupancy could drop to 26.0%, and ADRs may adjust down to $218.
- Understanding both the seasonal averages and these monthly peaks and troughs in revenue, occupancy, and ADR is crucial for maximizing your Airbnb profit potential in Manitou Springs.
Seasonal Strategies for Maximizing Profit
- Peak Season: Maximize revenue through premium pricing and potentially longer minimum stays. Ensure high availability.
- Low Season: Offer competitive pricing, special promotions (e.g., extended stay discounts), and flexible cancellation policies. Target off-season travelers like remote workers or budget-conscious guests.
- Shoulder Seasons: Implement dynamic pricing that balances peak and low rates. Target weekend travelers or specific events. Offer slightly more flexible terms than peak season.
- Regularly analyze your own performance against these Manitou Springs seasonality benchmarks and adjust your pricing and availability strategy accordingly.
Best Areas for Airbnb Investment in Manitou Springs (2026)
Exploring the top neighborhoods for short-term rentals in Manitou Springs? This section highlights key areas, outlining why they are attractive for hosts and guests, along with notable local attractions. Consider these locations based on your target guest profile and investment strategy.
| Neighborhood / Area | Why Host Here? (Target Guests & Appeal) | Key Attractions & Landmarks |
|---|---|---|
| Manitou Springs Historic District | A charming area with historic buildings, artistic shops, and a unique vibe. Great for tourists who want to experience the local culture and history while being close to outdoor activities. | Manitou Springs Penny Arcade, Manitou Springs Memorial Park, Crystal Park Cantina, Red Rock Canyon Open Space, Pikes Peak Cog Railway |
| Garden of the Gods | Famous for its stunning red rock formations, this area draws outdoor enthusiasts and photographers. It's a great spot for short-term rentals catering to nature lovers and adventure seekers. | Garden of the Gods Park, Kissing Camels, Gateway Program, The Visitors Center, Rock Ledge Ranch Historic Site |
| Cascades | A scenic area known for its beautiful views and proximity to hiking trails. Ideal for vacation rentals targeting families and tourists looking for outdoor activities. | Cascades Falls, Baldwin Lake, Mount Manitou Scenic Incline, Pikes Peak, Hiking Trails |
| Old Colorado City | A historic neighborhood with unique boutiques, art galleries, and eateries. It's the perfect location for visitors seeking a blend of history and modern amenities. | Old Colorado City Historic District, Simpson's Rest, Colorado Springs Pioneers Museum, Glen Eyrie Castle |
| Crystal Park | A secluded area offering a tranquil atmosphere and proximity to nature. Appeals to those looking for a peaceful retreat close to outdoor attractions. | Crystal Lake, Norton’s Pumpkin Patch, Hiking Trails, Scenic Overlooks |
| Pikes Peak Region | Known for its breathtaking mountain views and outdoor activities, this region attracts tourists all year round, making it ideal for Airbnb investments. | Pikes Peak, North Slope Recreation Area, Hiking Trails, Scenic Drives, Visitor Centers |
| Downtown Manitou Springs | The heart of Manitou Springs with shops, restaurants, and local events. Attracts tourists looking for convenience and a vibrant atmosphere. | Manitou Springs Brewpub and Grill, Chipita Park, Various local shops, Art Walks |
| Manitou Incline | Famous for its challenging hiking trail, the Incline attracts fitness enthusiasts and adventure travelers. Perfect for short-term rentals designed for those looking to conquer the hike. | Manitou Incline Trail, Pikes Peak, Barr Trail, Scenic views of the surrounding area |
Understanding Airbnb License Requirements & STR Laws in Manitou Springs (2026)
While Manitou Springs, Colorado, United States currently shows low STR regulations, specific Airbnb license requirements might still exist or change. Always verify the latest short term rental regulations and Airbnb license requirements directly with local government authorities for Manitou Springs to ensure full compliance before hosting.
(Source: AirROI data, 2026, finding no licensed listings among those analyzed)
Top Performing Airbnb Properties in Manitou Springs (2026)
Benchmark your potential! Explore examples of top-performing Airbnb properties in Manitou Springsbased on Trailing Twelve Month (TTM) revenue. Analyze their characteristics, revenue, occupancy rate, and ADR to understand what drives success in this market.
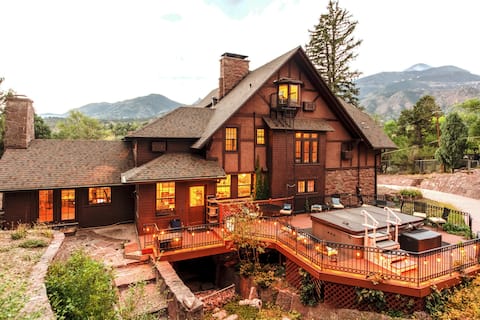
Onaledge House Manitou Springs
Entire Place • 8 bedrooms
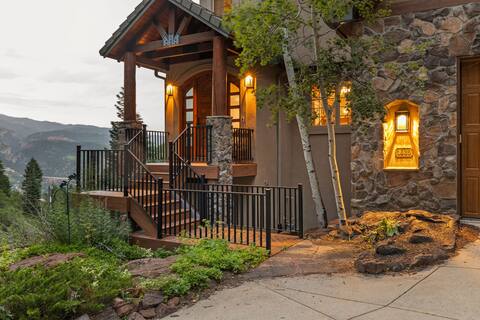
Secluded Mountain Lodge in Manitou Springs
Entire Place • 5 bedrooms

The Avenue! Historic Mansion in DT Manitou Springs
Entire Place • 9 bedrooms
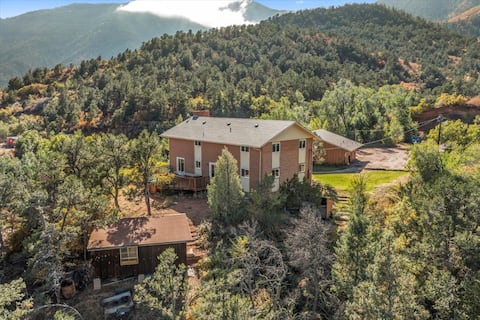
Mountain Lodge with large Hot Tub
Entire Place • 9 bedrooms

Modern Manitou | Streamside Deck Dining | Wildlife
Entire Place • 4 bedrooms
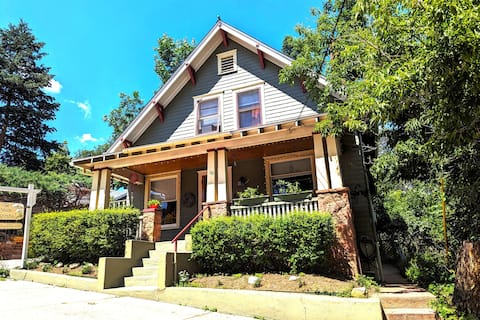
Historic 4BR Home | Walk Downtown
Entire Place • 4 bedrooms
Note: Performance varies based on location, size, amenities, seasonality, and management quality. Data reflects the past 12 months.
Top Performing Airbnb Hosts in Manitou Springs (2026)
Learn from the best! This table showcases top-performing Airbnb hosts in Manitou Springs based on the number of properties managed and estimated total revenue over the past year. Analyze their scale and performance metrics.
| Host Name | Properties | Grossing Revenue | Stay Reviews | Avg Rating |
|---|---|---|---|---|
| Smokebrush Farm | 7 | $415,906 | 652 | 4.92/5.0 |
| Morgan | 2 | $286,265 | 226 | 4.96/5.0 |
| Evolve | 6 | $273,214 | 298 | 4.86/5.0 |
| Christopher | 3 | $190,457 | 694 | 4.95/5.0 |
| Kaitlyn At Renjoy | 1 | $178,706 | 12 | 4.92/5.0 |
| Tim And Kris | 4 | $175,036 | 594 | 4.96/5.0 |
| Caitlin | 2 | $172,692 | 143 | 4.90/5.0 |
| Jeff And Mindy | 5 | $154,430 | 1416 | 4.85/5.0 |
| Michal | 8 | $153,760 | 2246 | 4.82/5.0 |
| Jean | 3 | $147,828 | 91 | 4.90/5.0 |
Analyzing the strategies of top hosts, such as their property selection, pricing, and guest communication, can offer valuable lessons for optimizing your own Airbnb operations in Manitou Springs.
Dive Deeper: Advanced Manitou Springs STR Market Data (2026)
Ready to unlock more insights? AirROI provides access to advanced metrics and comprehensive Airbnb data for Manitou Springs. Explore detailed analytics beyond this report to refine your investment strategy, optimize pricing, and maximize your vacation rental profits.
Explore Advanced MetricsManitou Springs Short-Term Rental Market Composition (2026): Property & Room Types
Room Type Distribution
Property Type Distribution
Market Composition Insights for Manitou Springs
- The Manitou Springs Airbnb market composition is heavily skewed towards Entire Home/Apt listings, which make up 73.8% of the 107 active rentals. This indicates strong guest preference for privacy and space.
- Looking at the property type distribution in Manitou Springs, House properties are the most common (48.6%), reflecting the local real estate landscape.
- Houses represent a significant 48.6% portion, catering likely to families or larger groups.
- The presence of 22.4% Hotel/Boutique listings indicates integration with traditional hospitality.
- Smaller segments like others (combined 0.9%) offer potential for unique stay experiences.
Manitou Springs Airbnb Room Capacity Analysis (2026): Bedroom Distribution
Distribution of Listings by Number of Bedrooms
Room Capacity Insights for Manitou Springs
- The dominant room capacity in Manitou Springs is 1 bedroom listings, making up 49.5% of the market. This suggests a strong demand for properties suitable for couples or solo travelers.
- Together, 1 bedroom and 2 bedrooms properties represent 69.1% of the active Airbnb listings in Manitou Springs, indicating a high concentration in these sizes.
- A significant 28.0% of listings offer 3+ bedrooms, catering to larger groups and families seeking more space in Manitou Springs.
Manitou Springs Vacation Rental Guest Capacity Trends (2026)
Distribution of Listings by Guest Capacity
Guest Capacity Insights for Manitou Springs
- The most common guest capacity trend in Manitou Springs vacation rentals is listings accommodating 2 guests (32.7%). This suggests the primary traveler segment is likely couples or solo travelers.
- Properties designed for 2 guests and 4 guests dominate the Manitou Springs STR market, accounting for 53.3% of listings.
- 34.6% of properties accommodate 6+ guests, serving the market segment for larger families or group travel in Manitou Springs.
- On average, properties in Manitou Springs are equipped to host 4.5 guests.
Manitou Springs Airbnb Booking Patterns (2026): Available vs. Booked Days
Available Days Distribution
Booked Days Distribution
Booking Pattern Insights for Manitou Springs
- The most common availability pattern in Manitou Springs falls within the 181-270 days range, representing 38.3% of listings. This suggests many properties have significant open periods on their calendars.
- Approximately 69.1% of listings show high availability (181+ days open annually), indicating potential for increased bookings or specific owner usage patterns.
- For booked days, the 91-180 days range is most frequent in Manitou Springs (37.4%), reflecting common guest stay durations or potential owner blocking patterns.
- A notable 31.7% of properties secure long booking periods (181+ days booked per year), highlighting successful long-term rental strategies or significant owner usage.
Manitou Springs Airbnb Minimum Stay Requirements Analysis
Distribution of Listings by Minimum Night Requirement
1 Night
26 listings
24.3% of total
2 Nights
25 listings
23.4% of total
3 Nights
2 listings
1.9% of total
7-29 Nights
5 listings
4.7% of total
30+ Nights
49 listings
45.8% of total
Key Insights
- The most prevalent minimum stay requirement in Manitou Springs is 30+ Nights, adopted by 45.8% of listings. This highlights the market's preference for longer commitments.
- A significant segment (45.8%) caters to monthly stays (30+ nights) in Manitou Springs, pointing to opportunities in the extended-stay market.
Recommendations
- Align with the market by considering a 30+ Nights minimum stay, as 45.8% of Manitou Springs hosts use this setting.
- If feasible, allowing 1-night stays, especially midweek or during low season, could capture last-minute bookings, as only 24.3% currently do.
- Explore offering discounts for stays of 30+ nights to attract the 45.8% of the market seeking extended stays.
- Adjust minimum nights based on seasonality – potentially shorter during low season and longer during peak demand periods in Manitou Springs.
Manitou Springs Airbnb Cancellation Policy Trends Analysis (2026)
Super Strict 30 Days
2 listings
1.9% of total
Flexible
11 listings
10.4% of total
Moderate
41 listings
38.7% of total
Firm
36 listings
34% of total
Strict
16 listings
15.1% of total
Cancellation Policy Insights for Manitou Springs
- The prevailing Airbnb cancellation policy trend in Manitou Springs is Moderate, used by 38.7% of listings.
- There's a relatively balanced mix between guest-friendly (49.1%) and stricter (49.1%) policies, offering choices for different guest needs.
Recommendations for Hosts
- Consider adopting a Moderate policy to align with the 38.7% market standard in Manitou Springs.
- Regularly review your cancellation policy against competitors and market demand shifts in Manitou Springs.
Manitou Springs STR Booking Lead Time Analysis (2026)
Average Booking Lead Time by Month
Booking Lead Time Insights for Manitou Springs
- The overall average booking lead time for vacation rentals in Manitou Springs is 65 days.
- Guests book furthest in advance for stays during August (average 89 days), likely coinciding with peak travel demand or local events.
- The shortest booking windows occur for stays in January (average 30 days), indicating more last-minute travel plans during this time.
- Seasonally, Summer (83 days avg.) sees the longest lead times, while Winter (40 days avg.) has the shortest, reflecting typical travel planning cycles.
Recommendations for Hosts
- Use the overall average lead time (65 days) as a baseline for your pricing and availability strategy in Manitou Springs.
- For August stays, consider implementing length-of-stay discounts or slightly higher rates for bookings made less than 89 days out to capitalize on advance planning.
- Target marketing efforts for the Summer season well in advance (at least 83 days) to capture early planners.
- Monitor your own booking lead times against these Manitou Springs averages to identify opportunities for dynamic pricing adjustments.
Popular & Essential Airbnb Amenities in Manitou Springs (2026)
Amenity Prevalence
Amenity Insights for Manitou Springs
- Essential amenities in Manitou Springs that guests expect include: Free parking on premises, Wifi, Smoke alarm, Carbon monoxide alarm, Heating, TV. Lacking these (any) could significantly impact bookings.
- Popular amenities like Essentials, Hot water, Fire extinguisher are common but not universal. Offering these can provide a competitive edge.
Recommendations for Hosts
- Ensure your listing includes all essential amenities for Manitou Springs: Free parking on premises, Wifi, Smoke alarm, Carbon monoxide alarm, Heating, TV.
- Prioritize adding missing essentials: Smoke alarm, Carbon monoxide alarm, Heating, TV.
- Consider adding popular differentiators like Essentials or Hot water to increase appeal.
- Highlight unique or less common amenities you offer (e.g., hot tub, dedicated workspace, EV charger) in your listing description and photos.
- Regularly check competitor amenities in Manitou Springs to stay competitive.
Manitou Springs Airbnb Guest Demographics & Profile Analysis (2026)
Guest Profile Summary for Manitou Springs
- The typical guest profile for Airbnb in Manitou Springs consists of primarily domestic travelers (97%), often arriving from nearby Denver, typically belonging to the Post-2000s (Gen Z/Alpha) group (50%), primarily speaking English or Spanish.
- Domestic travelers account for 96.8% of guests.
- Key international markets include United States (96.8%) and United Kingdom (1.2%).
- Top languages spoken are English (77.3%) followed by Spanish (11.8%).
- A significant demographic segment is the Post-2000s (Gen Z/Alpha) group, representing 50% of guests.
Recommendations for Hosts
- Target domestic marketing efforts towards travelers from Denver and Austin.
- Tailor amenities and listing descriptions to appeal to the dominant Post-2000s (Gen Z/Alpha) demographic (e.g., highlight fast WiFi, smart home features, local guides).
- Highlight unique local experiences or amenities relevant to the primary guest profile.
- Consider seasonal promotions aligned with peak travel times for key origin markets.
Nearby Short-Term Rental Market Comparison
How does the Manitou Springs Airbnb market stack up against its neighbors? Compare key performance metrics like average monthly revenue, ADR, and occupancy rates in surrounding areas to understand the broader regional STR landscape.
| Market | Active Properties | Monthly Revenue | Daily Rate | Avg. Occupancy |
|---|---|---|---|---|
| Aspen Park | 11 | $5,825 | $395.00 | 54% |
| Indian Hills | 11 | $5,799 | $333.03 | 54% |
| Black Hawk | 133 | $4,884 | $328.37 | 52% |
| Central City | 10 | $4,789 | $318.09 | 52% |
| Bailey | 126 | $4,611 | $310.32 | 53% |
| Cascade-Chipita Park | 103 | $4,541 | $330.50 | 52% |
| Woodmoor | 43 | $4,444 | $335.63 | 46% |
| Applewood | 18 | $4,400 | $269.95 | 56% |
| Golden | 276 | $4,261 | $301.62 | 54% |
| Evergreen | 190 | $4,246 | $336.66 | 48% |