Lone Tree Airbnb Market Analysis 2026: Short Term Rental Data & Vacation Rental Statistics in Colorado, United States
Is Airbnb profitable in Lone Tree in 2026? Explore comprehensive Airbnb analytics for Lone Tree, Colorado, United States to uncover income potential. This 2026 STR market report for Lone Tree, based on AirROI data from February 2025 to January 2026, reveals key trends in the niche market of 21 active listings.
Whether you're considering an Airbnb investment in Lone Tree, optimizing your existing vacation rental, or exploring rental arbitrage opportunities, understanding the Lone Tree Airbnb data is crucial. Leveraging the low regulation environment is key to maximizing your short term rental income potential. Let's dive into the specifics.
Key Lone Tree Airbnb Performance Metrics Overview
Monthly Airbnb Revenue Variations & Income Potential in Lone Tree (2026)
Understanding the monthly revenue variations for Airbnb listings in Lone Tree is key to maximizing your short term rental income potential. Seasonality significantly impacts earnings. Our analysis, based on data from the past 12 months, shows that the peak revenue month for STRs in Lone Tree is typically July, while January often presents the lowest earnings, highlighting opportunities for strategic pricing adjustments during shoulder and low seasons. Explore the typical Airbnb income in Lone Tree across different performance tiers:
- Best-in-class properties (Top 10%) achieve $6,929+ monthly, often utilizing dynamic pricing and superior guest experiences.
- Strong performing properties (Top 25%) earn $2,470 or more, indicating effective management and desirable locations/amenities.
- Typical properties (Median) generate around $999 per month, representing the average market performance.
- Entry-level properties (Bottom 25%) see earnings around $624, often with potential for optimization.
Average Monthly Airbnb Earnings Trend in Lone Tree
Lone Tree Airbnb Occupancy Rate Trends (2026)
Maximize your bookings by understanding the Lone Tree STR occupancy trends. Seasonal demand shifts significantly influence how often properties are booked. Typically, Februarysees the highest demand (peak season occupancy), while November experiences the lowest (low season). Effective strategies, like adjusting minimum stays or offering promotions, can boost occupancy during slower periods. Here's how different property tiers perform in Lone Tree:
- Best-in-class properties (Top 10%) achieve 79%+ occupancy, indicating high desirability and potentially optimized availability.
- Strong performing properties (Top 25%) maintain 63% or higher occupancy, suggesting good market fit and guest satisfaction.
- Typical properties (Median) have an occupancy rate around 42%.
- Entry-level properties (Bottom 25%) average 23% occupancy, potentially facing higher vacancy.
Average Monthly Occupancy Rate Trend in Lone Tree
Average Daily Rate (ADR) Airbnb Trends in Lone Tree (2026)
Effective short term rental pricing strategy in Lone Tree involves understanding monthly ADR fluctuations. The Average Daily Rate (ADR) for Airbnb in Lone Tree typically peaks in December and dips lowest during February. Leveraging Airbnb dynamic pricing tools or strategies based on this seasonality can significantly boost revenue. Here's a look at the typical nightly rates achieved:
- Best-in-class properties (Top 10%) command rates of $319+ per night, often due to premium features or locations.
- Strong performing properties (Top 25%) achieve nightly rates of $156 or more.
- Typical properties (Median) charge around $98 per night.
- Entry-level properties (Bottom 25%) earn around $62 per night.
Average Daily Rate (ADR) Trend by Month in Lone Tree
Get Live Lone Tree Market Intelligence 👇

Explore Real-time Analytics
Airbnb Seasonality Analysis & Trends in Lone Tree (2026)
Peak Season (July, August, May)
- Revenue averages $3,207 per month
- Occupancy rates average 49.5%
- Daily rates average $137
Shoulder Season
- Revenue averages $2,276 per month
- Occupancy maintains around 46.7%
- Daily rates hold near $148
Low Season (January, March, November)
- Revenue drops to average $1,235 per month
- Occupancy decreases to average 34.8%
- Daily rates adjust to average $154
Seasonality Insights for Lone Tree
- The Airbnb seasonality in Lone Tree shows highly seasonal trends requiring careful strategy. While the sections above show seasonal averages, it's also insightful to look at the extremes:
- During the high season, the absolute peak month showcases Lone Tree's highest earning potential, with monthly revenues capable of climbing to $3,774, occupancy reaching a high of 56.4%, and ADRs peaking at $172.
- Conversely, the slowest single month of the year, typically falling within the low season, marks the market's lowest point. In this month, revenue might dip to $1,057, occupancy could drop to 29.2%, and ADRs may adjust down to $121.
- Understanding both the seasonal averages and these monthly peaks and troughs in revenue, occupancy, and ADR is crucial for maximizing your Airbnb profit potential in Lone Tree.
Seasonal Strategies for Maximizing Profit
- Peak Season: Maximize revenue through premium pricing and potentially longer minimum stays. Ensure high availability.
- Low Season: Offer competitive pricing, special promotions (e.g., extended stay discounts), and flexible cancellation policies. Target off-season travelers like remote workers or budget-conscious guests.
- Shoulder Seasons: Implement dynamic pricing that balances peak and low rates. Target weekend travelers or specific events. Offer slightly more flexible terms than peak season.
- Regularly analyze your own performance against these Lone Tree seasonality benchmarks and adjust your pricing and availability strategy accordingly.
Best Areas for Airbnb Investment in Lone Tree (2026)
Exploring the top neighborhoods for short-term rentals in Lone Tree? This section highlights key areas, outlining why they are attractive for hosts and guests, along with notable local attractions. Consider these locations based on your target guest profile and investment strategy.
| Neighborhood / Area | Why Host Here? (Target Guests & Appeal) | Key Attractions & Landmarks |
|---|---|---|
| Lone Tree Town Center | The heart of Lone Tree offering shopping, dining, and entertainment options. A central location for tourists and business travelers with convenient access to major roads and amenities. | Park Meadow Mall, Lone Tree Arts Center, Restaurants and cafes, The Lone Tree Golf Club, Highlands Ranch Mansion |
| Bluffs Regional Park | A beautiful natural area with hiking trails and stunning views. Ideal for outdoor enthusiasts looking for nature experiences close to suburban amenities. | Bluffs Regional Park Trails, Panorama Trail, Wildlife viewing, Scenic overlooks |
| Piney Creek | A residential area that is family-friendly and has access to parks and recreational facilities. Great for families looking for a quieter retreat while still being close to urban amenities. | Piney Creek Park, Piney Creek Village, Community events and activities |
| The Ridge at Castle Pines | A prestigious community known for its luxury homes and golf courses. Attractive to visitors seeking an upscale experience in a scenic environment. | The Ridge Golf Course, Club at Castle Pines, Nature trails |
| Lone Tree & Park Meadows | Combining easy access to shopping at Park Meadows and the beauty of the nearby trails, this area attracts both leisure and business travelers. | Park Meadows Shopping Center, Entertainment venues, Dining options |
| Sky Ridge Medical Center | A notable location for medical tourism and business travelers, given the presence of many healthcare facilities and services. | Medical facilities, Health & wellness events, Nearby dining options |
| Challenger Park | A community park providing recreational facilities and spaces for gatherings, popular among families and those seeking outdoor activities. | Challenger Park Trails, Playgrounds, Sports fields |
| Golf Club at Lone Tree | A community area featuring a golf course that attracts golfers and visitors looking for leisure and relaxation in a beautiful setting. | Golf facilities, Clubhouse dining, Scenic landscapes |
Understanding Airbnb License Requirements & STR Laws in Lone Tree (2026)
While Lone Tree, Colorado, United States currently shows low STR regulations, specific Airbnb license requirements might still exist or change. Always verify the latest short term rental regulations and Airbnb license requirements directly with local government authorities for Lone Tree to ensure full compliance before hosting.
(Source: AirROI data, 2026, finding no licensed listings among those analyzed)
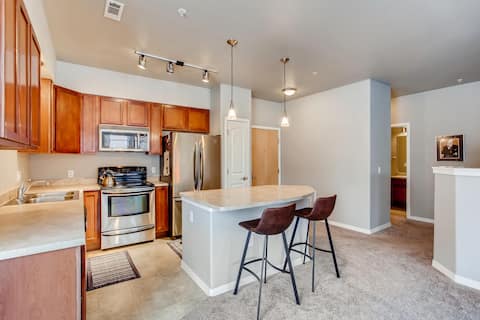
Top Performing Airbnb Properties in Lone Tree (2026)
Benchmark your potential! Explore examples of top-performing Airbnb properties in Lone Treebased on Trailing Twelve Month (TTM) revenue. Analyze their characteristics, revenue, occupancy rate, and ADR to understand what drives success in this market.

Bougie Barn in Lone Tree
Entire Place • 3 bedrooms
Libra House - game room, 20 min to Denver
Entire Place • 4 bedrooms

Family Friendly 4 Bdrm/2ba Next to Park/Mall/Trail
Entire Place • 4 bedrooms

Luxury, 1Bed,2Bath,&Futon, 2min to LightRail,Mall
Entire Place • 1 bedroom
4BR + office updated home, great location! Dogs OK
Entire Place • 4 bedrooms
Entire 2 Bedroom 2 Bath Lone Tree Condo
Entire Place • 2 bedrooms
Note: Performance varies based on location, size, amenities, seasonality, and management quality. Data reflects the past 12 months.
Top Performing Airbnb Hosts in Lone Tree (2026)
Learn from the best! This table showcases top-performing Airbnb hosts in Lone Tree based on the number of properties managed and estimated total revenue over the past year. Analyze their scale and performance metrics.
| Host Name | Properties | Grossing Revenue | Stay Reviews | Avg Rating |
|---|---|---|---|---|
| Elizabeth | 1 | $89,626 | 46 | 4.98/5.0 |
| Michelle | 1 | $55,711 | 15 | 5.00/5.0 |
| Milo | 1 | $45,133 | 48 | 4.94/5.0 |
| Ethan | 1 | $25,974 | 36 | 4.86/5.0 |
| Andrew | 2 | $18,031 | 926 | 4.93/5.0 |
| Endily | 1 | $16,141 | 4 | 5.00/5.0 |
| Jonathan | 1 | $15,681 | 16 | 4.63/5.0 |
| Anthony | 1 | $13,129 | 30 | 5.00/5.0 |
| Renee Lynn | 2 | $10,009 | 15 | 4.93/5.0 |
| Xiaoou | 1 | $6,698 | 2 | Not Rated |
Analyzing the strategies of top hosts, such as their property selection, pricing, and guest communication, can offer valuable lessons for optimizing your own Airbnb operations in Lone Tree.
Dive Deeper: Advanced Lone Tree STR Market Data (2026)
Ready to unlock more insights? AirROI provides access to advanced metrics and comprehensive Airbnb data for Lone Tree. Explore detailed analytics beyond this report to refine your investment strategy, optimize pricing, and maximize your vacation rental profits.
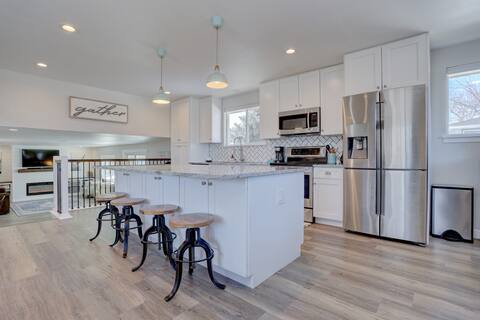
Explore Advanced MetricsLone Tree Short-Term Rental Market Composition (2026): Property & Room Types
Room Type Distribution
Property Type Distribution
Market Composition Insights for Lone Tree
- The Lone Tree Airbnb market composition is heavily skewed towards Private Room listings, which make up 61.9% of the 21 active rentals. This indicates strong guest preference for privacy and space.
- Looking at the property type distribution in Lone Tree, House properties are the most common (85.7%), reflecting the local real estate landscape.
- Houses represent a significant 85.7% portion, catering likely to families or larger groups.
Lone Tree Airbnb Room Capacity Analysis (2026): Bedroom Distribution
Distribution of Listings by Number of Bedrooms
Room Capacity Insights for Lone Tree
- The dominant room capacity in Lone Tree is 4 bedrooms listings, making up 14.3% of the market. This suggests a strong demand for properties suitable for families or small groups.
- Together, 4 bedrooms and 2 bedrooms properties represent 28.6% of the active Airbnb listings in Lone Tree, indicating a high concentration in these sizes.
- A significant 23.8% of listings offer 3+ bedrooms, catering to larger groups and families seeking more space in Lone Tree.
Lone Tree Vacation Rental Guest Capacity Trends (2026)
Distribution of Listings by Guest Capacity
Guest Capacity Insights for Lone Tree
- The most common guest capacity trend in Lone Tree vacation rentals is listings accommodating 8+ guests (19%). This suggests the primary traveler segment is likely larger groups.
- Properties designed for 8+ guests and 4 guests dominate the Lone Tree STR market, accounting for 33.3% of listings.
- 23.8% of properties accommodate 6+ guests, serving the market segment for larger families or group travel in Lone Tree.
- On average, properties in Lone Tree are equipped to host 2.4 guests.
Lone Tree Airbnb Booking Patterns (2026): Available vs. Booked Days
Available Days Distribution
Booked Days Distribution
Booking Pattern Insights for Lone Tree
- The most common availability pattern in Lone Tree falls within the 271-366 days range, representing 52.4% of listings. This suggests many properties have significant open periods on their calendars.
- Approximately 90.5% of listings show high availability (181+ days open annually), indicating potential for increased bookings or specific owner usage patterns.
- For booked days, the 91-180 days range is most frequent in Lone Tree (42.9%), reflecting common guest stay durations or potential owner blocking patterns.
- A notable 9.5% of properties secure long booking periods (181+ days booked per year), highlighting successful long-term rental strategies or significant owner usage.
Lone Tree Airbnb Minimum Stay Requirements Analysis
Distribution of Listings by Minimum Night Requirement
1 Night
5 listings
23.8% of total
2 Nights
3 listings
14.3% of total
4-6 Nights
2 listings
9.5% of total
7-29 Nights
2 listings
9.5% of total
30+ Nights
9 listings
42.9% of total
Key Insights
- The most prevalent minimum stay requirement in Lone Tree is 30+ Nights, adopted by 42.9% of listings. This highlights the market's preference for longer commitments.
- A significant segment (42.9%) caters to monthly stays (30+ nights) in Lone Tree, pointing to opportunities in the extended-stay market.
Recommendations
- Align with the market by considering a 30+ Nights minimum stay, as 42.9% of Lone Tree hosts use this setting.
- If feasible, allowing 1-night stays, especially midweek or during low season, could capture last-minute bookings, as only 23.8% currently do.
- Explore offering discounts for stays of 30+ nights to attract the 42.9% of the market seeking extended stays.
- Adjust minimum nights based on seasonality – potentially shorter during low season and longer during peak demand periods in Lone Tree.
Lone Tree Airbnb Cancellation Policy Trends Analysis (2026)
Flexible
8 listings
38.1% of total
Moderate
4 listings
19% of total
Firm
7 listings
33.3% of total
Strict
2 listings
9.5% of total
Cancellation Policy Insights for Lone Tree
- The prevailing Airbnb cancellation policy trend in Lone Tree is Flexible, used by 38.1% of listings.
- There's a relatively balanced mix between guest-friendly (57.1%) and stricter (42.8%) policies, offering choices for different guest needs.
- Strict cancellation policies are quite rare (9.5%), potentially making listings with this policy less competitive unless justified by high demand or property type.
Recommendations for Hosts
- Consider adopting a Flexible policy to align with the 38.1% market standard in Lone Tree.
- Using a Strict policy might deter some guests, as only 9.5% of listings use it. Evaluate if potential revenue protection outweighs possible lower booking rates.
- Regularly review your cancellation policy against competitors and market demand shifts in Lone Tree.
Lone Tree STR Booking Lead Time Analysis (2026)
Average Booking Lead Time by Month
Booking Lead Time Insights for Lone Tree
- The overall average booking lead time for vacation rentals in Lone Tree is 30 days.
- Guests book furthest in advance for stays during November (average 72 days), likely coinciding with peak travel demand or local events.
- The shortest booking windows occur for stays in March (average 10 days), indicating more last-minute travel plans during this time.
- Seasonally, Fall (48 days avg.) sees the longest lead times, while Spring (18 days avg.) has the shortest, reflecting typical travel planning cycles.
Recommendations for Hosts
- Use the overall average lead time (30 days) as a baseline for your pricing and availability strategy in Lone Tree.
- For November stays, consider implementing length-of-stay discounts or slightly higher rates for bookings made less than 72 days out to capitalize on advance planning.
- During March, focus on last-minute booking availability and promotions, as guests book with very short notice (10 days avg.).
- Target marketing efforts for the Fall season well in advance (at least 48 days) to capture early planners.
- Monitor your own booking lead times against these Lone Tree averages to identify opportunities for dynamic pricing adjustments.
Popular & Essential Airbnb Amenities in Lone Tree (2026)
Amenity Prevalence
Amenity Insights for Lone Tree
- Essential amenities in Lone Tree that guests expect include: Smoke alarm, Air conditioning, Wifi, TV, Heating. Lacking these (any) could significantly impact bookings.
- Popular amenities like Carbon monoxide alarm, Coffee maker, Hot water are common but not universal. Offering these can provide a competitive edge.
Recommendations for Hosts
- Ensure your listing includes all essential amenities for Lone Tree: Smoke alarm, Air conditioning, Wifi, TV, Heating.
- Prioritize adding missing essentials: TV, Heating.
- Consider adding popular differentiators like Carbon monoxide alarm or Coffee maker to increase appeal.
- Highlight unique or less common amenities you offer (e.g., hot tub, dedicated workspace, EV charger) in your listing description and photos.
- Regularly check competitor amenities in Lone Tree to stay competitive.
Lone Tree Airbnb Guest Demographics & Profile Analysis (2026)
Guest Profile Summary for Lone Tree
- The typical guest profile for Airbnb in Lone Tree consists of primarily domestic travelers (97%), often arriving from nearby Colorado Springs, typically belonging to the Post-2000s (Gen Z/Alpha) group (50%), primarily speaking English or Spanish.
- Domestic travelers account for 96.7% of guests.
- Key international markets include United States (96.7%) and Germany (1.1%).
- Top languages spoken are English (61.8%) followed by Spanish (23.5%).
- A significant demographic segment is the Post-2000s (Gen Z/Alpha) group, representing 50% of guests.
Recommendations for Hosts
- Target domestic marketing efforts towards travelers from Colorado Springs and Houston.
- Tailor amenities and listing descriptions to appeal to the dominant Post-2000s (Gen Z/Alpha) demographic (e.g., highlight fast WiFi, smart home features, local guides).
- Highlight unique local experiences or amenities relevant to the primary guest profile.
- Consider seasonal promotions aligned with peak travel times for key origin markets.
Nearby Short-Term Rental Market Comparison
How does the Lone Tree Airbnb market stack up against its neighbors? Compare key performance metrics like average monthly revenue, ADR, and occupancy rates in surrounding areas to understand the broader regional STR landscape.
| Market | Active Properties | Monthly Revenue | Daily Rate | Avg. Occupancy |
|---|---|---|---|---|
| Aspen Park | 11 | $5,825 | $395.00 | 54% |
| Indian Hills | 11 | $5,799 | $333.03 | 54% |
| Grand County | 14 | $5,137 | $513.48 | 42% |
| Black Hawk | 133 | $4,884 | $328.37 | 52% |
| Central City | 10 | $4,789 | $318.09 | 52% |
| Bailey | 126 | $4,611 | $310.32 | 53% |
| Cascade-Chipita Park | 103 | $4,541 | $330.50 | 52% |
| Estes Park | 1,311 | $4,504 | $383.02 | 45% |
| Woodmoor | 43 | $4,444 | $335.63 | 46% |
| Applewood | 18 | $4,400 | $269.95 | 56% |