Larkspur Airbnb Market Analysis 2026: Short Term Rental Data & Vacation Rental Statistics in Colorado, United States
Is Airbnb profitable in Larkspur in 2026? Explore comprehensive Airbnb analytics for Larkspur, Colorado, United States to uncover income potential. This 2026 STR market report for Larkspur, based on AirROI data from February 2025 to January 2026, reveals key trends in the niche market of 30 active listings.
Whether you're considering an Airbnb investment in Larkspur, optimizing your existing vacation rental, or exploring rental arbitrage opportunities, understanding the Larkspur Airbnb data is crucial. Leveraging the low regulation environment is key to maximizing your short term rental income potential. Let's dive into the specifics.
Key Larkspur Airbnb Performance Metrics Overview
Monthly Airbnb Revenue Variations & Income Potential in Larkspur (2026)
Understanding the monthly revenue variations for Airbnb listings in Larkspur is key to maximizing your short term rental income potential. Seasonality significantly impacts earnings. Our analysis, based on data from the past 12 months, shows that the peak revenue month for STRs in Larkspur is typically July, while February often presents the lowest earnings, highlighting opportunities for strategic pricing adjustments during shoulder and low seasons. Explore the typical Airbnb income in Larkspur across different performance tiers:
- Best-in-class properties (Top 10%) achieve $8,545+ monthly, often utilizing dynamic pricing and superior guest experiences.
- Strong performing properties (Top 25%) earn $5,164 or more, indicating effective management and desirable locations/amenities.
- Typical properties (Median) generate around $3,128 per month, representing the average market performance.
- Entry-level properties (Bottom 25%) see earnings around $1,549, often with potential for optimization.
Average Monthly Airbnb Earnings Trend in Larkspur
Larkspur Airbnb Occupancy Rate Trends (2026)
Maximize your bookings by understanding the Larkspur STR occupancy trends. Seasonal demand shifts significantly influence how often properties are booked. Typically, Julysees the highest demand (peak season occupancy), while January experiences the lowest (low season). Effective strategies, like adjusting minimum stays or offering promotions, can boost occupancy during slower periods. Here's how different property tiers perform in Larkspur:
- Best-in-class properties (Top 10%) achieve 78%+ occupancy, indicating high desirability and potentially optimized availability.
- Strong performing properties (Top 25%) maintain 59% or higher occupancy, suggesting good market fit and guest satisfaction.
- Typical properties (Median) have an occupancy rate around 42%.
- Entry-level properties (Bottom 25%) average 26% occupancy, potentially facing higher vacancy.
Average Monthly Occupancy Rate Trend in Larkspur
Average Daily Rate (ADR) Airbnb Trends in Larkspur (2026)
Effective short term rental pricing strategy in Larkspur involves understanding monthly ADR fluctuations. The Average Daily Rate (ADR) for Airbnb in Larkspur typically peaks in December and dips lowest during April. Leveraging Airbnb dynamic pricing tools or strategies based on this seasonality can significantly boost revenue. Here's a look at the typical nightly rates achieved:
- Best-in-class properties (Top 10%) command rates of $475+ per night, often due to premium features or locations.
- Strong performing properties (Top 25%) achieve nightly rates of $287 or more.
- Typical properties (Median) charge around $202 per night.
- Entry-level properties (Bottom 25%) earn around $134 per night.
Average Daily Rate (ADR) Trend by Month in Larkspur
Get Live Larkspur Market Intelligence 👇

Explore Real-time Analytics
Airbnb Seasonality Analysis & Trends in Larkspur (2026)
Peak Season (July, June, December)
- Revenue averages $5,714 per month
- Occupancy rates average 52.8%
- Daily rates average $276
Shoulder Season
- Revenue averages $3,911 per month
- Occupancy maintains around 43.3%
- Daily rates hold near $257
Low Season (February, April, November)
- Revenue drops to average $2,545 per month
- Occupancy decreases to average 34.7%
- Daily rates adjust to average $238
Seasonality Insights for Larkspur
- The Airbnb seasonality in Larkspur shows highly seasonal trends requiring careful strategy. While the sections above show seasonal averages, it's also insightful to look at the extremes:
- During the high season, the absolute peak month showcases Larkspur's highest earning potential, with monthly revenues capable of climbing to $6,355, occupancy reaching a high of 64.0%, and ADRs peaking at $295.
- Conversely, the slowest single month of the year, typically falling within the low season, marks the market's lowest point. In this month, revenue might dip to $2,051, occupancy could drop to 27.5%, and ADRs may adjust down to $215.
- Understanding both the seasonal averages and these monthly peaks and troughs in revenue, occupancy, and ADR is crucial for maximizing your Airbnb profit potential in Larkspur.
Seasonal Strategies for Maximizing Profit
- Peak Season: Maximize revenue through premium pricing and potentially longer minimum stays. Ensure high availability.
- Low Season: Offer competitive pricing, special promotions (e.g., extended stay discounts), and flexible cancellation policies. Target off-season travelers like remote workers or budget-conscious guests.
- Shoulder Seasons: Implement dynamic pricing that balances peak and low rates. Target weekend travelers or specific events. Offer slightly more flexible terms than peak season.
- Regularly analyze your own performance against these Larkspur seasonality benchmarks and adjust your pricing and availability strategy accordingly.
Best Areas for Airbnb Investment in Larkspur (2026)
Exploring the top neighborhoods for short-term rentals in Larkspur? This section highlights key areas, outlining why they are attractive for hosts and guests, along with notable local attractions. Consider these locations based on your target guest profile and investment strategy.
| Neighborhood / Area | Why Host Here? (Target Guests & Appeal) | Key Attractions & Landmarks |
|---|---|---|
| Downtown Larkspur | A vibrant area with charming shops and eateries, great for tourists wanting a mix of local culture and convenience. | Larkspur Park, Aspen Grove Park, local boutiques, restaurants, art galleries |
| Larkspur Village | Known for its small-town ambiance and community events, it's ideal for visitors looking to enjoy a quaint atmosphere. | Larkspur Historical Society, local farmers markets, craft shops, vintage stores, Larkspur Community Center |
| Castlewood Canyon State Park | An outdoor paradise for nature lovers and adventure seekers, perfect for those looking to escape the city and enjoy hiking and photography. | hiking trails, picnic areas, historic ruins, wildlife viewing, scenic vistas |
| Parker Road Area | A more suburban setting with easy access to nearby attractions, appealing to families and longer-term visitors. | Parker Rd shopping centers, parks, family friendly restaurants, fitness centers, local entertainment options |
| Castle Rock | Close to Larkspur and with rapid growth, it’s a popular destination for travelers looking for shopping and dining options. | Castle Rock Outlets, Downtown Castle Rock, Red Hawk Ridge Golf Course, local festivals, Castle Rock Historical Society |
| South Platte River | A picturesque area for nature enthusiasts, especially those interested in fishing, rafting, and beautiful river views. | fishing spots, rafting opportunities, nature trails, wildlife habitats, scenic viewpoints |
| North County Park | An expansive park area offering recreational activities that cater to families and groups seeking outdoor fun. | playgrounds, hiking trails, sports fields, picnic areas, nature programs |
| Morrison | A nearby town with a rich history and unique attractions, ideal for visitors interested in local culture and adventure. | Red Rocks Amphitheatre, Morrison Natural History Museum, local dining, hiking trails, scenic drives |
Understanding Airbnb License Requirements & STR Laws in Larkspur (2026)
While Larkspur, Colorado, United States currently shows low STR regulations, specific Airbnb license requirements might still exist or change. Always verify the latest short term rental regulations and Airbnb license requirements directly with local government authorities for Larkspur to ensure full compliance before hosting.
(Source: AirROI data, 2026, finding no licensed listings among those analyzed)
Top Performing Airbnb Properties in Larkspur (2026)
Benchmark your potential! Explore examples of top-performing Airbnb properties in Larkspurbased on Trailing Twelve Month (TTM) revenue. Analyze their characteristics, revenue, occupancy rate, and ADR to understand what drives success in this market.
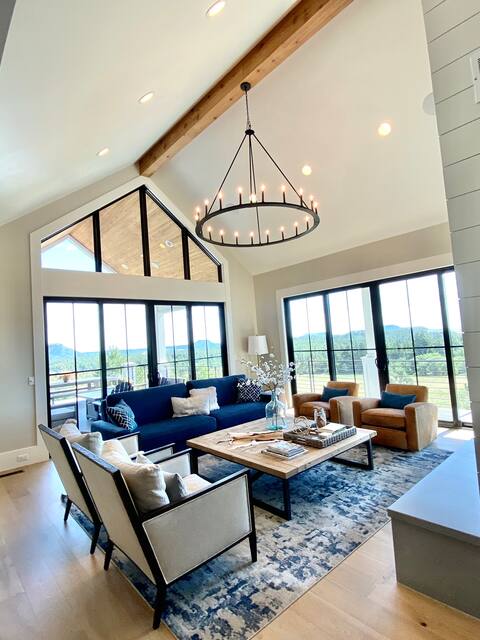
Dreamy Mountain Escape on 35 forested acres!
Entire Place • 6 bedrooms

Private, 36 Acres, 6 Kings, HotTub, Views, Clean
Entire Place • 6 bedrooms
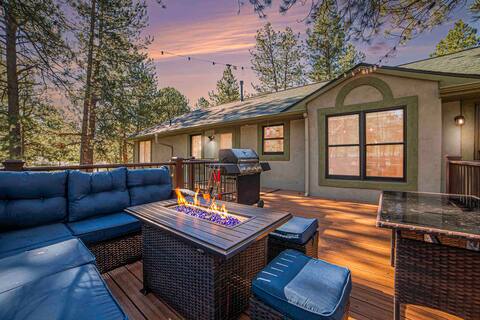
Large Home w/Hot Tub, Fire Pit, Pool Table
Entire Place • 6 bedrooms
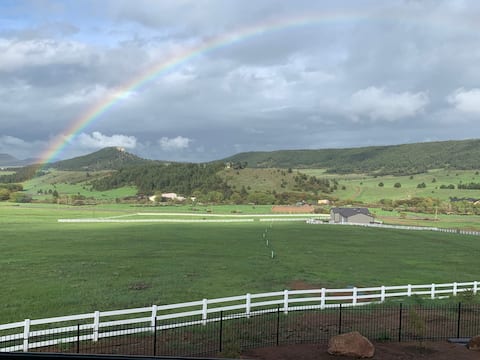
Larkspur Barndominium - 35 acre Ranch
Entire Place • 2 bedrooms
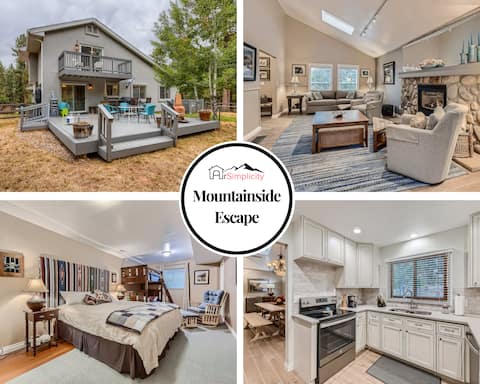
Mountainside Escape: EV Charger, Patio & Views
Entire Place • 5 bedrooms

Country home on 40 acres near AFA, Venues, & Lake
Entire Place • 4 bedrooms
Note: Performance varies based on location, size, amenities, seasonality, and management quality. Data reflects the past 12 months.
Top Performing Airbnb Hosts in Larkspur (2026)
Learn from the best! This table showcases top-performing Airbnb hosts in Larkspur based on the number of properties managed and estimated total revenue over the past year. Analyze their scale and performance metrics.
| Host Name | Properties | Grossing Revenue | Stay Reviews | Avg Rating |
|---|---|---|---|---|
| Gwenevere Lorraine | 1 | $188,215 | 93 | 4.98/5.0 |
| Shaun | 1 | $103,726 | 29 | 4.90/5.0 |
| Philip | 3 | $92,385 | 267 | 4.71/5.0 |
| Aaron | 1 | $91,014 | 86 | 4.91/5.0 |
| Micah | 1 | $68,090 | 279 | 4.95/5.0 |
| Tina | 2 | $63,491 | 74 | 4.91/5.0 |
| AirSimplicity | 1 | $58,829 | 104 | 4.88/5.0 |
| Evolve | 2 | $54,874 | 7 | 4.60/5.0 |
| Stephanie | 1 | $48,430 | 77 | 5.00/5.0 |
| Cheryl | 2 | $47,324 | 345 | 4.96/5.0 |
Analyzing the strategies of top hosts, such as their property selection, pricing, and guest communication, can offer valuable lessons for optimizing your own Airbnb operations in Larkspur.
Dive Deeper: Advanced Larkspur STR Market Data (2026)
Ready to unlock more insights? AirROI provides access to advanced metrics and comprehensive Airbnb data for Larkspur. Explore detailed analytics beyond this report to refine your investment strategy, optimize pricing, and maximize your vacation rental profits.
Explore Advanced MetricsLarkspur Short-Term Rental Market Composition (2026): Property & Room Types
Room Type Distribution
Property Type Distribution
Market Composition Insights for Larkspur
- The Larkspur Airbnb market composition is heavily skewed towards Entire Home/Apt listings, which make up 93.3% of the 30 active rentals. This indicates strong guest preference for privacy and space.
- Looking at the property type distribution in Larkspur, House properties are the most common (46.7%), reflecting the local real estate landscape.
- Houses represent a significant 46.7% portion, catering likely to families or larger groups.
- Smaller segments like hotel/boutique (combined 3.3%) offer potential for unique stay experiences.
Larkspur Airbnb Room Capacity Analysis (2026): Bedroom Distribution
Distribution of Listings by Number of Bedrooms
Room Capacity Insights for Larkspur
- The dominant room capacity in Larkspur is 2 bedrooms listings, making up 33.3% of the market. This suggests a strong demand for properties suitable for couples or solo travelers.
- Together, 2 bedrooms and 1 bedroom properties represent 60.0% of the active Airbnb listings in Larkspur, indicating a high concentration in these sizes.
- A significant 33.3% of listings offer 3+ bedrooms, catering to larger groups and families seeking more space in Larkspur.
Larkspur Vacation Rental Guest Capacity Trends (2026)
Distribution of Listings by Guest Capacity
Guest Capacity Insights for Larkspur
- The most common guest capacity trend in Larkspur vacation rentals is listings accommodating 8+ guests (36.7%). This suggests the primary traveler segment is likely larger groups.
- Properties designed for 8+ guests and 2 guests dominate the Larkspur STR market, accounting for 56.7% of listings.
- 53.4% of properties accommodate 6+ guests, serving the market segment for larger families or group travel in Larkspur.
- On average, properties in Larkspur are equipped to host 5.3 guests.
Larkspur Airbnb Booking Patterns (2026): Available vs. Booked Days
Available Days Distribution
Booked Days Distribution
Booking Pattern Insights for Larkspur
- The most common availability pattern in Larkspur falls within the 271-366 days range, representing 43.3% of listings. This suggests many properties have significant open periods on their calendars.
- Approximately 86.6% of listings show high availability (181+ days open annually), indicating potential for increased bookings or specific owner usage patterns.
- For booked days, the 91-180 days range is most frequent in Larkspur (43.3%), reflecting common guest stay durations or potential owner blocking patterns.
- A notable 16.7% of properties secure long booking periods (181+ days booked per year), highlighting successful long-term rental strategies or significant owner usage.
Larkspur Airbnb Minimum Stay Requirements Analysis
Distribution of Listings by Minimum Night Requirement
1 Night
6 listings
20% of total
2 Nights
15 listings
50% of total
3 Nights
1 listings
3.3% of total
30+ Nights
8 listings
26.7% of total
Key Insights
- The most prevalent minimum stay requirement in Larkspur is 2 Nights, adopted by 50% of listings. This highlights the market's preference for shorter, flexible bookings.
- A strong majority (70.0%) of the Larkspur Airbnb data shows acceptance of very short stays (1-2 nights), indicating a dynamic, high-turnover market.
- A significant segment (26.7%) caters to monthly stays (30+ nights) in Larkspur, pointing to opportunities in the extended-stay market.
Recommendations
- Align with the market by considering a 2 Nights minimum stay, as 50% of Larkspur hosts use this setting.
- If feasible, allowing 1-night stays, especially midweek or during low season, could capture last-minute bookings, as only 20% currently do.
- Explore offering discounts for stays of 30+ nights to attract the 26.7% of the market seeking extended stays.
- Adjust minimum nights based on seasonality – potentially shorter during low season and longer during peak demand periods in Larkspur.
Larkspur Airbnb Cancellation Policy Trends Analysis (2026)
Limited
1 listings
3.3% of total
Flexible
4 listings
13.3% of total
Moderate
13 listings
43.3% of total
Firm
6 listings
20% of total
Strict
6 listings
20% of total
Cancellation Policy Insights for Larkspur
- The prevailing Airbnb cancellation policy trend in Larkspur is Moderate, used by 43.3% of listings.
- There's a relatively balanced mix between guest-friendly (56.6%) and stricter (40.0%) policies, offering choices for different guest needs.
Recommendations for Hosts
- Consider adopting a Moderate policy to align with the 43.3% market standard in Larkspur.
- Regularly review your cancellation policy against competitors and market demand shifts in Larkspur.
Larkspur STR Booking Lead Time Analysis (2026)
Average Booking Lead Time by Month
Booking Lead Time Insights for Larkspur
- The overall average booking lead time for vacation rentals in Larkspur is 63 days.
- Guests book furthest in advance for stays during October (average 99 days), likely coinciding with peak travel demand or local events.
- The shortest booking windows occur for stays in March (average 39 days), indicating more last-minute travel plans during this time.
- Seasonally, Fall (92 days avg.) sees the longest lead times, while Spring (53 days avg.) has the shortest, reflecting typical travel planning cycles.
Recommendations for Hosts
- Use the overall average lead time (63 days) as a baseline for your pricing and availability strategy in Larkspur.
- For October stays, consider implementing length-of-stay discounts or slightly higher rates for bookings made less than 99 days out to capitalize on advance planning.
- Target marketing efforts for the Fall season well in advance (at least 92 days) to capture early planners.
- Monitor your own booking lead times against these Larkspur averages to identify opportunities for dynamic pricing adjustments.
Popular & Essential Airbnb Amenities in Larkspur (2026)
Amenity Prevalence
Amenity Insights for Larkspur
- Essential amenities in Larkspur that guests expect include: Free parking on premises, Smoke alarm, Cooking basics. Lacking these (any) could significantly impact bookings.
- Popular amenities like Fire extinguisher, Wifi, Dishes and silverware are common but not universal. Offering these can provide a competitive edge.
- Warning: Wifi is not universally provided but is considered essential globally. Ensure reliable Wifi is offered.
Recommendations for Hosts
- Ensure your listing includes all essential amenities for Larkspur: Free parking on premises, Smoke alarm, Cooking basics.
- Prioritize adding missing essentials: Smoke alarm, Cooking basics.
- Consider adding popular differentiators like Fire extinguisher or Wifi to increase appeal.
- Highlight unique or less common amenities you offer (e.g., hot tub, dedicated workspace, EV charger) in your listing description and photos.
- Regularly check competitor amenities in Larkspur to stay competitive.
Larkspur Airbnb Guest Demographics & Profile Analysis (2026)
Guest Profile Summary for Larkspur
- The typical guest profile for Airbnb in Larkspur consists of primarily domestic travelers (98%), often arriving from nearby Denver, typically belonging to the Post-2000s (Gen Z/Alpha) group (50%), primarily speaking English or Spanish.
- Domestic travelers account for 97.5% of guests.
- Key international markets include United States (97.5%) and Costa Rica (0.5%).
- Top languages spoken are English (76.7%) followed by Spanish (15.6%).
- A significant demographic segment is the Post-2000s (Gen Z/Alpha) group, representing 50% of guests.
Recommendations for Hosts
- Target domestic marketing efforts towards travelers from Denver and Colorado Springs.
- Tailor amenities and listing descriptions to appeal to the dominant Post-2000s (Gen Z/Alpha) demographic (e.g., highlight fast WiFi, smart home features, local guides).
- Highlight unique local experiences or amenities relevant to the primary guest profile.
- Consider seasonal promotions aligned with peak travel times for key origin markets.
Nearby Short-Term Rental Market Comparison
How does the Larkspur Airbnb market stack up against its neighbors? Compare key performance metrics like average monthly revenue, ADR, and occupancy rates in surrounding areas to understand the broader regional STR landscape.
| Market | Active Properties | Monthly Revenue | Daily Rate | Avg. Occupancy |
|---|---|---|---|---|
| Aspen Park | 11 | $5,825 | $395.00 | 54% |
| Indian Hills | 11 | $5,799 | $333.03 | 54% |
| Grand County | 14 | $5,137 | $513.48 | 42% |
| Black Hawk | 133 | $4,884 | $328.37 | 52% |
| Central City | 10 | $4,789 | $318.09 | 52% |
| Bailey | 126 | $4,611 | $310.32 | 53% |
| Cascade-Chipita Park | 103 | $4,541 | $330.50 | 52% |
| Estes Park | 1,311 | $4,504 | $383.02 | 45% |
| Woodmoor | 43 | $4,444 | $335.63 | 46% |
| Applewood | 18 | $4,400 | $269.95 | 56% |