Lakewood Airbnb Market Analysis 2026: Short Term Rental Data & Vacation Rental Statistics in Colorado, United States
Is Airbnb profitable in Lakewood in 2026? Explore comprehensive Airbnb analytics for Lakewood, Colorado, United States to uncover income potential. This 2026 STR market report for Lakewood, based on AirROI data from February 2025 to January 2026, reveals key trends in the market of 371 active listings.
Whether you're considering an Airbnb investment in Lakewood, optimizing your existing vacation rental, or exploring rental arbitrage opportunities, understanding the Lakewood Airbnb data is crucial. Understanding the local regulations is key to maximizing your short term rental income potential. Let's dive into the specifics.
Key Lakewood Airbnb Performance Metrics Overview
Monthly Airbnb Revenue Variations & Income Potential in Lakewood (2026)
Understanding the monthly revenue variations for Airbnb listings in Lakewood is key to maximizing your short term rental income potential. Seasonality significantly impacts earnings. Our analysis, based on data from the past 12 months, shows that the peak revenue month for STRs in Lakewood is typically July, while February often presents the lowest earnings, highlighting opportunities for strategic pricing adjustments during shoulder and low seasons. Explore the typical Airbnb income in Lakewood across different performance tiers:
- Best-in-class properties (Top 10%) achieve $5,646+ monthly, often utilizing dynamic pricing and superior guest experiences.
- Strong performing properties (Top 25%) earn $3,934 or more, indicating effective management and desirable locations/amenities.
- Typical properties (Median) generate around $2,331 per month, representing the average market performance.
- Entry-level properties (Bottom 25%) see earnings around $1,036, often with potential for optimization.
Average Monthly Airbnb Earnings Trend in Lakewood
Lakewood Airbnb Occupancy Rate Trends (2026)
Maximize your bookings by understanding the Lakewood STR occupancy trends. Seasonal demand shifts significantly influence how often properties are booked. Typically, Julysees the highest demand (peak season occupancy), while January experiences the lowest (low season). Effective strategies, like adjusting minimum stays or offering promotions, can boost occupancy during slower periods. Here's how different property tiers perform in Lakewood:
- Best-in-class properties (Top 10%) achieve 87%+ occupancy, indicating high desirability and potentially optimized availability.
- Strong performing properties (Top 25%) maintain 74% or higher occupancy, suggesting good market fit and guest satisfaction.
- Typical properties (Median) have an occupancy rate around 55%.
- Entry-level properties (Bottom 25%) average 32% occupancy, potentially facing higher vacancy.
Average Monthly Occupancy Rate Trend in Lakewood
Average Daily Rate (ADR) Airbnb Trends in Lakewood (2026)
Effective short term rental pricing strategy in Lakewood involves understanding monthly ADR fluctuations. The Average Daily Rate (ADR) for Airbnb in Lakewood typically peaks in December and dips lowest during February. Leveraging Airbnb dynamic pricing tools or strategies based on this seasonality can significantly boost revenue. Here's a look at the typical nightly rates achieved:
- Best-in-class properties (Top 10%) command rates of $306+ per night, often due to premium features or locations.
- Strong performing properties (Top 25%) achieve nightly rates of $199 or more.
- Typical properties (Median) charge around $130 per night.
- Entry-level properties (Bottom 25%) earn around $83 per night.
Average Daily Rate (ADR) Trend by Month in Lakewood
Get Live Lakewood Market Intelligence 👇

Explore Real-time Analytics
Airbnb Seasonality Analysis & Trends in Lakewood (2026)
Peak Season (July, June, August)
- Revenue averages $3,699 per month
- Occupancy rates average 62.3%
- Daily rates average $166
Shoulder Season
- Revenue averages $2,874 per month
- Occupancy maintains around 52.9%
- Daily rates hold near $163
Low Season (January, February, March)
- Revenue drops to average $2,016 per month
- Occupancy decreases to average 44.6%
- Daily rates adjust to average $146
Seasonality Insights for Lakewood
- The Airbnb seasonality in Lakewood shows highly seasonal trends requiring careful strategy. While the sections above show seasonal averages, it's also insightful to look at the extremes:
- During the high season, the absolute peak month showcases Lakewood's highest earning potential, with monthly revenues capable of climbing to $3,950, occupancy reaching a high of 63.9%, and ADRs peaking at $174.
- Conversely, the slowest single month of the year, typically falling within the low season, marks the market's lowest point. In this month, revenue might dip to $1,807, occupancy could drop to 36.9%, and ADRs may adjust down to $136.
- Understanding both the seasonal averages and these monthly peaks and troughs in revenue, occupancy, and ADR is crucial for maximizing your Airbnb profit potential in Lakewood.
Seasonal Strategies for Maximizing Profit
- Peak Season: Maximize revenue through premium pricing and potentially longer minimum stays. Ensure high availability.
- Low Season: Offer competitive pricing, special promotions (e.g., extended stay discounts), and flexible cancellation policies. Target off-season travelers like remote workers or budget-conscious guests.
- Shoulder Seasons: Implement dynamic pricing that balances peak and low rates. Target weekend travelers or specific events. Offer slightly more flexible terms than peak season.
- Regularly analyze your own performance against these Lakewood seasonality benchmarks and adjust your pricing and availability strategy accordingly.
Best Areas for Airbnb Investment in Lakewood (2026)
Exploring the top neighborhoods for short-term rentals in Lakewood? This section highlights key areas, outlining why they are attractive for hosts and guests, along with notable local attractions. Consider these locations based on your target guest profile and investment strategy.
| Neighborhood / Area | Why Host Here? (Target Guests & Appeal) | Key Attractions & Landmarks |
|---|---|---|
| Belmar | A vibrant mixed-use development with shopping, dining, and entertainment options. Popular among families and young professionals, making it a great spot for vacation rentals. | Belmar Shopping District, Lakewood Heritage Center, Civic Center Park, local restaurants and breweries |
| Green Mountain | A residential area close to outdoor activities and parks, appealing to those who love nature and hiking. Ideal for visitors seeking a quiet retreat yet easy access to the city. | Green Mountain Park, William Frederick Hayden Park, Bear Creek Lake Park, local trails and scenic views |
| Lakewood Commons | A bustling area with major retailers, restaurants, and entertainment venues, attracting visitors for shopping and dining experiences. | Lakewood Commons shopping area, local dining options, movie theaters, proximity to attractions like the Denver Federal Center |
| West Colfax | An up-and-coming neighborhood known for its cultural diversity and emerging art scene. Offers affordable lodging for tourists looking to explore the area. | West Colfax Avenue, local art galleries, Noble Energy Center, parks and community events |
| Colorado Mills | A premier outlet shopping center that draws in visitors from surrounding areas. Great location for hosting guests who enjoy shopping and dining. | Colorado Mills Mall, local dining options, entertainment venues, near to major highways |
| Stoney Creek | A quieter residential area that is family-friendly and close to parks. Suitable for longer-term stays for families visiting the area. | Stoney Creek Park, local schools, family-friendly amenities, close to recreational activities |
| Lakeside | Rich in history and close to the scenic lakes; a charming area with a local amusement park that attracts families and tourists alike. | Lakeside Amusement Park, local parks, beautiful lake views, historical sites |
| Estelle Heights | A suburban neighborhood that offers a cozy environment and proximity to various parks and local dining establishments, perfect for cozy getaways. | local parks, walking trails, community events, near shopping areas |
Understanding Airbnb License Requirements & STR Laws in Lakewood (2026)
With 14% of listings showing registration in 2026, understanding potential Airbnb license requirements is crucial in Lakewood. Always verify the latest short term rental regulations and Airbnb license requirements directly with local government authorities for Lakewood to ensure full compliance before hosting.
(Source: AirROI data, 2026, based on 14% licensed listings)
Top Performing Airbnb Properties in Lakewood (2026)
Benchmark your potential! Explore examples of top-performing Airbnb properties in Lakewoodbased on Trailing Twelve Month (TTM) revenue. Analyze their characteristics, revenue, occupancy rate, and ADR to understand what drives success in this market.
Castle Mountain Estate W/Salt Water Pool Near DT
Entire Place • 6 bedrooms

Immersive Spa Retreat - A Fantasy Smart Home
Entire Place • 4 bedrooms
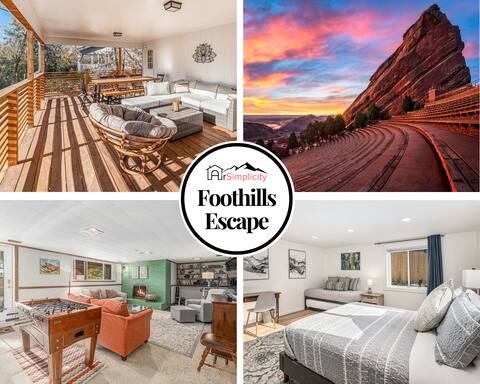
Foothills Escape - 10 min to Red Rocks
Entire Place • 5 bedrooms

Ultimate Lakewood Retreat | Air Hockey + Hot Tub
Entire Place • 7 bedrooms
New Ranch Build W/ HOT TUB & Pool table/Ping Pong
Entire Place • 5 bedrooms

Entertainers Dream | Hot Tub + Close to Everything
Entire Place • 4 bedrooms
Note: Performance varies based on location, size, amenities, seasonality, and management quality. Data reflects the past 12 months.
Top Performing Airbnb Hosts in Lakewood (2026)
Learn from the best! This table showcases top-performing Airbnb hosts in Lakewood based on the number of properties managed and estimated total revenue over the past year. Analyze their scale and performance metrics.
| Host Name | Properties | Grossing Revenue | Stay Reviews | Avg Rating |
|---|---|---|---|---|
| Scott | 5 | $243,865 | 163 | 4.83/5.0 |
| Brianna | 1 | $207,149 | 104 | 4.86/5.0 |
| John | 1 | $173,649 | 149 | 4.99/5.0 |
| Kendra | 8 | $153,076 | 222 | 4.70/5.0 |
| Bailey | 27 | $140,209 | 2048 | 4.49/5.0 |
| AirSimplicity | 1 | $137,361 | 21 | 5.00/5.0 |
| Evolve | 3 | $128,929 | 134 | 4.82/5.0 |
| Kyle Andrew | 2 | $124,259 | 125 | 4.84/5.0 |
| Allison | 5 | $119,635 | 121 | 4.94/5.0 |
| Alex | 3 | $111,496 | 327 | 4.85/5.0 |
Analyzing the strategies of top hosts, such as their property selection, pricing, and guest communication, can offer valuable lessons for optimizing your own Airbnb operations in Lakewood.
Dive Deeper: Advanced Lakewood STR Market Data (2026)
Ready to unlock more insights? AirROI provides access to advanced metrics and comprehensive Airbnb data for Lakewood. Explore detailed analytics beyond this report to refine your investment strategy, optimize pricing, and maximize your vacation rental profits.
Explore Advanced MetricsLakewood Short-Term Rental Market Composition (2026): Property & Room Types
Room Type Distribution
Property Type Distribution
Market Composition Insights for Lakewood
- The Lakewood Airbnb market composition is heavily skewed towards Entire Home/Apt listings, which make up 74.1% of the 371 active rentals. This indicates strong guest preference for privacy and space.
- Looking at the property type distribution in Lakewood, House properties are the most common (65%), reflecting the local real estate landscape.
- Houses represent a significant 65% portion, catering likely to families or larger groups.
- The presence of 7.3% Hotel/Boutique listings indicates integration with traditional hospitality.
- Smaller segments like outdoor/unique (combined 0.8%) offer potential for unique stay experiences.
Lakewood Airbnb Room Capacity Analysis (2026): Bedroom Distribution
Distribution of Listings by Number of Bedrooms
Room Capacity Insights for Lakewood
- The dominant room capacity in Lakewood is 1 bedroom listings, making up 29.4% of the market. This suggests a strong demand for properties suitable for couples or solo travelers.
- Together, 1 bedroom and 2 bedrooms properties represent 52.6% of the active Airbnb listings in Lakewood, indicating a high concentration in these sizes.
- A significant 24.2% of listings offer 3+ bedrooms, catering to larger groups and families seeking more space in Lakewood.
Lakewood Vacation Rental Guest Capacity Trends (2026)
Distribution of Listings by Guest Capacity
Guest Capacity Insights for Lakewood
- The most common guest capacity trend in Lakewood vacation rentals is listings accommodating 4 guests (21.3%). This suggests the primary traveler segment is likely small families or groups.
- Properties designed for 4 guests and 2 guests dominate the Lakewood STR market, accounting for 41.2% of listings.
- 27.8% of properties accommodate 6+ guests, serving the market segment for larger families or group travel in Lakewood.
- On average, properties in Lakewood are equipped to host 3.5 guests.
Lakewood Airbnb Booking Patterns (2026): Available vs. Booked Days
Available Days Distribution
Booked Days Distribution
Booking Pattern Insights for Lakewood
- The most common availability pattern in Lakewood falls within the 181-270 days range, representing 32.6% of listings. This suggests many properties have significant open periods on their calendars.
- Approximately 61.7% of listings show high availability (181+ days open annually), indicating potential for increased bookings or specific owner usage patterns.
- For booked days, the 91-180 days range is most frequent in Lakewood (32.1%), reflecting common guest stay durations or potential owner blocking patterns.
- A notable 39.1% of properties secure long booking periods (181+ days booked per year), highlighting successful long-term rental strategies or significant owner usage.
Lakewood Airbnb Minimum Stay Requirements Analysis
Distribution of Listings by Minimum Night Requirement
1 Night
72 listings
19.4% of total
2 Nights
66 listings
17.8% of total
3 Nights
10 listings
2.7% of total
4-6 Nights
24 listings
6.5% of total
7-29 Nights
59 listings
15.9% of total
30+ Nights
140 listings
37.7% of total
Key Insights
- The most prevalent minimum stay requirement in Lakewood is 30+ Nights, adopted by 37.7% of listings. This highlights the market's preference for longer commitments.
- A significant segment (37.7%) caters to monthly stays (30+ nights) in Lakewood, pointing to opportunities in the extended-stay market.
Recommendations
- Align with the market by considering a 30+ Nights minimum stay, as 37.7% of Lakewood hosts use this setting.
- If feasible, allowing 1-night stays, especially midweek or during low season, could capture last-minute bookings, as only 19.4% currently do.
- Explore offering discounts for stays of 30+ nights to attract the 37.7% of the market seeking extended stays.
- Adjust minimum nights based on seasonality – potentially shorter during low season and longer during peak demand periods in Lakewood.
Lakewood Airbnb Cancellation Policy Trends Analysis (2026)
Limited
9 listings
2.4% of total
Flexible
65 listings
17.6% of total
Moderate
93 listings
25.1% of total
Firm
156 listings
42.2% of total
Strict
47 listings
12.7% of total
Cancellation Policy Insights for Lakewood
- The prevailing Airbnb cancellation policy trend in Lakewood is Firm, used by 42.2% of listings.
- A majority (54.9%) of hosts in Lakewood utilize Firm or Strict policies, indicating a market where hosts prioritize booking security.
Recommendations for Hosts
- Consider adopting a Firm policy to align with the 42.2% market standard in Lakewood.
- Using a Strict policy might deter some guests, as only 12.7% of listings use it. Evaluate if potential revenue protection outweighs possible lower booking rates.
- Regularly review your cancellation policy against competitors and market demand shifts in Lakewood.
Lakewood STR Booking Lead Time Analysis (2026)
Average Booking Lead Time by Month
Booking Lead Time Insights for Lakewood
- The overall average booking lead time for vacation rentals in Lakewood is 38 days.
- Guests book furthest in advance for stays during July (average 59 days), likely coinciding with peak travel demand or local events.
- The shortest booking windows occur for stays in February (average 20 days), indicating more last-minute travel plans during this time.
- Seasonally, Summer (55 days avg.) sees the longest lead times, while Winter (26 days avg.) has the shortest, reflecting typical travel planning cycles.
Recommendations for Hosts
- Use the overall average lead time (38 days) as a baseline for your pricing and availability strategy in Lakewood.
- For July stays, consider implementing length-of-stay discounts or slightly higher rates for bookings made less than 59 days out to capitalize on advance planning.
- Target marketing efforts for the Summer season well in advance (at least 55 days) to capture early planners.
- Monitor your own booking lead times against these Lakewood averages to identify opportunities for dynamic pricing adjustments.
Popular & Essential Airbnb Amenities in Lakewood (2026)
Amenity Prevalence
Amenity Insights for Lakewood
- Essential amenities in Lakewood that guests expect include: Wifi, Smoke alarm. Lacking these (any) could significantly impact bookings.
- Popular amenities like Heating, Carbon monoxide alarm, Free parking on premises are common but not universal. Offering these can provide a competitive edge.
Recommendations for Hosts
- Ensure your listing includes all essential amenities for Lakewood: Wifi, Smoke alarm.
- Prioritize adding missing essentials: Wifi, Smoke alarm.
- Consider adding popular differentiators like Heating or Carbon monoxide alarm to increase appeal.
- Highlight unique or less common amenities you offer (e.g., hot tub, dedicated workspace, EV charger) in your listing description and photos.
- Regularly check competitor amenities in Lakewood to stay competitive.
Lakewood Airbnb Guest Demographics & Profile Analysis (2026)
Guest Profile Summary for Lakewood
- The typical guest profile for Airbnb in Lakewood consists of primarily domestic travelers (96%), often arriving from nearby Denver, typically belonging to the Post-2000s (Gen Z/Alpha) group (50%), primarily speaking English or Spanish.
- Domestic travelers account for 95.8% of guests.
- Key international markets include United States (95.8%) and Canada (0.9%).
- Top languages spoken are English (71.4%) followed by Spanish (15.4%).
- A significant demographic segment is the Post-2000s (Gen Z/Alpha) group, representing 50% of guests.
Recommendations for Hosts
- Target domestic marketing efforts towards travelers from Denver and Austin.
- Tailor amenities and listing descriptions to appeal to the dominant Post-2000s (Gen Z/Alpha) demographic (e.g., highlight fast WiFi, smart home features, local guides).
- Highlight unique local experiences or amenities relevant to the primary guest profile.
- Consider seasonal promotions aligned with peak travel times for key origin markets.
Nearby Short-Term Rental Market Comparison
How does the Lakewood Airbnb market stack up against its neighbors? Compare key performance metrics like average monthly revenue, ADR, and occupancy rates in surrounding areas to understand the broader regional STR landscape.
| Market | Active Properties | Monthly Revenue | Daily Rate | Avg. Occupancy |
|---|---|---|---|---|
| Blue River | 201 | $7,203 | $609.20 | 45% |
| Aspen | 610 | $7,095 | $992.28 | 36% |
| Snowmass | 21 | $6,247 | $701.59 | 40% |
| Aspen Park | 11 | $5,825 | $395.00 | 54% |
| Indian Hills | 11 | $5,799 | $333.03 | 54% |
| Grand County | 14 | $5,137 | $513.48 | 42% |
| Breckenridge | 3,051 | $4,995 | $544.32 | 40% |
| Crested Butte | 267 | $4,956 | $536.90 | 42% |
| Snowmass Village | 636 | $4,938 | $711.61 | 35% |
| Black Hawk | 133 | $4,884 | $328.37 | 52% |