Green Mountain Falls Airbnb Market Analysis 2026: Short Term Rental Data & Vacation Rental Statistics in Colorado, United States
Is Airbnb profitable in Green Mountain Falls in 2026? Explore comprehensive Airbnb analytics for Green Mountain Falls, Colorado, United States to uncover income potential. This 2026 STR market report for Green Mountain Falls, based on AirROI data from February 2025 to January 2026, reveals key trends in the niche market of 77 active listings.
Whether you're considering an Airbnb investment in Green Mountain Falls, optimizing your existing vacation rental, or exploring rental arbitrage opportunities, understanding the Green Mountain Falls Airbnb data is crucial. Leveraging the low regulation environment is key to maximizing your short term rental income potential. Let's dive into the specifics.
Key Green Mountain Falls Airbnb Performance Metrics Overview
Monthly Airbnb Revenue Variations & Income Potential in Green Mountain Falls (2026)
Understanding the monthly revenue variations for Airbnb listings in Green Mountain Falls is key to maximizing your short term rental income potential. Seasonality significantly impacts earnings. Our analysis, based on data from the past 12 months, shows that the peak revenue month for STRs in Green Mountain Falls is typically July, while February often presents the lowest earnings, highlighting opportunities for strategic pricing adjustments during shoulder and low seasons. Explore the typical Airbnb income in Green Mountain Falls across different performance tiers:
- Best-in-class properties (Top 10%) achieve $8,536+ monthly, often utilizing dynamic pricing and superior guest experiences.
- Strong performing properties (Top 25%) earn $5,469 or more, indicating effective management and desirable locations/amenities.
- Typical properties (Median) generate around $3,052 per month, representing the average market performance.
- Entry-level properties (Bottom 25%) see earnings around $1,826, often with potential for optimization.
Average Monthly Airbnb Earnings Trend in Green Mountain Falls
Green Mountain Falls Airbnb Occupancy Rate Trends (2026)
Maximize your bookings by understanding the Green Mountain Falls STR occupancy trends. Seasonal demand shifts significantly influence how often properties are booked. Typically, Julysees the highest demand (peak season occupancy), while January experiences the lowest (low season). Effective strategies, like adjusting minimum stays or offering promotions, can boost occupancy during slower periods. Here's how different property tiers perform in Green Mountain Falls:
- Best-in-class properties (Top 10%) achieve 76%+ occupancy, indicating high desirability and potentially optimized availability.
- Strong performing properties (Top 25%) maintain 62% or higher occupancy, suggesting good market fit and guest satisfaction.
- Typical properties (Median) have an occupancy rate around 46%.
- Entry-level properties (Bottom 25%) average 29% occupancy, potentially facing higher vacancy.
Average Monthly Occupancy Rate Trend in Green Mountain Falls
Average Daily Rate (ADR) Airbnb Trends in Green Mountain Falls (2026)
Effective short term rental pricing strategy in Green Mountain Falls involves understanding monthly ADR fluctuations. The Average Daily Rate (ADR) for Airbnb in Green Mountain Falls typically peaks in July and dips lowest during February. Leveraging Airbnb dynamic pricing tools or strategies based on this seasonality can significantly boost revenue. Here's a look at the typical nightly rates achieved:
- Best-in-class properties (Top 10%) command rates of $448+ per night, often due to premium features or locations.
- Strong performing properties (Top 25%) achieve nightly rates of $312 or more.
- Typical properties (Median) charge around $221 per night.
- Entry-level properties (Bottom 25%) earn around $171 per night.
Average Daily Rate (ADR) Trend by Month in Green Mountain Falls
Get Live Green Mountain Falls Market Intelligence 👇

Explore Real-time Analytics
Airbnb Seasonality Analysis & Trends in Green Mountain Falls (2026)
Peak Season (July, June, August)
- Revenue averages $6,209 per month
- Occupancy rates average 62.4%
- Daily rates average $301
Shoulder Season
- Revenue averages $3,927 per month
- Occupancy maintains around 44.1%
- Daily rates hold near $258
Low Season (January, February, April)
- Revenue drops to average $2,363 per month
- Occupancy decreases to average 32.0%
- Daily rates adjust to average $230
Seasonality Insights for Green Mountain Falls
- The Airbnb seasonality in Green Mountain Falls shows highly seasonal trends requiring careful strategy. While the sections above show seasonal averages, it's also insightful to look at the extremes:
- During the high season, the absolute peak month showcases Green Mountain Falls's highest earning potential, with monthly revenues capable of climbing to $6,865, occupancy reaching a high of 65.5%, and ADRs peaking at $308.
- Conversely, the slowest single month of the year, typically falling within the low season, marks the market's lowest point. In this month, revenue might dip to $1,922, occupancy could drop to 25.3%, and ADRs may adjust down to $225.
- Understanding both the seasonal averages and these monthly peaks and troughs in revenue, occupancy, and ADR is crucial for maximizing your Airbnb profit potential in Green Mountain Falls.
Seasonal Strategies for Maximizing Profit
- Peak Season: Maximize revenue through premium pricing and potentially longer minimum stays. Ensure high availability.
- Low Season: Offer competitive pricing, special promotions (e.g., extended stay discounts), and flexible cancellation policies. Target off-season travelers like remote workers or budget-conscious guests.
- Shoulder Seasons: Implement dynamic pricing that balances peak and low rates. Target weekend travelers or specific events. Offer slightly more flexible terms than peak season.
- Regularly analyze your own performance against these Green Mountain Falls seasonality benchmarks and adjust your pricing and availability strategy accordingly.
Best Areas for Airbnb Investment in Green Mountain Falls (2026)
Exploring the top neighborhoods for short-term rentals in Green Mountain Falls? This section highlights key areas, outlining why they are attractive for hosts and guests, along with notable local attractions. Consider these locations based on your target guest profile and investment strategy.
| Neighborhood / Area | Why Host Here? (Target Guests & Appeal) | Key Attractions & Landmarks |
|---|---|---|
| Downtown Green Mountain Falls | The heart of the community, this area is known for its beautiful scenery, charming shops, and restaurants. It's an ideal location for visitors looking to experience local culture and outdoor activities. | Green Mountain Falls Park, Giant's Playground, Crystal Falls, Fishing in Crystal Lake, Local dining options, Walking trails |
| North Pasco | A serene residential area with easy access to outdoor activities, attracting families and nature enthusiasts. Close to hiking trails and parks, making it a favorite among visitors who enjoy nature. | Pikes Peak National Forest, North Slope Recreation Area, Hiking trails, Birdwatching, Picnicking spots, Local wildlife |
| South Green Mountain Falls | Known for its picturesque views and tranquil environment, this area offers a peaceful getaway close to nature. Ideal for those looking to escape the hustle and bustle of city life. | Colorful falls and streams, Mountain views, Scenic driving routes, Photography spots, Wildflower viewing, Outdoor sports |
| Crystal Lake | This area is perfect for those who enjoy being close to water activities. Crystal Lake offers a scenic backdrop and is popular for fishing, kayaking, and picnicking. | Crystal Lake, Fishing spots, Kayaking opportunities, Scenic picnic areas, Hiking nearby, Wildlife viewing |
| Manitou Springs | A nearby quirky town known for its mineral springs, art scene, and historic attractions. Offers a unique blend of local culture and beautiful nature, attracting a diverse range of visitors. | Manitou Springs Penny Arcade, Manitou Incline, Garden of the Gods, Local galleries, Natural mineral springs, Shops and cafes |
| Woodland Park | A family-friendly area with plenty of recreational activities. Close to attractions like Pikes Peak, offering lots of outdoor fun and exploration for visitors. | Pikes Peak, Woodland Park Zoo, Hiking and biking trails, Scenic parks, Shopping and dining, Annual events |
| Ute Pass | This scenic area is known for its breathtaking views and proximity to the mountains. Popular for its outdoor activities and as a peaceful retreat for visitors looking to connect with nature. | Ute Pass Trail, Breathtaking panoramic views, Hiking opportunities, Wildlife photography, Picnic areas, Nature exploration |
| Cheyenne Mountain State Park | Just a bit further out, this park is known for its natural beauty and well-maintained trails. Ideal for getting away into nature and attracting those who seek adventure. | Hiking trails, Mountain biking, Wildlife viewing, Camping areas, Panoramic viewpoints, Nature programs |
Understanding Airbnb License Requirements & STR Laws in Green Mountain Falls (2026)
While Green Mountain Falls, Colorado, United States currently shows low STR regulations, specific Airbnb license requirements might still exist or change. Always verify the latest short term rental regulations and Airbnb license requirements directly with local government authorities for Green Mountain Falls to ensure full compliance before hosting.
(Source: AirROI data, 2026, based on 1% licensed listings)
Top Performing Airbnb Properties in Green Mountain Falls (2026)
Benchmark your potential! Explore examples of top-performing Airbnb properties in Green Mountain Fallsbased on Trailing Twelve Month (TTM) revenue. Analyze their characteristics, revenue, occupancy rate, and ADR to understand what drives success in this market.

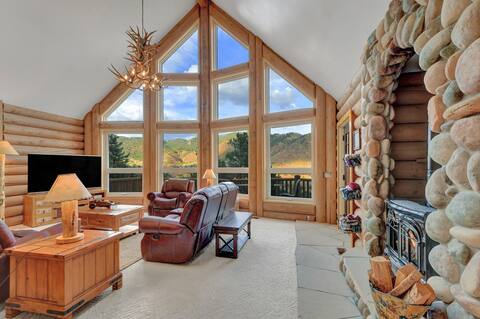
Cabin at Pike's Peak Falls
Entire Place • 6 bedrooms
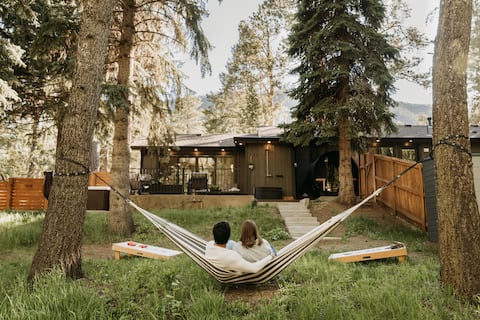
Hawk's Landing - pet friendly, hot tub, luxurious
Entire Place • 6 bedrooms

Luxury Mountain Cabin w/ Views, Hot Tub, Fireplace
Entire Place • 2 bedrooms
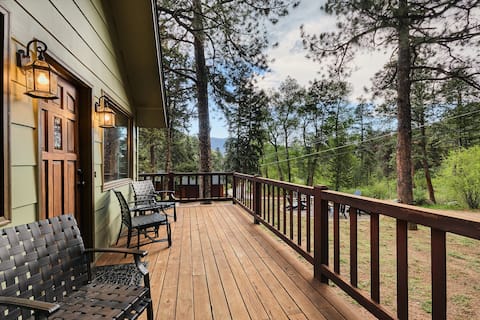
RiverHouse South with Sauna, Hot Tub, Fireplace
Entire Place • 1 bedroom

Mountain Cabin: Hot Tub, Fireplaces, Loft, Views
Entire Place • 2 bedrooms
Hot tub - Fire-pit - Walk to waterfalls
Entire Place • 3 bedrooms
Note: Performance varies based on location, size, amenities, seasonality, and management quality. Data reflects the past 12 months.
Top Performing Airbnb Hosts in Green Mountain Falls (2026)
Learn from the best! This table showcases top-performing Airbnb hosts in Green Mountain Falls based on the number of properties managed and estimated total revenue over the past year. Analyze their scale and performance metrics.
| Host Name | Properties | Grossing Revenue | Stay Reviews | Avg Rating |
|---|---|---|---|---|
| Sherri | 13 | $434,236 | 1824 | 4.72/5.0 |
| Jonathan & Kelly | 3 | $334,721 | 861 | 4.97/5.0 |
| Oana | 2 | $237,663 | 317 | 4.97/5.0 |
| DavidJ | 5 | $206,771 | 659 | 4.89/5.0 |
| Steven | 1 | $180,591 | 113 | 4.99/5.0 |
| Dreambnb | 3 | $114,585 | 283 | 4.78/5.0 |
| Stay Colorado (Tim And Team) | 1 | $100,438 | 125 | 4.95/5.0 |
| Kayla | 1 | $92,741 | 33 | 4.82/5.0 |
| Andy | 1 | $87,412 | 179 | 4.92/5.0 |
| David | 1 | $87,200 | 67 | 4.97/5.0 |
Analyzing the strategies of top hosts, such as their property selection, pricing, and guest communication, can offer valuable lessons for optimizing your own Airbnb operations in Green Mountain Falls.
Dive Deeper: Advanced Green Mountain Falls STR Market Data (2026)
Ready to unlock more insights? AirROI provides access to advanced metrics and comprehensive Airbnb data for Green Mountain Falls. Explore detailed analytics beyond this report to refine your investment strategy, optimize pricing, and maximize your vacation rental profits.
Explore Advanced MetricsGreen Mountain Falls Short-Term Rental Market Composition (2026): Property & Room Types
Room Type Distribution
Property Type Distribution
Market Composition Insights for Green Mountain Falls
- The Green Mountain Falls Airbnb market composition is heavily skewed towards Entire Home/Apt listings, which make up 92.2% of the 77 active rentals. This indicates strong guest preference for privacy and space.
- Looking at the property type distribution in Green Mountain Falls, Outdoor/Unique properties are the most common (54.5%), reflecting the local real estate landscape.
- Houses represent a significant 33.8% portion, catering likely to families or larger groups.
- Smaller segments like others (combined 2.6%) offer potential for unique stay experiences.
Green Mountain Falls Airbnb Room Capacity Analysis (2026): Bedroom Distribution
Distribution of Listings by Number of Bedrooms
Room Capacity Insights for Green Mountain Falls
- The dominant room capacity in Green Mountain Falls is 2 bedrooms listings, making up 33.8% of the market. This suggests a strong demand for properties suitable for couples or solo travelers.
- Together, 2 bedrooms and 3 bedrooms properties represent 61.1% of the active Airbnb listings in Green Mountain Falls, indicating a high concentration in these sizes.
- A significant 41.6% of listings offer 3+ bedrooms, catering to larger groups and families seeking more space in Green Mountain Falls.
Green Mountain Falls Vacation Rental Guest Capacity Trends (2026)
Distribution of Listings by Guest Capacity
Guest Capacity Insights for Green Mountain Falls
- The most common guest capacity trend in Green Mountain Falls vacation rentals is listings accommodating 6 guests (26%). This suggests the primary traveler segment is likely larger groups.
- Properties designed for 6 guests and 8+ guests dominate the Green Mountain Falls STR market, accounting for 50.7% of listings.
- 52.0% of properties accommodate 6+ guests, serving the market segment for larger families or group travel in Green Mountain Falls.
- On average, properties in Green Mountain Falls are equipped to host 5.2 guests.
Green Mountain Falls Airbnb Booking Patterns (2026): Available vs. Booked Days
Available Days Distribution
Booked Days Distribution
Booking Pattern Insights for Green Mountain Falls
- The most common availability pattern in Green Mountain Falls falls within the 181-270 days range, representing 36.4% of listings. This suggests many properties have significant open periods on their calendars.
- Approximately 68.9% of listings show high availability (181+ days open annually), indicating potential for increased bookings or specific owner usage patterns.
- For booked days, the 91-180 days range is most frequent in Green Mountain Falls (36.4%), reflecting common guest stay durations or potential owner blocking patterns.
- A notable 31.2% of properties secure long booking periods (181+ days booked per year), highlighting successful long-term rental strategies or significant owner usage.
Green Mountain Falls Airbnb Minimum Stay Requirements Analysis
Distribution of Listings by Minimum Night Requirement
1 Night
8 listings
10.4% of total
2 Nights
37 listings
48.1% of total
3 Nights
4 listings
5.2% of total
4-6 Nights
3 listings
3.9% of total
7-29 Nights
4 listings
5.2% of total
30+ Nights
21 listings
27.3% of total
Key Insights
- The most prevalent minimum stay requirement in Green Mountain Falls is 2 Nights, adopted by 48.1% of listings. This highlights the market's preference for shorter, flexible bookings.
- A significant segment (27.3%) caters to monthly stays (30+ nights) in Green Mountain Falls, pointing to opportunities in the extended-stay market.
Recommendations
- Align with the market by considering a 2 Nights minimum stay, as 48.1% of Green Mountain Falls hosts use this setting.
- If feasible, allowing 1-night stays, especially midweek or during low season, could capture last-minute bookings, as only 10.4% currently do.
- A 2-night minimum appears standard (48.1%). Consider this for weekends or peak periods.
- Explore offering discounts for stays of 30+ nights to attract the 27.3% of the market seeking extended stays.
- Adjust minimum nights based on seasonality – potentially shorter during low season and longer during peak demand periods in Green Mountain Falls.
Green Mountain Falls Airbnb Cancellation Policy Trends Analysis (2026)
Super Strict 60 Days
1 listings
1.3% of total
Super Strict 30 Days
2 listings
2.6% of total
Flexible
3 listings
3.9% of total
Moderate
16 listings
20.8% of total
Firm
40 listings
51.9% of total
Strict
15 listings
19.5% of total
Cancellation Policy Insights for Green Mountain Falls
- The prevailing Airbnb cancellation policy trend in Green Mountain Falls is Firm, used by 51.9% of listings.
- A majority (71.4%) of hosts in Green Mountain Falls utilize Firm or Strict policies, indicating a market where hosts prioritize booking security.
Recommendations for Hosts
- Consider adopting a Firm policy to align with the 51.9% market standard in Green Mountain Falls.
- Regularly review your cancellation policy against competitors and market demand shifts in Green Mountain Falls.
Green Mountain Falls STR Booking Lead Time Analysis (2026)
Average Booking Lead Time by Month
Booking Lead Time Insights for Green Mountain Falls
- The overall average booking lead time for vacation rentals in Green Mountain Falls is 59 days.
- Guests book furthest in advance for stays during June (average 86 days), likely coinciding with peak travel demand or local events.
- The shortest booking windows occur for stays in February (average 25 days), indicating more last-minute travel plans during this time.
- Seasonally, Summer (77 days avg.) sees the longest lead times, while Winter (38 days avg.) has the shortest, reflecting typical travel planning cycles.
Recommendations for Hosts
- Use the overall average lead time (59 days) as a baseline for your pricing and availability strategy in Green Mountain Falls.
- For June stays, consider implementing length-of-stay discounts or slightly higher rates for bookings made less than 86 days out to capitalize on advance planning.
- Target marketing efforts for the Summer season well in advance (at least 77 days) to capture early planners.
- Monitor your own booking lead times against these Green Mountain Falls averages to identify opportunities for dynamic pricing adjustments.
Popular & Essential Airbnb Amenities in Green Mountain Falls (2026)
Amenity Prevalence
Amenity Insights for Green Mountain Falls
- Essential amenities in Green Mountain Falls that guests expect include: Free parking on premises, Wifi, Smoke alarm, TV, Heating, Fire extinguisher, Carbon monoxide alarm, Hot water. Lacking these (any) could significantly impact bookings.
- Popular amenities like Essentials, Dishes and silverware are common but not universal. Offering these can provide a competitive edge.
Recommendations for Hosts
- Ensure your listing includes all essential amenities for Green Mountain Falls: Free parking on premises, Wifi, Smoke alarm, TV, Heating, Fire extinguisher, Carbon monoxide alarm, Hot water.
- Prioritize adding missing essentials: Smoke alarm, TV, Heating, Fire extinguisher, Carbon monoxide alarm, Hot water.
- Consider adding popular differentiators like Essentials or Dishes and silverware to increase appeal.
- Highlight unique or less common amenities you offer (e.g., hot tub, dedicated workspace, EV charger) in your listing description and photos.
- Regularly check competitor amenities in Green Mountain Falls to stay competitive.
Green Mountain Falls Airbnb Guest Demographics & Profile Analysis (2026)
Guest Profile Summary for Green Mountain Falls
- The typical guest profile for Airbnb in Green Mountain Falls consists of primarily domestic travelers (98%), often arriving from nearby Denver, typically belonging to the Post-2000s (Gen Z/Alpha) group (50%), primarily speaking English or Spanish.
- Domestic travelers account for 98.1% of guests.
- Key international markets include United States (98.1%) and Germany (0.3%).
- Top languages spoken are English (72.9%) followed by Spanish (13.4%).
- A significant demographic segment is the Post-2000s (Gen Z/Alpha) group, representing 50% of guests.
Recommendations for Hosts
- Target domestic marketing efforts towards travelers from Denver and Colorado Springs.
- Tailor amenities and listing descriptions to appeal to the dominant Post-2000s (Gen Z/Alpha) demographic (e.g., highlight fast WiFi, smart home features, local guides).
- Highlight unique local experiences or amenities relevant to the primary guest profile.
- Consider seasonal promotions aligned with peak travel times for key origin markets.
Nearby Short-Term Rental Market Comparison
How does the Green Mountain Falls Airbnb market stack up against its neighbors? Compare key performance metrics like average monthly revenue, ADR, and occupancy rates in surrounding areas to understand the broader regional STR landscape.
| Market | Active Properties | Monthly Revenue | Daily Rate | Avg. Occupancy |
|---|---|---|---|---|
| Blue River | 201 | $7,203 | $609.20 | 45% |
| Aspen | 610 | $7,095 | $992.28 | 36% |
| Snowmass | 21 | $6,247 | $701.59 | 40% |
| Aspen Park | 11 | $5,825 | $395.00 | 54% |
| Indian Hills | 11 | $5,799 | $333.03 | 54% |
| Breckenridge | 3,051 | $4,995 | $544.32 | 40% |
| Crested Butte | 267 | $4,956 | $536.90 | 42% |
| Snowmass Village | 636 | $4,938 | $711.61 | 35% |
| Black Hawk | 133 | $4,884 | $328.37 | 52% |
| Beaver Creek | 522 | $4,818 | $901.27 | 30% |